Moving Average-TREND POWER v2.0-(AS)HELLO:
-This indicator is a waaaay simpler version of my other script - Moving Average-TREND POWER v1.1-(AS).
HOW DOES IT WORK:
-Script counts number of bars below or above selected Moving Average (u can se them by turning PLOT BARS on). Then multiplies number of bars by 0.01 and adds previous value. So in the uptrend indicator will be growing faster with every bar when price is above MA. When MA crosess price Value goes to zero so it shows when the market is ranging.
If Cross happens when number of bars is higher than Upper threshold or below Lower threshold indicator will go back to zero only if MA crosses with high in UPtrend and low in DNtrend. If cross happens inside THSs Value will be zero when MA crosses with any type of price source like for example (close,high,low,ohlc4,hl etc.....).This helps to get more crosess in side trend and less resets during a visible trend
HOW TO SET:
Just select what type of MA you want to use and Length. Then based on your preference set values of THSs'
OTHER INFORMATIONS:
-Script was created and tested on EURUSD 5M.
-For bigger trends choose slowerMAs and bigger periods and the other way around for short trends (FasterMAs/shorter periods)
-Below script code you can find not used formulas for calculating indicator value(thanks chat GPT), If you know some pinescript I encourage you to try try them or maybe bulid better ones. Script uses most basic one.
-Pls give me some feedback/ideas to improve and check out first version. Its way more complicated for no real reason but still worth to take a look'
-Also let me know if you find some logical errors in the code.
Enjoy and till we meet again.
Trendtrading

Moving Average - TREND POWER v1.1- (AS)0)NOTE:
This is first version of this indicator. It's way more complicated than it should be. Check out Moving Average-TREND POWER v2.1-(AS), its waaaaay less complicated and might be better.Enjoy...
1)INTRODUCTION/MAIN IDEA:
In simpliest form this script is a trend indicator that rises if Moving average if below price or falling if above and going back to zero if there is a crossover with a price. To use this indicator you will have to adjust settings of MAs and choose conditions for calculation.
While using the indicator we might have to define CROSS types or which MAs to use. List of what cross types are defined in the script and Conditiones to choose from.The list will be below.
2) COMPOSITION:
-MA1 can be defined by user in settings, possible types: SMA, EMA, RMA, HMA, TEMA, DEMA, LSMA, WMA.
-MA2 is always ALMA
3) OVERLAY:
Default is false but if you want to see MA1/2 on chart you can change code to true and then turn on overlay in settings. Most plot settings are avalible only in OV=false.
if OV=true possible plots ->MA1/2, plotshape when choosen cross type
if OV=false -> main indicator,TSHs,Cross counter
4)PRESETS :
Indicator has three modes that can be selected in settings. First two are presets and do not require selecting conditions as they set be default.
-SIMPLE - most basic
-ABSOLUTE - shows only positive values when market is trending or zero when in range
-CUSTOM - main and the most advanced form that will require setting conditions to use in calculating trend
4.1)SIMPLE – this is the most basic form of conditions that uses only First MA. If MA1 is below selected source (High/Low(High for Uptrend and Low for DNtrend or OHLC4) on every bar value rises by 0.02. if it above Low or OHLC4 it falls by 0.02 with every bar. If there is a cross of MA with price value is zero. This preset uses CROSS_1_ULT(list of all cross types below)
4.2) ABSOLUTE – does not show direction of the trend unlike others and uses both MA1 and MA2. Uses CROSS type 123_ULT
4.3) CUSTOM – here we define conditions manually. This mode is defined in parts (5-8 of description)
5)SETTINGS:
SOURCE/OVERLAY(line1) – select source of calculation form MA1/MA2, select for overlay true (look point 3)
TRESHOLDS(line2). – set upper and lower THS, turn TSHs on/off
MA1(line3) – Length/type of MA/Offset(only if MA type is LSM)
MA2(line4) – length/offset/sigma -(remember to set ma in the way that in Uptrend MA2MA1 in DNtrend)
Use faster MA types for short term trends and slower types / bigger periods for longer term trends, defval MA1/2 settings
are pretty much random so using them is not recomended.
CROSSshape(line5) – choose which cross type you want to plot on chart(only in OV=true) or what type you want to use in counting via for loops,
CROSScount(line6) – set lookback for type of cross choosen above
BOOLs in lines 5 and 6 - plotshape if OV=true/plot CROSScount histogram (if OV=false)
Lines 7 and 8 – PRESET we want to use /SRC for calculation of indicator/are conditions described below/which MAs to use/Condition for
reducing value t 0 - (if PRESET is ABSOLUTE or SIMPLE only SRC should be set(Line 8 does not matter if not CUSTOM))
5)SOURCE for CONDS:
Here you can choose between H/L and OHLC. If H/L value grow when MAlow. If OHLC MAOHLC. H/L is set by default and recommended. This can be selected for all presets not only CUSTOM
6)CROSS types LIST:
“1 means MA1, 2 is MA2 and 3 I cross of MA1/MA2. L stands for low and H for high so for example 2H means cross of MA2 and high”
NAME -DEFINITION Number of possible crosses
1L - cross of MA1 and low 1
1H - cross of MA1 and high 1
1HL - cross of MA1 and low or MA1 and high 2 -1L/1H
2L - cross of MA2 and low 1
2H - cross of MA2 and high 1
2HL - cross of MA2 and low or MA1 and high 2 -2L/2H
12L - cross of MA1 and low or MA2 and low 2 -1L/2L
12H - cross of MA1 and high or MA2 and high 2 -1H/2H
12HL - MA1/2 and high/low 4 -1H/1L/2H/2L
3 -cross of MA1 and MA2 1
123HL -crosses from 12HL or 3 5 -12HL/3
1_ULT - cross of MA1 with any of price sources(close,low,high,ohlc4 etc…)
2_ULT - cross of MA2 with any of price sources(close,low,high,ohlc4 etc…)
123_ULT – all crosses possible of MA1/2 (all of the above so a lot)
7)CRS CONDS:
“conditions to reduce value back to zero”
>/< - 0 if indicator shows Uptrend and there’s a cross with high of selected MA or 0 if in DNtrend and cross with low. Better for UP/DN trend detection
ALL – 0 if cross of MA with high or low no matter the trend, better for detecting consolidation
ULT – if any cross of selected MA, most crosses so goes to 0 most often
8)MA selection and CONDS:
-MA1: only MA1 is used,if MA1 below price value grows and the other way around
MA1price =-0.02
-MA2 – only MA2 is used, same conditions as MA1 but using MA2
MA2price =-0.02
-BOTH – MA1 and MA2 used, grows when MA1 if below, grows faster if MA1 and MA2 are below and fastest when MA1 and MA2 are below and MA2price=-0.02
-MA1 and MA2 >price=-0.03
-MA1 and MA2 ?price and MA2>MA1=-0.04
9)CONDITIONS SELECTION SUMMARRY:
So when CUSTOM we choose :
1)SOURCE – H/L or OHLC
2)MAs – MA1/MA2/BOTH
3)CRS CONDS (>/<,ALL,ULT)
So for example...
if we take MA1 and ALL value will go to zero if 1HL
if MA1 and >/< - 0 if 1L or 1H (depending if value is positive or negative).(1L or 1H)
If ALL and BOTH zero when 12HL
If BOTH and ULT value goes back to zero if Theres any cross of MA1/MA2 with price or cross of MA1 and MA2.(123_ULT)
If >/< and BOTH – 0 if 12L in DNtrend or 12H if UPtrend
10) OTHERS
-script was created on EURUSD 5M and wasn't tested on different markets
-default values of MA1/MA2 aren't optimalized so do not
-There might be a logical error in the script so let me know if you find it (most probably in 'BOTH')
-thanks to @AlifeToMake for help
-if you have any ideas to improve let me know
-there are also tooltips to help

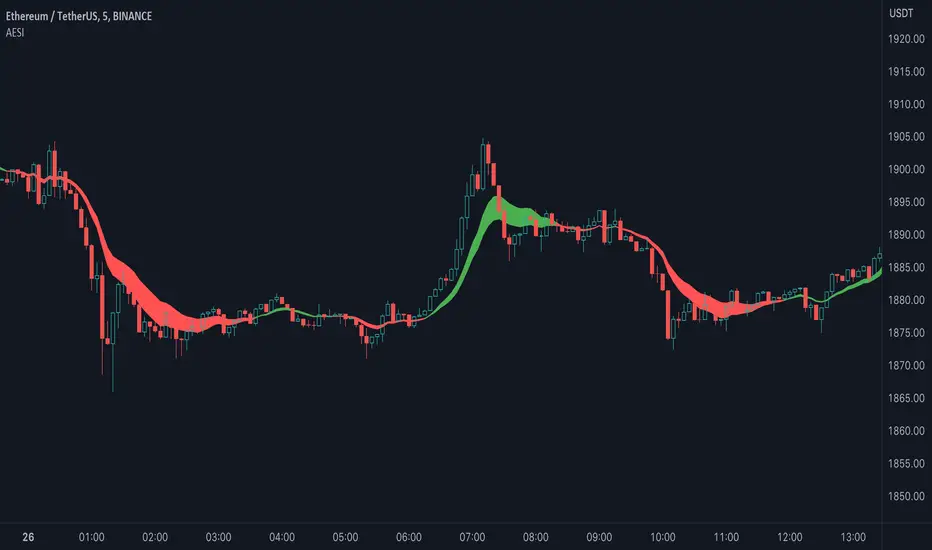
Advanced Exponential Smoothing Indicator (AESI) [AstrideUnicorn]The Advanced Exponential Smoothing Indicator (AESI) provides a smoothed representation of price data using the exponential smoothing technique. It helps traders identify the overall trend and potential reversal points in the market.
SETTINGS
Length: The number of periods used for the calculation of the exponential moving average (EMA). Higher values provide a smoother result but may lag behind price movements.
Alpha: The smoothing factor that determines the weight of the recent price data in the smoothing calculation. Higher values give more weight to recent data, resulting in a more responsive indicator.
Cloud Mode: Determines whether to display a cloud between the AESI line and the EMA line. When enabled, the cloud represents bullish (green) and bearish (red) market conditions.
HOW TO USE
The AESI indicator consists of a single line that represents the advanced exponential smoothing of the price data. It aims to provide a smoother version of the price series, reducing noise and revealing the underlying trend.
Bullish Condition: When the AESI line is above the EMA line, it indicates a bullish market condition. Traders may consider looking for buying opportunities or holding onto existing long positions.
Bearish Condition: When the AESI line is below the EMA line, it suggests a bearish market condition. Traders may consider looking for selling opportunities or holding onto existing short positions.
Optional Cloud Mode:
Enabling the cloud mode allows you to visualize bullish and bearish market conditions more clearly. The cloud appears between the AESI line and the EMA line, providing a visual representation of the prevailing market sentiment.
Bullish Cloud: When the AESI line is above the EMA line, the cloud is green, indicating a potential bullish market condition.
Bearish Cloud: When the AESI line is below the EMA line, the cloud is red, indicating a potential bearish market condition.
Note: The AESI indicator is most effective when used in conjunction with other technical analysis tools and indicators to confirm trading signals and make informed trading decisions.
Adjusting the Parameters:
You can adjust the Length and Alpha parameters to find the best ones for different timeframes and market conditions. Experimenting with different parameter values can help you find the optimal settings for your trading strategy.
It is recommended to backtest the AESI indicator on historical price data and evaluate its performance before using it in live trading. Remember that no indicator can guarantee profitable trades, and it is important to use risk management techniques and exercise caution when making trading decisions.
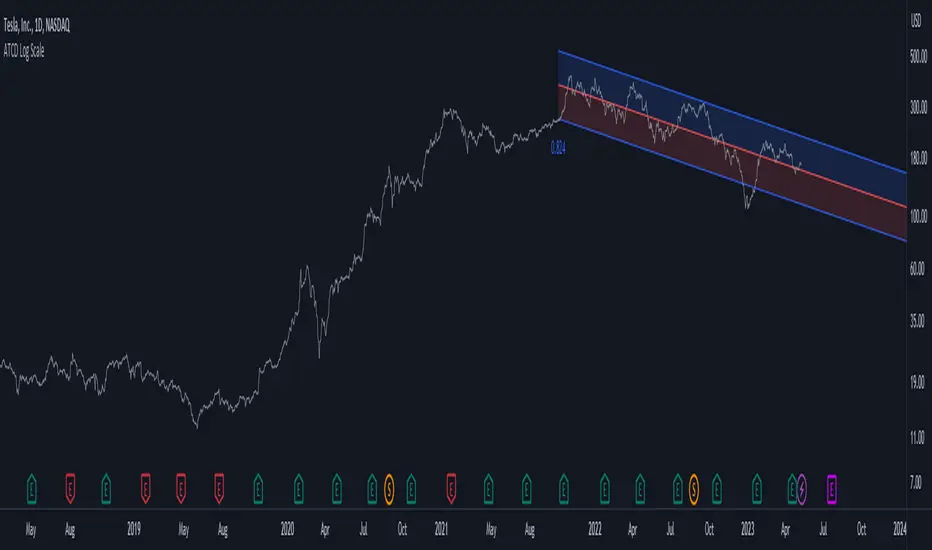
Smart Trend EnvelopeThe "Smart Trend Envelope" indicator is a powerful tool that combines the "Nadaraya-Watson Envelope " indicator by LuxAlgo and the "Strongest Trendline" indicator by Julien_Eche.
This indicator provides valuable insights into price trends and projection confidence levels in financial markets. However, it's important to note that the indicator may repaint, meaning that the displayed results can change after the fact.
The "Strongest Trendline" indicator by Julien_Eche focuses on identifying the strongest trendlines using logarithmic transformations of price data. It calculates the slope, average, and intercept of each trendline over user-defined lengths. The indicator also provides standard deviation, Pearson's R correlation coefficient, and upper/lower deviation values to assess the strength and reliability of the trendlines.
In addition, the "Nadaraya-Watson Envelope " indicator developed by LuxAlgo utilizes the Nadaraya-Watson kernel regression technique. It applies a kernel function to smooth the price data and estimate future price movements. The indicator allows adjustment of the bandwidth parameter and multiplier to control the width of the envelope lines around the smoothed line.
Combining these two indicators, the "Smart Trend Envelope" indicator offers traders and investors a comprehensive analysis of price trends and projection confidence levels. It automatically selects the strongest trendline length based on the highest Pearson's R correlation coefficient. Traders can observe the trendlines on the price chart, along with upper and lower envelope lines generated by the Nadaraya-Watson smoothing technique.
The "Smart Trend Envelope" indicator has several qualities that make it a valuable tool for technical analysis:
1. Automatic Length Selection: The indicator dynamically selects the optimal trendline length based on the highest Pearson's R correlation coefficient, ensuring accurate trend analysis.
2. Projection Confidence Level: The indicator provides a projection confidence level ranging from "Ultra Weak" to "Ultra Strong." This allows traders to assess the reliability of the projected trend and make informed trading decisions.
3. Color-Coded Visualization: The indicator uses color schemes, such as teal and red, to highlight the direction of the trend and the corresponding envelope lines. This visual representation makes it easier to interpret the market trends at a glance.
4. Customizable Settings: Traders can adjust parameters such as bandwidth, multiplier, line color, and line width to tailor the indicator to their specific trading strategies and preferences.
The "Smart Trend Envelope" indicator has been specifically designed and coded to be used in logarithmic scale. It takes advantage of the logarithmic scale's ability to represent exponential price movements accurately. Therefore, it is highly recommended to use this indicator with the chart set to logarithmic scale for optimal performance and reliable trend analysis, especially on higher timeframes.
It's important to remember that the "Smart Trend Envelope" indicator may repaint, meaning that the displayed results can change after the fact. Traders should use this indicator as a tool for generating trade ideas and confirmation, rather than relying solely on its historical values. Combining the indicator with other technical analysis tools and considering fundamental factors can lead to more robust trading strategies.

Dodge Trend [MyTradingCoder]Introducing the "Dodge Trend" indicator, an innovative variant of the Supertrend indicator designed to help traders better avoid fakeouts and maintain positions in established trends.
Like the Supertrend, the Dodge Trend uses Average True Range (ATR) but incorporates a unique adaptive adjustment feature that differentiates it from its counterparts. While the conventional Supertrend rises with the trend and only descends when the price crosses it, the Dodge Trend is designed to 'dodge' potential fakeouts.
This 'dodging' mechanism works by allowing the Dodge Trend to fall slightly during pullbacks, reducing the risk of a premature exit due to a temporary price drop. The recovery rate after the pullback is quicker but is slightly lower than the rate at which a new Dodge Trend high would be established in an uptrend. This unique adjustment feature allows the Dodge Trend to chase price action in an exponential fashion, potentially enabling a quicker exit when the trend shifts.
Key Settings:
Length: Adjust how much price action is taken into consideration for the ATR average. Lower values yield higher responsiveness to recent price action.
Size: Determines the initial deviation of the Dodge Trend when it resets after every flip/break.
Source: Specifies the data point (close, high, open, low, hl2, etc.) used for the Dodge Trend.
Dodge Intensity: Adjusts the intensity of the pullback effect. Higher values result in more intense pullbacks. Range is limited between 0 and 99, with 95 as the recommended default.
Bullish Color Setting: Sets the color for the uptrend Dodge Trend.
Bearish Color Setting: Sets the color for the downtrend Dodge Trend.
Dodge Trend is a powerful tool for traders looking to ride trends and avoid unnecessary exits due to short-term price fluctuations. While it offers a unique feature that may potentially improve trading outcomes, it should be used in conjunction with other indicators and analysis methods for a comprehensive trading strategy. As with all tools, it does not guarantee profitable trades but aims to give traders more actionable and precise information to base their decisions on.
Experience trend-following in a more adaptive and efficient manner with the Dodge Trend indicator, a tool designed to help you 'dodge' false exits and stay in line with the overall trend.

Prevailing Trend IndicatorOVERVIEW
The Prevailing Trend indicator is a technical indicator that gauges whether the price is currently trending up or down. The purpose of this indicator is to call and/or filter with-trend signals.
CONCEPTS
This indicator assists traders in identifying high-probability trend entries. The upper line (blue line on the indicator) is calculated by taking the average range (high-low) of all bullish candles. The lower line (red line on the indicator) is calculated by taking the average range of all bearish candles. When these two lines intersect and cross each other, a buy and sell signal is generated. For example, if the blue line crosses over the red line, this indicates that the average size of all bullish bars are larger than the average size of all bearish bars. This is a good sign that an uptrend might occur. Vice versa for downtrends.
HOW DO I READ THIS INDICATOR
As an entry indicator:
When the blue line crosses over the red line, go long.
When the red line crosses over the blue line, go short.
As a signal filter:
If the blue line is above the red line, only take long trades.
If the red line is above the blue line, only take short trades.

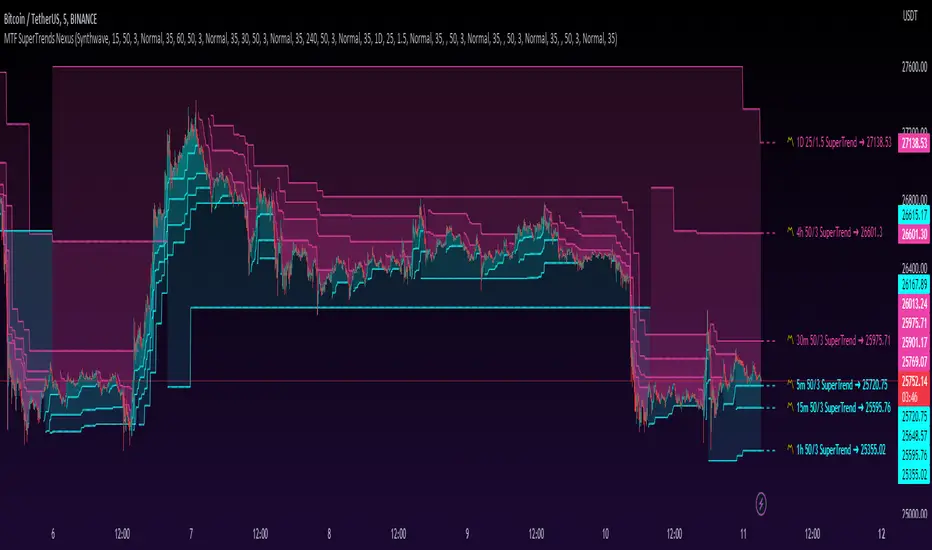
MTF SuperTrends Nexus [DarkWaveAlgo]🧾 Description:
A nexus is a connection, link, or neuronal junction where signals and information are transmitted between different elements.
The MTF SuperTrends Nexus indicator serves as a nexus between MTF SuperTrends by facilitating the visualization of up to eight multi-timeframe SuperTrends, each with its own customizable timeframe, period, factor, and coloring customization. By combining these various SuperTrends, it helps you create a comprehensive view of MTF trend dynamics and cross-timeframe confluence according to the SuperTrend indicator.
It acts as a utility/control center that brings together multiple MTF SuperTrends and allows you to visualize the interactions between them with exceptional ease-of-use and customizability, helping to provide you with valuable insights into potential trend reversals, momentum shifts, and trading opportunities.
💡 Originality and Usefulness:
While there are other multi-timeframe SuperTrend indicators available, MTF SuperTrends Nexus' semi-transparent fills create a compounding opaqueness when SuperTrends from multiple timeframes coalesce - making visual assessment of cross-timeframe confluence extremely easy. We also believe it stands above the rest with its sheer quantity and quality of settings, features, and usability.
✔️ Re-Published to Avoid Misleading Values
This script has been re-published to ensure that it does not use `request.security()` calls using lookahead_on to access future data when referencing SuperTrend calculations from other timeframes. This decreases the likelihood that the indicator will provide deceiving values. This change has been made in accordance with the PineScript documentation: "Using barmerge.lookahead_on at timeframes higher than the chart's without offsetting the `expression` argument like in `close [ ]` will introduce future leak in scripts, as the function will then return the `close` price before it is actually known in the current context" and the Publishing Rule: "Do not use `request.security()` calls using lookahead to access future data". Historical and real-time values may differ when referencing timeframes other than the chart's.
💠 Features:
8 toggleable MTF SuperTrends with customizable timeframes, periods, and factors
Compounding filled areas for easy MTF SuperTrend confluence analysis
Aesthetic and flexible coloring and color theme styling options
End-of chart labels and options for ease-of-use and legibility
⚙️ Settings:
Use a Color Theme: When this setting is enabled, all manual 'Bullish and Bearish Colors' are overridden. All plots will use the colors from your selected Color Theme - excepting those plots set to use the 'Single Color' coloring method.
Color Theme: When 'Use a Color Theme' is enabled, this setting allows you to select the color theme you wish to use.
Fill SuperTrend Areas: When enabled, the area between any MTF SuperTrend and the price bars will be filled with semi-transparent coloring.
Hide SuperTrends on Timeframes Lower Than the Chart: When this setting is enabled, any MTF SuperTrend with a timeframe smaller than that of the chart the indicator is applied to will be hidden from view.
Enable: Show/hide a specific MTF SuperTrend.
Timeframe: Set the timeframe for a specific MTF SuperTrend.
Period: Set the lookback period for a specific MTF SuperTrend.
Factor: Set the multiplier factor used for a specific MTF SuperTrend's calculation.
Bullish Color: When 'Use a Color Theme' is disabled, this will set the 'bullish color' for this specific MTF SuperTrend.
Bearish Color: When 'Use a Color Theme' is disabled, this will set the 'bearish color' for this specific MTF SuperTrend.
Enable Label: When enabled, a label will show at the end of the chart displaying the timeframe, period, factor, and current price value of this specific MTF SuperTrend.
Size: Sets the font size of this specific MTF SuperTrend's label.
Label Offset (in Bars): Sets the distance from the latest bar, in bars, at which this specific MTF SuperTrend's label is displayed.
Show Label Line: When enabled, this specific MTF SuperTrend's label will be accommodated by a dashed line connecting it to its plot.
📈 Chart:
The chart shown in this original publication displays the 5 minute chart on BTCUSDT. Displayed on the chart are 6 MTF SuperTrends: the 5m 50-period/3-factor SuperTrend, 15m 50-period/3-factor SuperTrend, 30m 50-period/3-factor SuperTrend, 1h 50-period/3-factor SuperTrend, 4h 50-period/3-factor SuperTrend, and the 1D 25-period/1.5-factor SuperTrend - offering an exemplary view of how you can easily use these MTF SuperTrends to your advantage in analyzing SuperTrend relationships across multiple timeframes.
Trendline Pivots [QuantVue]Trendline Pivots
The Trend Line Pivot Indicator works by automatically drawing and recognizing downward trendlines originating from and connecting pivot highs or upward trendlines originating from and connecting pivot lows.
These trendlines serve as reference points of potential resistance and support within the market.
Once identified, the trend line will continue to be drawn and progress with price until one of two conditions is met: either the price closes(default setting) above or below the trend line, or the line reaches a user-defined maximum length.
If the price closes(default setting) above a down trend line or below an up trend line, an "x" is displayed, indicating the resistance or support has been broken. At the same time, the trend line transforms into a dashed format, enabling clear differentiation from active non-breached trend lines.
This indicator is fully customizable from line colors, pivot length, the number lines you wish to see on your chart and works on any time frame and any market.
Don't hesitate to reach out with any questions or concerns.
We hope you enjoy!
Cheers.

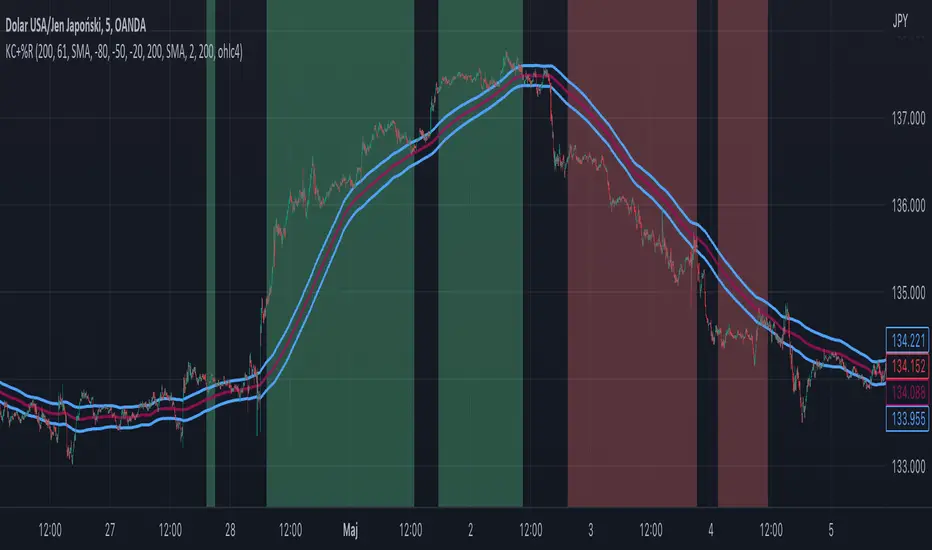
Williams %R + Keltner chanells - indicator (AS)1)INDICATOR ---This indicator is a combination of Keltner channels and Williams %R.
It measures trend using these two indicators.
When Williams %R is overbought(above upper line (default=-20)) and Keltner lower line is below price indicator shows uptrend (green).
When Williams %R is oversold(below lower line (default=-80)) and Keltner upper line is above price indicator shows downtrend (red) .
Can be turned into a strategy quickly.
2) CALCULATIONS:
Keltner basis is a choosen type of moving average and upper line is basis + (ATR*multiplier). Same with lower but minus instead of plus so basiss – (ATR*multiplier)
Second indicator
Williams %R reflects the level of the close relative to the highest high for the lookback period
3)PLS-HELP-----Looking for tips, ideas, sets of parameters, markets and timeframes, rules for strategy -------OVERALL -every advice you can have
4) SIGNALS-----buy signal is when price is above upper KC and Williams %R is above OVB(-20). Short is exactly the other way around
5) CUSTOMIZATION:
-%R-------LENGTH/SMOOTHING/TYPE SMOOTHING MA
-%R-------OVS/MID/OVB -(MID-no use for now)
-KC -------LENGTH/TYPE OF MAIN MA
-KC-------MULTIPLIER,ATR LENGTH
-OTHER--LENGTH/TYPE OF MA - (for signal filters, not used for now)
-OTHER--SOURCE -src of calculations
-OTHER--OVERLAY - plots %R values for debugging etc(ON by default)
6)WARNING - do not use this indicator on its own for trading
7)ENJOY
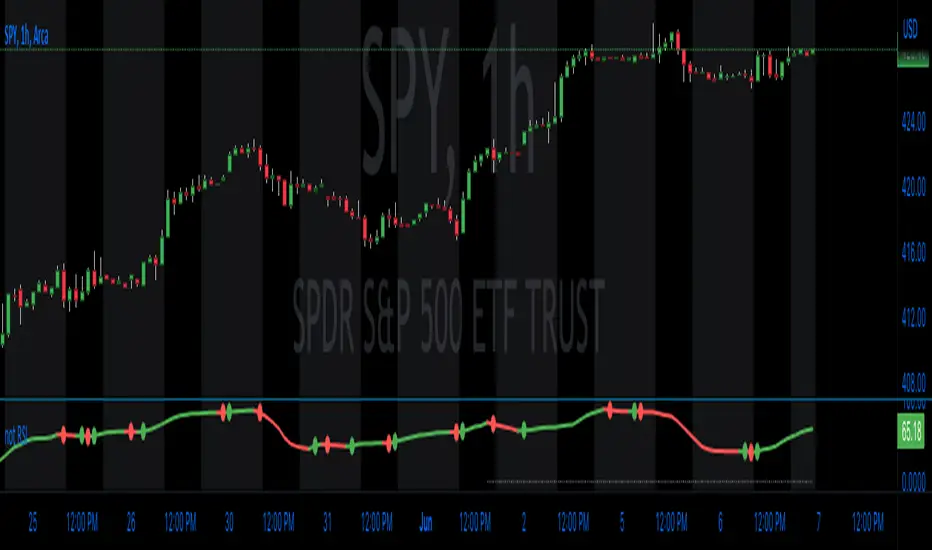
Relative Strength, not RSIThe Smoothed Relative Strength Indicator (not RSI) with Multi-Timeframe Support is a custom indicator that combines the concepts of Relative Strength (not RSI) and Money Flow Index (MFI) to create a smoothed trend-following tool. It works on any timeframe and adapts to different market conditions.
Key Features:
Multi-timeframe support: [ The script uses the request.security function to fetch data from other timeframes, allowing users to analyze the trend on different timeframes simultaneously.
Relative Strength calculation: The script calculates the Relative Strength (not RSI) by averaging the gains and losses over a user-defined period (len).
Money Flow Index calculation: The script calculates the Money Flow Index (MFI) by considering both price and volume data. The MFI is an oscillator that ranges between 0 and 100, and it helps identify overbought or oversold conditions in the market.
Combination of Relative Strength and MFI:The indicator calculates the average of Relative Strength and MFI values to create the Trend Reversal Strength (TRS) line.
Smoothing the TRS line: The TRS line is smoothed using a Simple Moving Average (SMA) with a user-defined smoothing length (smoothLen). This helps to reduce noise and make the trend more readable.
Trend color determination: The script determines the trend color based on the slope of the smoothed TRS line. If the current value of the smoothed TRS line is higher than the previous one, the line is colored green (uptrend). If the current value is lower than the previous one, the line is colored red (downtrend).
Visual representation of trend changes: The indicator plots small circles at points where the trend color changes, making it easier to identify potential trend reversal points.
Zero line: The script draws a horizontal line at the zero level to help users gauge the market's strength or weakness relative to this level.
Usage:
This indicator can be used as a trend-following tool to identify potential entry and exit points in the market. When the smoothed TRS line is green and rising, it suggests a bullish trend, and traders may consider entering long positions. Conversely, when the smoothed TRS line is red and falling, it indicates a bearish trend, and traders may consider short positions or exiting long trades.
Please note that this indicator should be used in conjunction with other technical analysis tools and proper risk management techniques to improve the accuracy of your trading decisions.
Dynamic Trendlines Multi-TimeframeThe Dynamic Trendlines indicator is a useful tool for traders to identify potential support and resistance levels in the market. By analyzing price volatility and drawing trendlines based on high volatility candles, it helps traders visualize key price levels that may influence future price action. This indicator uses the Average True Range (ATR) as a measure of price volatility to determine the threshold for high volatility candles. This indicator can be used on multiple time frames, so just choose which one works best for you!
The underlying concept of this indicator revolves around the calculation of the True Range and Average True Range. The True Range is the maximum value among the difference between the current high and low, the absolute value of the difference between the current high and previous close, and the absolute value of the difference between the current low and previous close. The ATR is then calculated as the simple moving average of the True Range over a user-defined period (default is 14). The threshold for high volatility candles is determined by multiplying the ATR by a user-defined multiplier (default is 1.5).
The indicator identifies high volatility candles when the closing price is greater than the previous closing price plus the threshold. Based on the price action, trendlines are drawn connecting the high or low of high volatility candles. The initial color and style of the trendline are determined by whether the price is moving up or down. Green solid lines represent upward price movement, while red solid lines represent downward price movement.
As the price crosses the trendlines, the indicator tracks the number of crosses and updates the line's style accordingly. If the price crosses a trendline twice, the line style is changed to dashed, indicating the potential weakening of the support or resistance level.
This indicator works best with trading methods that focus on capturing price breakouts or reversals. Traders can use the trendlines to identify potential entry or exit points, stop-loss levels, or take-profit targets. It's important to note that this indicator should be used in conjunction with other technical analysis tools and an understanding of the overall market context to make informed trading decisions.
When using the Dynamic Trendlines indicator on TradingView, users can customize the ATR length, threshold multiplier, and the number of recent trendlines displayed on the chart. Additionally, small triangles are plotted below high volatility candles, with their color based on the trendline it starts, providing a quick visual reference for traders.
In summary, the Dynamic Trendlines indicator is a valuable tool for identifying potential support and resistance levels in the market by analyzing price volatility and drawing trendlines based on high volatility candles. It is best suited for breakout and reversal trading strategies and should be used in conjunction with other technical analysis tools for optimal results.

Moving Average Trend Sniper [ChartPrime]Today we introducing the Moving Average Trend Sniper (MATS), a unique and powerful multi faceted tool. This moving average is designed to adapt to the ever-changing market conditions. MATS provides the ideal solution for traders looking to capitalize on market trends while accurately identifying support and resistance levels.
Why MATS?
MATS was developed with the trader in mind, focusing on the key factors crucial for a successful trading strategy - trend following, support, and resistance. Its unique moving average calculation not only accounts for market volatility and momentum but also provides a stable yet adaptable foundation for your trading decisions.
MATS employs a range of mathematical techniques to provide a precise and adaptive moving average, offering traders a more effective tool for analyzing market trends and identifying support and resistance levels. One of the primary distinctions of MATS is its use of delta, the change in market conditions, to update the moving average based on the trend's strength. This delta-based updating allows the moving average to adapt to market fluctuations and helps traders make more informed decisions when entering or exiting positions. MATS also focuses on the highs in a downtrend and the lows in an uptrend to provide more reliable support and resistance. By taking these crucial market points into consideration, the moving average delivers a comprehensive and accurate insight into the market's behavior and allows traders to make more precise predictions.
MATS leverages trigonometry to determine the trend angle for the moving average. By calculating this angle, MATS can efficiently pick the correct source (either the high or the low) to provide the best support and resistance analysis. This innovative use of trigonometry ensures that the moving average is better suited to the current market conditions and provides traders with a dynamic yet stable tool to support their trading decisions.
Settings:
Length: The length input for MATS plays a crucial role in determining how responsive the moving average will be to changes in market conditions. A shorter length setting results in a more reactive moving average that closely follows price movements, whereas a longer length setting generates a smoother, less volatile average. By adjusting the length setting, traders can fine-tune the sensitivity of MATS to align with their specific trading strategies and needs.
Glow: MATS offers a customizable and visually engaging display that helps traders effectively identify market trends. The "glow" effect surrounding support and resistance levels, available as an optional feature, enables users to assess these crucial areas more easily.
Example use cases:
In the screenshot below you can see the MATS acting as both a classical support and resistance while the glow and coloring is helped to provide a more classical trend following visualization to a trader. This duel functionality can help in re-entering during market retracements.

Risk-Adjusted Return OscillatorThe Risk-Adjusted Return Oscillator (RAR) is designed to aid traders in predicting future price action by analysing the risk-adjusted performance of an asset. This oscillator is displayed directly on the price chart, unlike other oscillators.
By considering the risk-return relationship, the indicator helps identify periods of overvaluation or undervaluation, allowing traders to anticipate potential price reversals or trend accelerations.
HOW TO USE
The Risk-Adjusted Return Oscillator analyses the risk-adjusted performance of an asset to detect price reversals and accelerations. Here's how to interpret its signals:
Ranging Market:
Overbought Signal: When the RAR curve reaches the overbought level (upper red line), it suggests a potential reversal signal. It indicates that the asset may be overvalued, and a price correction or trend reversal could occur.
Oversold Signal: When the RAR curve reaches the oversold level (lower red line), it indicates a potential reversal signal. It suggests that the asset may be undervalued, and a price correction or trend reversal could take place.
Trending Market:
Overbought Signal: In a trending market, an overbought signal (RAR curve reaching upper red line) suggests trend acceleration. It indicates that the existing trend is gaining strength, and buying pressure is increasing.
Oversold Signal: In a trending market, an oversold signal (RAR curve reaching lower red line) also signifies trend acceleration. It suggests that the prevailing trend is intensifying, and selling pressure is increasing.
Thus, it's important to consider the market context when interpreting overbought and oversold signals. In ranging markets, these signals act as potential reversal points. However, in trending markets, they indicate trend acceleration, reinforcing the current price direction.
SETTINGS
Period Length: Adjust the number of bars used to calculate returns and standard deviation.
Smoothing: Define the smoothing period for the RAR curve.
Show Overbought/Oversold Signals: Choose whether to display triangular shapes for overbought and oversold conditions.

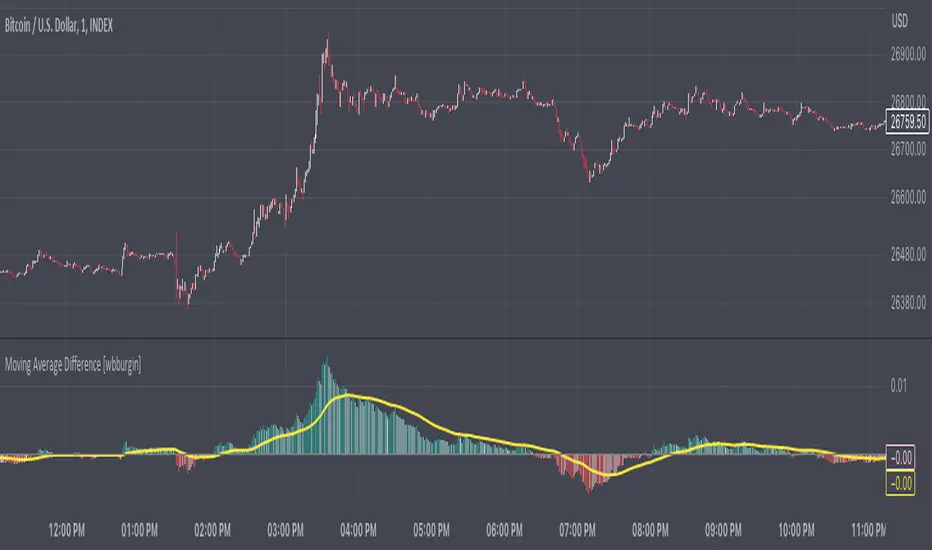
Recursive Moving Average DifferenceThe relative difference between a moving average and the price can be a useful tool for interpreting trend direction and identifying pullbacks or breakdowns. This indicator recursively finds all the relative moving average differences between two simple moving averages of your choosing and weighs them by their lengths. It then returns a value that represents the weighted average of all the moving average differences. This can represent the gradient of motion between moving averages, or the path of least resistance, which the price may revert to in certain situations.
For the settings: minimum MA represents the minimum simple moving average to consider for the total weighted average. Maximum MA represents the maximum simple moving average to consider. "Move By" is the increment that you want to move between these two moving averages.
A positive moving average difference indicates that the price is above the moving average difference (i.e. the weighted average of all moving average differences between your two selected moving averages). A negative moving average difference indicates that the price is below the moving average difference. I have added a signal with a configurable length input as well to smooth out trends.
You can configure colors and lengths, as well as the counting increment. Future updates may include different ways to calculate weights, perhaps on overlay or strategy.
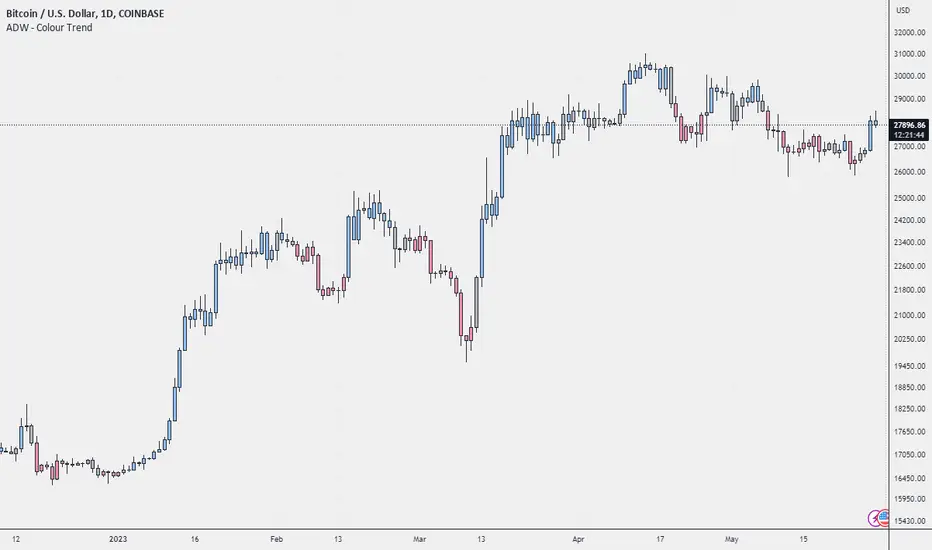
ADW - Colour TrendColour Trend is an indicator that will give you a visual representation of the trend in a selected market, and alert you when the trend changes. The green colour represents a bullish trend (prices are going up), the red colour represents a bearish trend (prices are going down), and silver represents a neutral trend (prices are relatively stable). The script calculates these trends based on the relative price levels and their moving averages.
Below is a breakdown of the script so you can better understand how these trends are defined.
Function f_p(_length, price) : This function calculates the price relative to its highest and lowest point over the given `_length` of time. This calculation is normalized by multiplying it by 100, giving us a percentage-like measure.
User Inputs : The length of the period (default 12), you can choose to show or hide bar colours (default is true).
Variables cycle_avg, cycle_counter, cycle_count, cycle_trend, cycle_col : These variables are used to calculate the trend cycles. The `cycle_avg` is the average trend cycle, `cycle_counter` keeps track of the current trend cycle, `cycle_count` counts the total number of cycles, `cycle_trend` keeps track of the direction of the cycle (1 for up, -1 for down), and `cycle_col` defines the colour of the current cycle.
Variables ph, pl, avg, mean : These variables calculate the price level relative to the highest and lowest prices (`ph` and `pl`), the average of these two levels (`avg`), and the cumulative average of the price level (`mean`).
Conditionals for cycle trend : The if-statements are checking whether the price level has reached a trend extreme and then updating the trend cycle, colour, count, and average accordingly.
Variable col and bar color : The variable `col` is used to define the colour of the bars based on the average price level. If the `show_barcolor` is true, the colour is determined based on the `avg` value.
Alert Conditions : These are conditions that will send alerts to the user when the trend changes. Specifically, the alerts occur when the colour changes from non-green to green (bull trend), from non-red to red (bear trend), or from non-silver to silver (no trend).
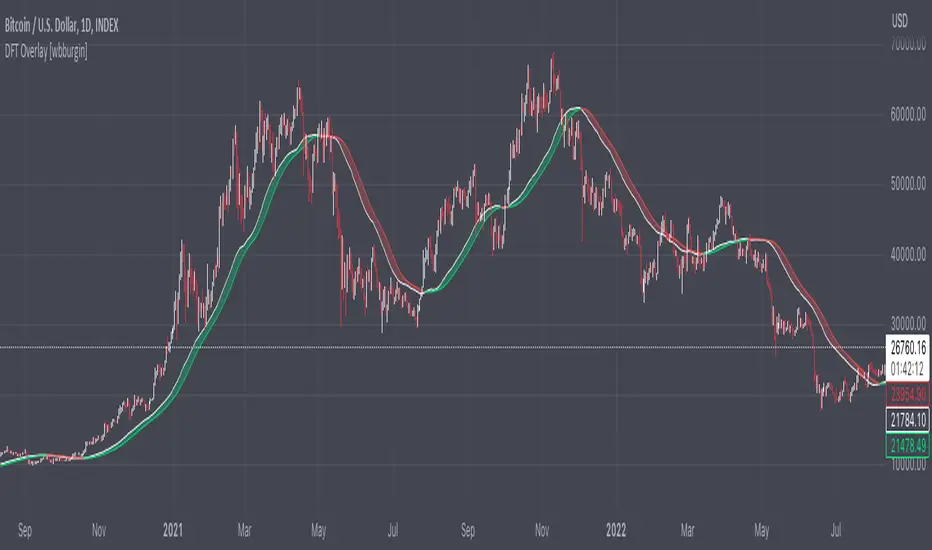
Discrete Fourier Transform Overlay [wbburgin]The discrete Fourier transform (DFT) overlay uses a discrete Fourier transform algorithm to identify trend direction. This is a simpler interpretation that only uses the magnitude of the first frequency component obtained from the DFT algorithm, but can be useful for visualization purposes. I haven't seen many Fourier scripts on TradingView that actually have the magnitude plotted on the chart (some have lines, for instance, but that makes it difficult to look into the past or to see previous lines).
About the Discrete Fourier Transform
The DFT is a mathematical transformation that decomposes a time-domain signal into its constituent frequency components. By applying the DFT to OHLC data, we can interpret the periodicities and trends present in the market. I've designed the overlay so that you can choose your source for the Fourier transform, as well as the length.
Settings and Configuration
The "Fourier Period" is the transform length of the DFT algorithm. This input indicates the number of data points considered for the DFT calculation. For example, if this input is set to 20, the DFT will be performed on the most recent 20 data points of the input series. The transform length affects the resolution and accuracy of the frequency analysis. A shorter transform length may provide a broader frequency range but with less detail, while a longer transform length can provide finer frequency resolution but may be computationally more intensive (I recommend using under 100 - anything above that might take too much time to load on the platform).
The "Fourier X Series" is the source you want the Fourier transform to be applied to. I have it set in default to the close.
"Kernel Smoothing" is the bar-start of the rational quadratic kernel used to smooth the frequency component. Think of it just like a normal moving average if you are unfamiliar with the concept, it functions similarly to the "length" value of a moving average.
AlphaTrend - ScreenerScreener version of AlphaTrend indicator:
BUY / LONG when AlphaTrend line crosses above its 2 bars offsetted line, and there would be a green filling between them
SELL / SHORT when AlphaTrend line crosses below its 2 bars offsetted line, and filling would be red then.
Default values:
Coefficient: 1, which is the factor of the trailing ATR value
Common Period: 14, which is the length of ATR MFI and RSI
AlphaTrend default uses MFI in the calculation, and MFI (Money Flow Index) needs the volume data of the chart.
If your chart doesn't have the volume data, please select the "Change Calculation" option to use RSI instead of MFI.
Screener Panel:
You can explore 20 different and user-defined tickers, which can be changed from the SETTINGS (shares, crypto, commodities...) on this screener version.
The screener panel shows up right after the bars on the right side of the chart.
Tickers seen in green are the ones that are in an uptrend, according to AlphaTrend.
The ones that appear in red are those in the SELL signal, in a downtrend.
The numbers in front of each Ticker indicate how many bars passed after the last BUY or SELL signal of AlphaTrend.
For example, according to the indicator, when BTCUSDT appears in (3) and in GREEN, Bitcoin switched to BUY signal 3 bars ago.

Adaptive Gaussian Moving AverageThe Adaptive Gaussian Moving Average (AGMA) is a versatile technical indicator that combines the concept of a Gaussian Moving Average (GMA) with adaptive parameters based on market volatility. The indicator aims to provide a smoothed trend line that dynamically adjusts to different market conditions, offering a more responsive analysis of price movements.
Calculation:
The AGMA is calculated by applying a weighted moving average based on a Gaussian distribution. The length parameter determines the number of bars considered for the calculation. The adaptive parameter enables or disables the adaptive feature. When adaptive is true, the sigma value, which represents the standard deviation, is dynamically calculated using the standard deviation of the closing prices over the volatilityPeriod. When adaptive is false, a user-defined fixed value for sigma can be input.
Interpretation:
The AGMA generates a smoothed line that follows the trend of the price action. When the AGMA line is rising, it suggests an uptrend, while a declining line indicates a downtrend. The adaptive feature allows the indicator to adjust its sensitivity based on market volatility, making it more responsive during periods of high volatility and less sensitive during low volatility conditions.
Potential Uses in Strategies:
-- Trend Identification : Traders can use the AGMA to identify the direction of the prevailing trend. Buying opportunities may arise when the price is above the AGMA line during an uptrend, while selling opportunities may be considered when the price is below the AGMA line during a downtrend.
-- Trend Confirmation : The AGMA can be used in conjunction with other technical indicators or trend-following strategies to confirm the strength and sustainability of a trend. A strong and steady AGMA line can provide additional confidence in the prevailing trend.
-- Volatility-Based Strategies : Traders can utilize the adaptive feature of the AGMA to build volatility-based strategies. By adjusting the sigma value based on market volatility, the indicator can dynamically adapt to changing market conditions, potentially improving the accuracy of entry and exit signals.
Limitations:
-- Lagging Indicator : Like other moving averages, the AGMA is a lagging indicator that relies on historical price data. It may not provide timely signals during rapidly changing market conditions or sharp price reversals.
-- Whipsaw in Sideways Markets : During periods of low volatility or when the market is moving sideways, the AGMA may generate false signals or exhibit frequent crossovers around the price, leading to whipsaw trades.
-- Subjectivity of Parameters : The choice of length, adaptive parameters, and volatility period requires careful consideration and customization based on individual preferences and trading strategies. Traders need to adjust these parameters to suit the specific market and timeframe they are trading.
Overall, the Adaptive Gaussian Moving Average can be a valuable tool in trend identification and confirmation, especially when combined with other technical analysis techniques. However, traders should exercise caution, conduct thorough analysis, and consider the indicator's limitations when incorporating it into their trading strategies.

Strongest TrendlineUnleashing the Power of Trendlines with the "Strongest Trendline" Indicator.
Trendlines are an invaluable tool in technical analysis, providing traders with insights into price movements and market trends. The "Strongest Trendline" indicator offers a powerful approach to identifying robust trendlines based on various parameters and technical analysis metrics.
When using the "Strongest Trendline" indicator, it is recommended to utilize a logarithmic scale . This scale accurately represents percentage changes in price, allowing for a more comprehensive visualization of trends. Logarithmic scales highlight the proportional relationship between prices, ensuring that both large and small price movements are given due consideration.
One of the notable advantages of logarithmic scales is their ability to balance price movements on a chart. This prevents larger price changes from dominating the visual representation, providing a more balanced perspective on the overall trend. Logarithmic scales are particularly useful when analyzing assets with significant price fluctuations.
In some cases, traders may need to scroll back on the chart to view the trendlines generated by the "Strongest Trendline" indicator. By scrolling back, traders ensure they have a sufficient historical context to accurately assess the strength and reliability of the trendline. This comprehensive analysis allows for the identification of trendline patterns and correlations between historical price movements and current market conditions.
The "Strongest Trendline" indicator calculates trendlines based on historical data, requiring an adequate number of data points to identify the strongest trend. By scrolling back and considering historical patterns, traders can make more informed trading decisions and identify potential entry or exit points.
When using the "Strongest Trendline" indicator, a higher Pearson's R value signifies a stronger trendline. The closer the Pearson's R value is to 1, the more reliable and robust the trendline is considered to be.
In conclusion, the "Strongest Trendline" indicator offers traders a robust method for identifying trendlines with significant predictive power. By utilizing a logarithmic scale and considering historical data, traders can unleash the full potential of this indicator and gain valuable insights into price trends. Trendlines, when used in conjunction with other technical analysis tools, can help traders make more informed decisions in the dynamic world of financial markets.

Crypto Trend IndicatorThe Crypto Trend Indicator is a trend-following indicator specifically designed to identify bullish and bearish trends in the price of Bitcoin, and other cryptocurrencies. This indicator doesn't provide explicit instructions on when to buy or sell, but rather offers an understanding of whether the trend is bullish or bearish. It's important to note that this indicator is only useful for trend trading.
The band is a visual representation of the 30-day and 60-day Exponential Moving Average (EMA). When the 30-day EMA is above the 60-day EMA, the trend is bullish and the band is green. When the 30-day EMA is below the 60-day EMA, the trend is bearish and the band is red. When the 30-day EMA starts to converge with the 60-day EMA, the trend is neutral and the band is grey.
The line is a visual representation of the 20-week Simple Moving Average (SMA) in the daily timeframe. "Bull" and "Bear" signals are generated when the 20-day EMA is either above or below the 20-week SMA, in conjunction with a bullish or bearish trend. When the band is green and the 20-day EMA is above the 20-week SMA, a “Bull” signal emerges. When the band is red and the 20-day EMA is below the 20-week SMA, a “Bear” signal emerges. The 20-week SMA can potentially also function as a leading indicator, as substantial price deviations from the SMA typically indicate an overextended market.
While this indicator has traditionally identified bullish and bearish trends in various cryptocurrency assets, past performance does not guarantee future results. Therefore, it is advisable to supplement this indicator with other technical tools. For instance, range-bound indicators can greatly improve the decision-making process when planning for entries and exits points.

True Trend Oscillator [wbburgin]The True Trend oscillator identifies trending or ranging markets with a stochastic ATR and RSI. Here are some examples for how it can be used.
Uptrends
If the candlesticks are lime green, this signals an uptrend. On the oscillator, you can identify an uptrend if the bull strength (the green line) is above the bear strength (the red line). The strength of the uptrend and the downtrend can be found by looking at the slope of these lines.
Downtrends
If the candlesticks are red, this signals a downtrend. On the oscillator, notice how the bear strength line is above the bull strength line.
Ranging Markets and Pullbacks
The True Trend oscillator can also be used to identify ranging markets or pullbacks. Let's look at the previous example again:
If you notice that the bull and bear lines are bouncing above the red weak-trend zone (as in the example above), this signals an extended trend. On the contrary, when the bull and bear lines fall into the weak-trend zone, this may indicate a larger pullback or a range to look to enter a trade again, as in this example, where the ranging candles in gray demonstrate temporary pullbacks in a larger bullish trend:
Ranges can also occur before trend reversals, so a range may also indicate a smart time to secure profits.
You can customize the ranging threshold in the settings. It can be set from 0-100 because the indicator is a stochastic.
Hope you all find this indicator useful!

Advanced Trend Channel Detection (Log Scale)The Advanced Trend Channel Detection (Log Scale) indicator is designed to identify the strongest trend channels using logarithmic scaling. It does this by calculating the highest Pearson's R value among all length inputs and then determining which length input to use for the selected slope, average, and intercept. The script then draws the upper and lower deviation lines on the chart based on the selected slope, average, and intercept, and optionally displays the Pearson's R value.
To use this indicator, you will need to switch to logarithmic scale. There are several advantages to using logarithmic scale over regular scale. Firstly, logarithmic scale provides a better visualization of data that spans multiple orders of magnitude by compressing large ranges of values into a smaller space. Secondly, logarithmic scale can help to minimize the impact of outliers, making it easier to identify patterns and trends in the data. Finally, logarithmic scale is often utilized in scientific contexts as it can reveal relationships between variables that may not be visible on a linear scale.
If the trend channel does not appear on the chart, it may be necessary to scroll back to view historical data. The indicator uses past price data to calculate the trend channel, so if there is not enough historical data visible on the chart, the indicator may not be able to identify the trend channel. In this case, the user should adjust the chart's timeframe or zoom out to view more historical data. Additionally, the indicator may need to be recalibrated if there is a significant shift in market conditions or if the selected length input is no longer appropriate.
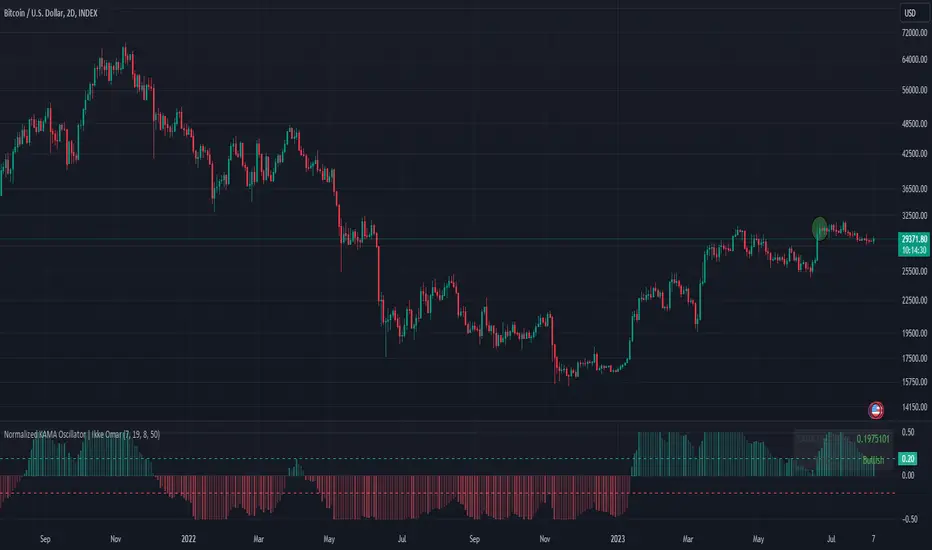
Normalized KAMA Oscillator | Ikke OmarThis indicator demonstrates the creation of a normalized KAMA (Kaufman Adaptive Moving Average) oscillator with a table display. I will explain how the code works, providing a step-by-step breakdown. This is personally made by me:)
Input Parameters:
fast_period and slow_period: Define the periods for calculating the KAMA.
er_period: Specifies the period for calculating the Efficiency Ratio.
norm_period: Determines the lookback period for normalizing the oscillator.
Efficiency Ratio (ER) Calculation:
Measures the efficiency of price changes over a specified period.
Calculated as the ratio of the absolute price change to the total price volatility.
Smoothing Constant Calculation:
Determines the smoothing constant (sc) based on the Efficiency Ratio (ER) and the fast and slow periods.
The formula accounts for the different periods to calculate an appropriate smoothing factor.
KAMA Calculation:
Uses the Exponential Moving Average (EMA) and the smoothing constant to compute the KAMA.
Combines the fast EMA and the adjusted price change to adapt to market conditions.
Oscillator Normalization:
Normalizes the oscillator values to a range between -0.5 and 0.5 for better visualization and comparison.
Determines the highest and lowest values of the KAMA within the specified normalization period.
Transforms the KAMA values into a normalized range.
By incorporating the Efficiency Ratio, smoothing constant, and normalization techniques, the indicator actually allows for the identification of trends on different timeframes, even in extreme market conditions.
The normalization makes it much more adaptive than if you were to just use a normal KAMA line. This way you actually get a lot more data by looking at the histogram, rather than just the KAMA line.
I essentially made the KAMA into an oscillator! Please ask if you want me to code another indicator
I hope you enjoyed this.
Please ask if you have any questions<3