VX-Time Quadrant Overlay (Quarterly Cycles) by Ikaru-s-The Time Quadrant Overlay is a purely time-based visualization tool designed to structure market time into repeating quarterly cycles across multiple timeframes.
It does not generate trade signals, entries, or bias.
Its sole purpose is to provide time context, so price action can be interpreted within a clear cyclical framework.
What this indicator does
The indicator divides time into four repeating quarters (Q1–Q4) and displays them simultaneously across different time horizons, such as:
Weekly
Daily (6-hour quarters)
90-minute cycles
Micro cycles (within 90-minute structure)
Each row represents a different time cycle, allowing traders to see time alignment, transitions, and overlaps at a glance.
Quarter Structure
Each cycle follows the same repeating sequence:
Q1 – Early phase
Q2 – Expansion / “True Open” phase
Q3 – Continuation
Q4 – Late phase / Transition
The quarters are visualized using color-coded boxes, making it easy to see:
where the market currently is in time
when a new quarter begins
when multiple cycles align or diverge
Quarter Start Marker
An optional Quarter Start Marker (vertical dashed line) can be enabled to highlight the start of a selected quarter (default: Q2).
This is intended as a time reference, not a signal:
useful for planning
useful for contextualizing reactions to levels
useful for session and cycle awareness
How to use it (practical)
This tool is best used to:
provide time structure to existing analysis
plan around upcoming time transitions
contextualize reactions to levels or areas
understand where price is acting within a cycle
It works well alongside:
discretionary price action
session-based trading
futures and index markets
any methodology that respects time as a variable
Customization
The indicator is fully customizable:
Enable / disable individual cycles
Adjust box transparency and history depth
Toggle labels and pane labels
Enable / disable quarter start markers
Select which quarter to highlight
This allows the tool to remain clean on higher timeframes and detailed on lower ones.
Important Notes
This is a visual framework, not a strategy.
No claims of predictive power are made.
Time structure does not replace risk management or execution logic.
The indicator is designed to adapt across markets, but interpretation remains discretionary.
Final Thoughts
Time is often treated as secondary to price.
This tool exists to make time visible, structured, and easy to work with — nothing more, nothing less.
Trends

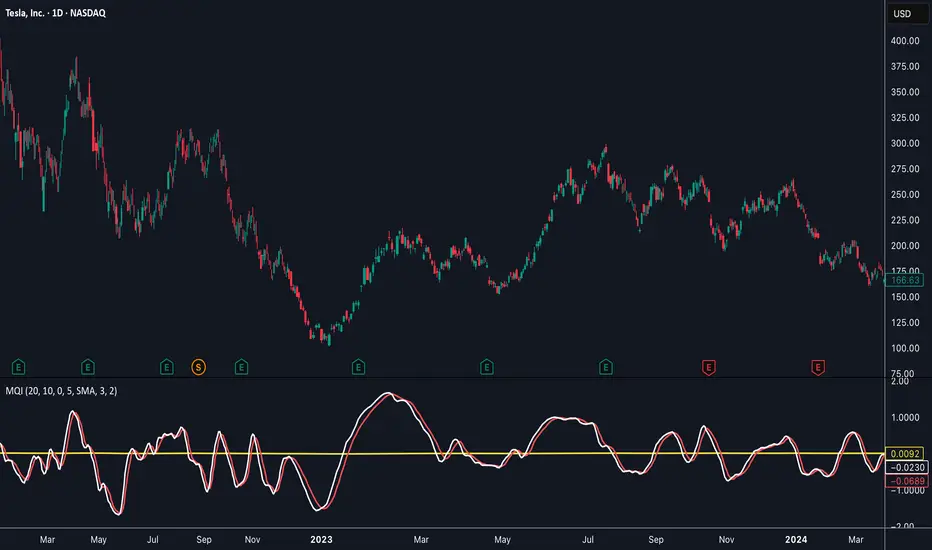
Momentum Quality Index (MQI)
Welcome to the Momentum Quality Index! This indicator aims to provide insight into short term trends by measuring the efficiency of price movement relative to the momentum of the trend. This indicator is designed to work better on short term time frames, capturing the micro-level of trends for practices such as day-trading, options trading, and shorter term swing trading.
How to read:
The main way of reading this indicator is through moving average crossovers. Upwards crossovers indicates uptrends whereas downwards crossovers indicates downtrends.
Customization:
This indicator includes a few adjustable options for fine tuning, such as optimized smoothing options and moving average length for efficiency in spotting reversals.
Pristine Adaptive Alpha ScreenerThe Pristine Adaptive Alpha Screener allows users to screen for all of the trading signals embedded in our premium suite of TradingView tools🏆
▪ Pristine Value Areas & MGI - enables users to perform comprehensive technical analysis through the lens of the market profile in a fraction of the time!
▪ Pristine Fundamental Analysis - enables users to perform comprehensive fundamental stock analysis in a fraction of the time!
▪ Pristine Volume Analysis - organizes volume, liquidity, and share structure data, allowing users to quickly gauge the relative volume a security is trading on, and whether it is liquid enough to trade
💠 How is this Screener Original?
▪ The screener allows users to screen for breakouts, breakdowns, bullish and bearish trend reversals, and allows users to narrow a universe of stocks based purely on fundamentals, or purely on technicals. One screening tool to support an entire technofundamental workflow!
💠 Signals Overview
Each of the below signals serves one of two purposes:
1) A pivot point to be used as a long or short entry
2) A tool for narrowing a universe of stocks to a shorter list of stocks that have a higher potential for superperformance
▪ HVY(highest volume in a year) -> Featured in Pristine Volume Analysis -> Entry signal
▪ Trend Template -> Inspired by Mark Minervini's famous trend filters -> Tool for narrowing a universe of stocks to a shorter list with a higher potential for superperformance
▪ Rule of 100 -> Metrics from Pristine Fundamental Analysis -> Tool for narrowing a universe of stocks to a shorter list with a higher potential for superperformance
▪ Bullish 80% Rule -> Featured in Pristine Value Areas & MGI -> Long entry signal -> Trend Reversal
▪ Bearish 80% Rule -> Featured in Pristine Value Areas & MGI -> Short entry signal -> Trend Reversal
▪ Break Above VAH -> Featured in Pristine Value Areas & MGI -> Long entry signal -> Trend Continuation
▪ Break Below VAL -> Featured in Pristine Value Areas & MGI -> Short entry signal -> Trend Continuation
💠 Signals Decoded
▪ HVY(highest volume in a year)
Volume is an important metric to track when trading, because abnormally high volume tends to occur when a new trend is kicking off, or when an established trend is hitting a climax. Screen for HVY to quickly curate every stock that meets this condition.
▪ Trend Template
Mark Minervini's gift to the trading world. Via his book "Think and Trade Like a Stock Market Wizard". Stocks tend to make their biggest moves when they are already in uptrends, and the Minervini Trend template provides criteria to assess whether a stock is in a clearly defined uptrend. Filter for trend template stocks using our tool.
▪ Rule of 100
Pristine Capital's gift to the trading world. The rule of 100 filters for stocks that meet the following condition: YoY EPS Growth + YoY Sales Growth >= 100%. Stocks that meet this criteria tend to attract institutional investors, making them strong candidates for swing trading to the long side.
💠 Market Profile Introduction
A Market Profile is a charting technique devised by J. Peter Steidlmayer, a trader at the Chicago Board of Trade (CBOT), in the 1980's. He created it to gain a deeper understanding of market behavior and to analyze the auction process in financial markets. A market profile is used to analyze an auction using price, volume, and time to create a distribution-based view of trading activity. It organizes market data into a bell-curve-like structure, which reveals areas of value, balance, and imbalance.
💠 How is a Value Area Calculated?
A value area is a distribution of 68%-70% of the trading volume over a specific time interval, which represents one standard deviation above and below the point of control, which is the most highly traded level over that period.
The key reference points are as follows:
Value area low (VAL) - The lower boundary of a value area
Value area high (VAH) - The upper boundary of a value area
Point of Control (POC) - The price level at which the highest amount of a trading period's volume occurred
If we take the probability distribution of trading activity and flip it 90 degrees, the result is our Pristine Value Area!
Market Profile is our preferred method of technical analysis at Pristine Capital because it provides an objective and repeatable assessment of whether an asset is being accumulated or distributed by institutional investors. Market Profile levels work remarkably well for identifying areas of interest, because so many institutional trading algorithms have been programmed to use these levels since the 1980's!
The benefits of using Market Profile include better trade location, improved risk management, and enhanced market context. It helps traders differentiate between trending and consolidating markets, identify high-probability trade setups, and adjust their strategies based on whether the market is in balance (consolidation) or imbalance (trending). Unlike traditional indicators that rely on past price movements, Market Profile provides real-time insights into trader behavior, giving an edge to those who can interpret its nuances effectively.
▪ Bullish 80% Rule
If a security opens a period below the value area low , and subsequently closes above it, the bullish 80% rule triggers, turning the value area green. One can trade for a move to the top of the value area, using a close below the value area low as a potential stop!
In the below example, HOOD triggered the bullish 80% rule after it reclaimed the monthly value area!
HOOD proceeded to rally through the monthly value area and beyond in subsequent trading sessions. Finding the first stocks to trigger the bullish 80% rule after a market correction is key for spotting the next market leaders!
▪ Bearish 80% Rule
If a security opens a period above the value area high , and subsequently closes below it, the bearish 80% rule triggers, turning the value area red. One can trade for a move to the bottom of the value area, using a close above the value area high as a potential stop!
ES proceeded to follow through and test the value area low before trending below the weekly value area
▪ Break Above VAH
When a security is inside value, the auction is in balance. When it breaks above a value area, it could be entering a period of upward price discovery. One can trade these breakouts with tight risk control by setting a stop inside the value area! These breakouts can be traded on all chart timeframes depending on the style of the individual trader. Combining multiple timeframes can result in even more effective trading setups.
RBLX broke out from the monthly value area on 4/22/25👇
RBLX proceeded to rally +62.78% in 39 trading sessions following the monthly VAH breakout!
▪ Break Below VAL
When a security is inside value, the auction is in balance. When it breaks below a value area, it could be entering a period of downward price discovery. One can trade these breakdowns with tight risk control by setting a stop inside the value area! These breakouts can be traded on all chart timeframes depending on the style of the individual trader. Combining multiple timeframes can result in even more effective trading setups.
CHWY broke below the monthly value area on 7/20/23👇
CHWY proceeded to decline -53.11% in the following 64 trading sessions following the monthly VAL breakdown!
💠 Metric Columns
▪ %𝚫 - 1-day percent change in price
▪ YTD %𝚫 - Year-to-date percent change in price
▪ MTD %𝚫 - Month-to-date percent change in price
▪ MAx Moving average extension - ATR % multiple from the 50D SMA -Inspired by Jeff Sun
▪ 52WR - Measures where a security is trading in relation to it’s 52wk high and 52wk low. Readings near 100% indicate close proximity to a 52wk high and readings near 0% indicate close proximity to a 52wk low
▪ Avg $Vol - Average volume (50 candles) * Price
▪ Vol RR - Candle volume/ Avg candle volume
💠 Best Practices
Monday -> Friday Post-market Analysis
1) Begin with a universe of stocks. I use the following linked universe screen as a starting point: www.tradingview.com
2) Screen for the HVY signal -> Add those stocks to a separate flagged (colored) watchlist
3) Screen for the Bullish 80% Rule signal -> Add those stocks to a separate flagged (colored) watchlist
4) Screen for the Break Above VAH Signal -> Add those stocks to a separate flagged (colored) watchlist
5) Screen for the Break Below VAL Signal -> Add those stocks to a separate flagged (colored) watchlist
6) Screen for the Bearish 80% Rule Signal -> Add those stocks to a separate flagged (colored) watchlist
7) Screen for the Bearish 80% Rule Signal -> Add those stocks to a separate flagged (colored) watchlist
8) Screen for the Trend Template Signal -> Add those stocks to a separate flagged (colored) watchlist
9) Toggle through each list and analyze each stock chart using the Supercharts tool in TradingView
10)Record the number of stocks in each list as a way of analyzing market conditions
Weekend Analysis
1) Begin with a universe of stocks. I use the following linked universe screen as a starting point: www.tradingview.com
2) Screen for the Rule of 100 Signal. Use this as a starting point for deeper fundamental and/or thematic and/or technical research
3) Screen for stocks that meet specific performance thresholds, such as YTD %𝚫 > 100% etc
💠 Get Creative
▪Users have the ability to layer signals on top of each other when screening. To do so, filter for a signal, and then filter your new list by another signal! Play around with the screener, and find what works best for you!

PyraTime Harmonic Matrix [Quad Horizon]Concept and Architecture
The PyraTime Harmonic Matrix is the quantitative engine of the PyraTime ecosystem. It is a multi-dimensional time projection tool that applies Digital Root Mathematics across a variable scalar grid.
While standard time analysis focuses on linear cycles, the Harmonic Matrix calculates Non-Linear Digital Roots (174, 285, 396...) and projects them through a proprietary "Event Horizon" logic. This allows the system to identify deep-structure market turning points that exist far beyond the current price action.
Technical Features
The Quad-Horizon Engine This script features a variable "Horizon Depth" setting, allowing traders to loop the harmonic sequence into the future to identify macro-scale pivots:
Standard Horizon: Projects the base Digital Root sequence (1x).
Double Horizon: Projects the sequence a second time (+999 intervals).
Triple/Quad Horizon: Extends the calculation up to 4x the standard length, identifying "Grand Cycle" completions on higher timeframes.
The Apex Sequence (963) The script mathematically identifies the completion of the Digital Root sum (The 963 Interval).
Visual Logic: These vectors are rendered in Gold with a lightning symbol (⚡), indicating a Cycle Termination point.
Event Horizon Dashboard To manage the complexity of multi-timeframe analysis, the script includes a live Head-Up Display (HUD).
Function: It scans all enabled timeframes (from 1m to Weekly) and calculates the exact time remaining to the single nearest future harmonic event.
Confluence Strategy (The Ecosystem) The Harmonic Matrix provides the "Time" (X-Axis). For a complete structural analysis, it is designed to be overlayed with our specific momentum and exhaustion tools:
Momentum Trigger: Use the Harmonic Sniper Trigger to identify entry signals when price hits a Matrix line:
Exhaustion Filter: Use the Sequential Exhaustion 9/13 to confirm trend fatigue at Matrix intervals:
Disclaimer This tool is for quantitative time analysis. It projects mathematical intervals and does not predict price direction. Past performance is not indicative of future results.

All-in-One (PHT)All-in-One (PHT) — Modular Multi-Tool Market Analyzer (Pine Script v6)
All-in-One (PHT) is a complete, modular market-analysis toolkit designed for traders who want clean, reliable, and professional-grade charting - in a single indicator.
Built using Pine Script® v6 and structured with reusable PHT-Libraries (EMA Band, Bollinger Band, Fractal, Session), this indicator delivers clarity, precision, and consistent performance across all markets and timeframes.
Unlike traditional indicators that mix logic and visuals, AIO (PHT) uses a fully modular architecture. All calculations come from dedicated libraries, and this main script focuses purely on visual output and clean plotting.
This ensures:
Stable plot references
Zero repainting in all included modules
High performance even with complex overlays
Easy extensibility for future upgrades
🔥 Included Modules
1. EMA Band (PHT Library)
A triple-EMA band designed for trend clarity and structure.
Provides:
EMA of High
EMA of Close
EMA of Low
Band fill visualization
Ideal for identifying trend strength, momentum pockets, and mean-reversion zones.
2. Bollinger Band Suite
A complete Bollinger framework with:
SMA / EMA / WMA midline options
Dual standard-deviation envelopes
Multi-zone band fills (upper, middle, lower)
User-controlled visibility for each layer
Perfect for volatility detection, squeeze identification, and precision envelope trading.
3. Fractal Engine (High/Low Pivots)
Fast, reliable fractal detection using user-defined left/right periods.
Features:
Pivot Highs & Pivot Lows
Multiple marker sizes (Tiny → Large)
Zero-lag plotting with proper offset handling
Useful for swing structure, breakout confirmation, and automated level marking.
4. Market Session Tracker
A powerful session-mapping module that visually highlights market sessions with:
Dynamic session boxes
High & Low markers
Persistent historical sessions
Auto-managed labels, lines, and live updates
Timezone-aware session boundaries (supports IANA zones)
Designed for identifying daily ranges, session liquidity, volatility pockets, and market timing.
🧠 Why This Indicator Is Different
Most “all-in-one” tools mix plotting, logic, and calculations in a single heavy script, causing lag, reference instability, and repainting issues.
All-in-One (PHT) solves this by using a Pine v6 library architecture:
Each component is computed in its own library
The main script handles only visuals
No hidden code, no repainting tricks
Maximum clarity and maintainability
This design mirrors professional software architecture:
clear separation of logic, visuals, and user interface.
🎯 Ideal For
Trend traders
Scalpers & intraday traders
Swing and positional traders
Volatility analysts
Structure-based price action traders
Anyone who wants multiple high-quality tools in one clean indicator
Whether you analyze markets manually or build algorithmic systems, AIO (PHT) provides a solid foundation.
⚙️ Features at a Glance
Fully modular Pine v6 design
Complete EMA band engine
Advanced Bollinger band system (multi-deviation, multi-fill)
Configurable fractal high/low markers
Smart session boxing with history
Clean visuals and transparent settings
No repainting
Fully customizable colors & visibility
Optimized for performance
💡 How to Use
Choose the modules you want to display (EMA, BB, Fractals, Sessions).
Adjust lengths, deviations, or fractal periods as per your trading style.
Use session boxes to understand volatility timing.
Combine bands + fractals for advanced structure-based decisions.
The indicator is designed to overlay on price for maximum clarity.
🚀 Future Upgrades
The PHT framework supports smooth future expansion. Planned modules include:
ATR/volatility engines
Trend switches
Supertrend/Donchian plugins
Volume profile extensions
Updates will remain backward compatible across all modules.
⭐ Summary
All-in-One (PHT) is not just another overlay — it’s a complete multi-tool trading framework built using professional engineering practices in Pine Script v6.
If you want cleaner charts, smarter signals, and a high-performance modular system, this indicator gives you everything in one reliable package.

The Consolidator [Pattern Foresight]Overview
This Consolidator script uses detection logic to chart bullish and bearish consolidation markers and to chart shaded high/low price range lines (with green shading between the bottom range line and the price for bullish trends and with red shading between the top range line and the price for bearish trends). A consolidation point is telling you: “Price has gone quiet here. Expect expansion—likely a breakout—once volume returns.” Low volatility squeezes often lead to a breakout.
The Consolidator attempts to identify periods where the price is moving sideways, compressing into a tighter range, forming a base or coil, or preparing for a trend continuation or reversal.
Bullish Consolidation Markers - Bullish consolidation occurs when the price is coiling but buyers are in control. These are useful to help detect bull flags, ascending triangles, tight bases before breakouts.
Bearish Consolidation Markers - These are useful to help detect bear flags, descending triangles, distribution periods.
Why this indicator is unique
The Consolidator attempts to be a predictive pattern-recognition system, not a simple channel indicator by measuring consolidation tightness and high/low price ranges. The range lines help visualize the “coil” where price is compressing. Consolidation markers classify which side of the coil price is leaning toward: bullish pressure or bearish pressure. The script attempts to detect structural bullish patterns with breakout intelligence.
Usage
Consolidation Lookback - Controls how many bars are examined when determining the consolidation “box.” Think of it as: “How wide of a window do you want to search for a sideways range?” Shorter lookback (10–20): Tighter, more sensitive consolidations, faster signals, more false positives, and useful for scalping and day trading. Longer lookback (30–60): Larger, more stable consolidation zones, fewer false positives, and better for swing trading.
Tolerance Percent - Defines how “flat” highs/lows must be to qualify as consolidation. This is the key part of compression detection. Lower tolerance (0.3–0.6%): Only very tight ranges qualify with fewer but higher-quality consolidation zones. Higher tolerance (0.7–1.5%): wider ranges and more consolidation signals. Small changes to tolerance drastically change the number of consolidation markers (higher = more consolidation markers).
Disclaimer:
This script is for informational purposes only. Nothing contained herein should be construed as financial, investment, or trading advice. The author is not a financial advisor and is not providing personalized recommendations. All trading involves risk, including the potential loss of principal. The author makes no assurances of accuracy, performance, or future results. History may not reflect future performance. You are solely responsible for your own investment decisions and agree to use this script entirely at your own risk.

Distância Preço vs EMAIndicador pra ser usado em tendencias consolidadas como referencias para retorno a média

TrenVantage TRADER - Market Structure Intelligence 📘 TrenVantage TRADER – Market Structure Intelligence
Hello Traders!
We are excited to introduce TrenVantage TRADER! This indicator is a professional-grade market structure tool designed for active traders and analysts who require deeper insight and more precise control. It combines advanced pivot-based level detection, a dynamic ZigZag engine, multi-timeframe trend awareness, and Fibonacci integration into a clear and actionable visual layout. The TRADER edition offers enhanced logic that highlights multiple key levels (up to 8) with strength ratings, making it ideal for traders who need full market context without oversimplification. Whether you are day-trading, swing-trading, or managing multiple assets, TrenVantage TRADER empowers you to understand price structure, identify confluence zones, and monitor directional bias in real time.
✨ Key Features
🔹 Smart Support & Resistance (Max 8 Levels – TRADER Version)
- Auto-detected levels using precision candle-body logic
- Prioritizes the strongest zones with strength ratings
- Includes tested vs. untested levels for professional analysis
- Ideal for reaction-based trading and advanced setups
🔹 Advanced Pivot Engine
- Timeframe-aware, body-focused pivot detection
- Dynamic lookback for professional-level accuracy
- Filters weak pivots to reduce chart clutter
🔹 Dynamic Trend Detection (ZigZag Core)
- Real-time uptrend / downtrend state with swing-based mapping
- Adjustable deviation and sensitivity for professional precision
- Tracks higher highs, higher lows, lower highs, lower lows
🔹 Multi-Timeframe Trend Integration
- Detects trends across multiple higher timeframes
- Displays trend confluence scores for actionable insight
- Helps identify alignment with larger market bias
🔹 Status Box Dashboard
- Displays current trend, price, price change, and SMA & EMA trend position
- Nearest S/R with distance and strength information
- Multi-timeframe trend direction and confluence
- Market position summary (above, below, or between levels)
- Active S/R count and proximity detection status
🔹Dual SMA & EMA Overlay
- Fully adjustable period and visual style
- Acts as a directional filter and confluence tool
- Integrated into status box for instant comparison
- Crossover signals printed
🔹 Proximity & Trend Alerts
- Alerts when price approaches key S/R within defined distance
- Alerts on trend changes (Uptrend / Downtrend)
- Level break alerts for advanced breakout and reversal strategies
- Once-per-bar logic to avoid excessive notifications
🔹 Fibonacci Levels Overlay
- Auto-detects recent swing high/low for retracements and extensions
- Retracements: 23.6%, 38.2%, 50%, 61.8%
- Extensions: 127.2%, 161.8%
- Labels percentage levels directly on chart
- Works alongside S/R for confluence-based analysis
🔍 In-Depth Feature Breakdown
1. Smart Support & Resistance Levels
TrenVantage TRADER uses a refined pivot-based engine combined with candle-body logic to detect the strongest support and resistance zones. Unlike simpler tools, it can maintain up to 8 key levels with visual strength ratings.
How It Works
- Prioritizes zones with multiple touches and tested/untested status
- Tracks both current timeframe and higher timeframe context
- Highlights levels with color-coded clarity:
- Green = Support
- Red = Resistance
How It Helps Traders
- Provides comprehensive market structure overview
- Helps identify strong confluence zones for trading setups
- Reduces guesswork and supports data-driven decisions
2. Advanced Pivot Engine
Professional-grade pivot detection ensures only significant pivots are plotted, improving the reliability of support/resistance levels.
How It Works
- Dynamically adapts lookback periods based on volatility
- Focuses on candle bodies for more robust zone detection
- Filters out weak or irrelevant pivots
How It Helps Traders
- Clean, reliable chart with actionable levels
- Supports both breakout and reaction strategies
- Works across scalping, day, and swing-trading approaches
3. Dynamic Trend Detection (ZigZag Core)
Tracks real structural swings for professional trend analysis, avoiding guesswork or noise.
How It Works
- Detects higher highs/lows and lower highs/lows
- Adjustable deviation filtering for precision
- Smoothly updates trend direction without excessive repainting
How It Helps Traders
- Quickly identifies trend shifts and continuation setups
- Aligns positions with market structure for higher probability trades
- Reduces false signals by focusing on meaningful swings
4. Multi-Timeframe Trend Integration
Professional traders need to see trend alignment across multiple timeframes.
How It Works
- Detects trend direction on 2–3 higher timeframes
- Displays MTF confluence in status box
- Provides a clear bias score for informed decision-making
How It Helps Traders
- Confirms entries and exits with higher timeframe alignment
- Improves risk management with multi-level awareness
- Supports advanced strategy building
5 . Status Box Dashboard
A compact information hub displaying essential market data in real time.
What It Shows
- Trend direction & momentum bias
- SMA position & influence
- Nearest support & resistance levels
- Distance and strength of each level
- Multi-timeframe trend confluence
- Market position summary
- Active S/R count and proximity alerts
How It Helps Traders
- Reduces need to constantly scan the chart
- Improves situational awareness and trade timing
- Supports multi-asset monitoring with clarity
6. Dual SMA & EMA Overlay
Adds professional-grade trend filters with both SMA and EMA, giving traders more clarity and confluence without chart clutter.
How It Works
- Plots two adjustable moving averages: one SMA and one EMA
- SMA serves as a directional trend filter, EMA highlights momentum shifts
- Both moving averages can be integrated into the status box for instant comparison
- Optional cross signals indicate potential trend reversals or acceleration
How It Helps Traders
- Confirms trend alignment across both smooth (SMA) and reactive (EMA) perspectives
- Detects momentum shifts early to support entries, exits, and trade management
- Adds confluence when combined with support/resistance levels and multi-timeframe trends
- Provides a clear visual guide for swing, day, and position trading
7. Proximity & Trend Alerts
Professional-grade alerts ensure traders never miss actionable events.
How It Works
- Alerts when price approaches key levels within set distance
- Alerts on trend change or level break
- Configured once-per-bar for clarity
How It Helps Traders
- Supports breakout, reaction, and reversal strategies
- Reduces chart monitoring time
- Ensures key market shifts are noticed immediately
8. Fibonacci Levels Overlay
TrenVantage TRADER integrates dynamic Fibonacci retracements and extensions directly into your chart, giving you an advanced tool to anticipate potential reversal, continuation, and breakout zones.
How It Works
- Automatically detects the most recent significant swing high and swing low
- Draws retracement levels: 23.6%, 38.2%, 50%, 61.8%
- Draws extension levels: 127.2%, 161.8%
- Retracements follow the direction of the last swing; extensions project potential breakout targets
- Optional labels show the percentage level directly on the chart for clarity
- Fully adjustable opacity and visibility settings for clean visual representation
How It Helps Traders
- Highlights areas where price is likely to react or stall
- Supports both trend-following and counter-trend strategies
- Works in conjunction with support/resistance levels for confluence-based decision-making
- Adds an objective, mathematically-based reference for target setting and trade management
🚀 Getting Started (Quick Guide)
🔹Add the Indicator to Your Chart
- Works instantly on any timeframe or market
🔹Adjust the Settings
- Configure S/R levels, SMA, MTF trend, and alerts
🔹Watch Key Levels
- Red = Key Resistance Levels, Green = Key Support Levels
🔹Level Types
- By default, Tested Levels = Dotted, Untested Levels = Solid
🔹Monitor Status Box
- Check trend, SMA position, nearest levels, and market context
🔹Set Alerts
- Enable proximity, trend change, and level break notifications
📈 Best Practices for TrenVantage TRADER
🔹 Trend Confirmation:
- Combine ZigZag trend state, SMA, and MTF trend alignment.
🔹 Level Reactions:
- Observe price at the nearest support/resistance zones; proximity alerts help anticipate reactions.
🔹 Market Positioning:
-Use status box to quickly assess whether price is above, below, or between levels.
🔹 Confluence Building:
- Combine multiple levels, SMA, and MTF alignment for higher probability setups.
🔹 Professional Clarity:
- Up to 8 key levels are shown with strength ratings, balancing insight and chart readability.
📌 Disclaimer
This indicator is a technical analysis tool provided for informational and educational purposes only. It does not constitute financial advice, trading advice, or investment recommendations. All trading involves risk, and past performance does not guarantee future results. Always perform your own analysis and use proper risk management. You are solely responsible for any decisions made based on this tool.
If you'd like access or have any questions, feel free to reach out to me directly via DM.

Trend CandlesThis shows candlesticks that only follow the trend. So it will make it easier to know where the trend is going.
Trend ChannelThis Trend Channel is designed to simplify how traders view trends, while also keeping track of potential shifts in trends with signals. It is designed for traders that prefer less over more.
The indicator can be used for trend following, trend reversals and confirmation in combination with price or other indicators.
At the core is one EMA and a smoothed volatility based channel around it.
The purpose of the channel is to avoid false signals on trend reclaim or trend loss and instead identify trend deviations.
The indicator also incorporates long and short EMA cross-over signals to recognize possible shifts in trend without having to overlay multiple EMAs and keep the chart cleaner.
Additionally the indicator fires warnings for potential false signals on golden/death crosses with a letter "W" above/below the signal candle. Those warnings are based on the distance between price and the crossover. When the distance is above a certain threshold the indicator fires a warning that price might mean revert.
Traders can customize all inputs in the settings.

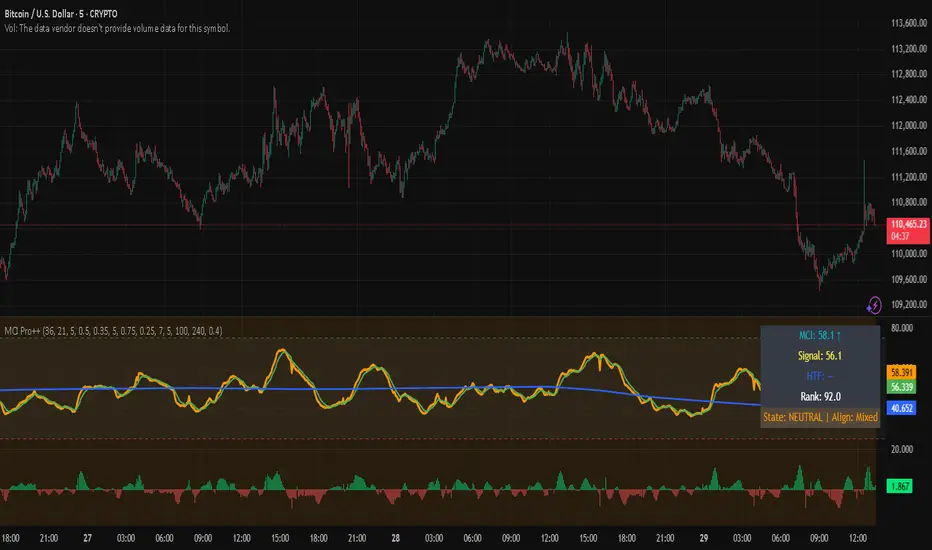
Market Clarity Index (MCI) — ProThe MCI Pro++ expands on the Lite version with deeper controls, higher-timeframe blending, slope analysis, and clarity ranking. It captures the balance between trend coherence vs. noise using entropy, drift, and volume dynamics mapped through a φ²-based sigmoid.
Key Features:
Fully adjustable weights (drift, volume shocks, entropy)
Higher-timeframe blending with adjustable weighting
Clarity slope + histogram for momentum tracking
Range rank (0–100) to spot relative extremes
Bull/Bear markers + HTF alignment markers
Optional status table with live clarity state
Trading Logic:
✅ High-clarity regime when MCI > high threshold
❌ Low-clarity regime when MCI < low threshold
Neutral otherwise; use slope, HTF alignment, and range rank as context filters.
⚠️ Invite-Only Access:
This Pro version is available by subscription through SnapfrontTech.
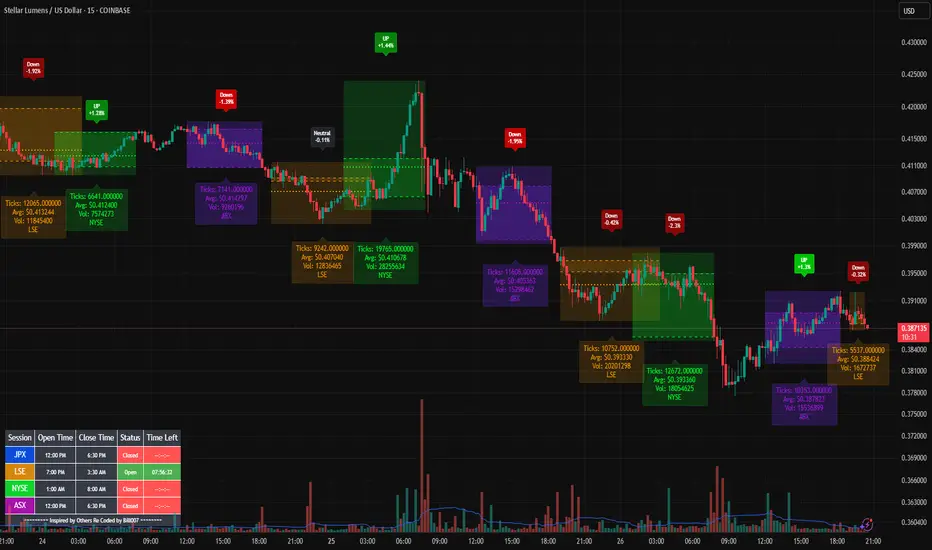
Bills Advanced Market Sessions V5Bill007 Advanced Enhanced Market Sessions & Table V5 is a TradingView Pine Script indicator that
visualizes major stock market sessions and data for (Tokyo, London, New York, Sydney, Frankfurt) on charts.
**Purpose and Logic:**
- Visual Displays include session boxes, open/close/average lines, labels for session
names/metrics (ticks, avg price, volume), and trend labels (UP/Down/Neutral with % change)
and a Debug table.
- Uses custom types (SessionDisplay, SessionInfo) and methods to create/update sessions
dynamically, handling multi-part sessions (e.g., Tokyo breaks).
- Batch updates sessions for efficiency, checks timezones, weekdays, and daily changes to avoid
duplicates.
- Includes tables for session times/status/countdowns and debug metrics (tick range, average
price, volume, trend %, open, close).
- Supports 25 timezones for accurate global session timing.
- All labels have dynamaic tooltips that provide extra outputs which saves chart clutter
- Realtime lastbar session updates for current session
**Settings:**
- Select Market Sessions to suit
- Toggles for lines, ranges, averages, volumes, labels, boxes, weekends.
- Customizable colors, timezones, session times, thresholds for neutral trends, label offsets to
move labels around for clearer visuals.
- Table position/timezone, debug options.
- Timezone select to update Session times open close according to what time zone you're in
**Benefits:**
- Enhanced session data at a glance
- Enhances multi-market awareness, highlights session overlaps, trends, and key metrics.
- Aids timing entries/exits, volume analysis, reduces clutter with toggles.
- Supports global trading strategies with accurate timezone handling and visuals.
MTPI SUI | JeffreyTimmermansMedium-Term Trend Probability Indicator
The "Medium-Term Trend Probability Indicator" on SUI is a custom-designed tool created to analyze SUI from a medium-term perspective. While short-term indicators often respond to quick fluctuations and long-term models focus on broader macro cycles, the MTPI sits perfectly in between—detecting trend shifts over multiple weeks and helping traders and analysts stay ahead of the curve.
This specific version of the MTPI is applied to SUI, making it a dedicated trend-following tool for this unique digital asset, tuned to reflect its own volatility and structural behavior.
Key Features
Medium-Term Focus:
The MTPI is optimized for trend tracking over medium horizons—typically weeks to a few months. It filters out noise while remaining responsive to meaningful directional changes.
6 Input Signals:
The model combines 6 carefully selected input trend-following indicators, each targeting different dimensions of trend strength and continuation.
Market Regimes:
The MTPI classifies market conditions into:
Bullish → Strong upward momentum and trend confirmation
Bearish → Sustained downward pressure and breakdown signals
Neutral → Mixed signals or transition phases, often seen in consolidations or early reversals
Visual Background:
The chart background shifts based on the active regime. This provides instant visual clarity on whether the asset is trending, reversing, or consolidating.
Indicator Dashboard:
At the bottom of the chart, the MTPI includes a live dashboard showing:
The state of all 6 inputs (Bullish, Bearish, Neutral)
The composite MTPI Score
The resulting Market Trend classification
How It Works
Input Signal Logic:
Each input returns one of three possible scores:
+1 = Bullish
-1 = Bearish
0 = Neutral
Score Aggregation:
The MTPI Score is calculated as the average of all 6 input values:
Score > +0.1 → Bullish regime
Score < -0.1 → Bearish regime
Between -0.1 and +0.1 → Neutral regime
Background Coloring:
The background changes automatically to match the current trend regime, making it visually easy to interpret the dominant market environment.
Use Cases
Mid-Term Strategy Alignment:
Use the MTPI to align with the dominant medium-term market direction on SUI.
Rotation & Momentum Detection:
Catch early signs of reversals, breakout expansions, or trend exhaustion.
Multi-Timeframe Integration:
Combine MTPI with short-term tools (STPI) or long-term indicators (LTPI) for a complete market overview.
Dynamic Alerts:
Bullish Alert: MTPI Score crosses above +0.1
Bearish Alert: MTPI Score crosses below -0.1
Neutral Zone: MTPI Score enters between -0.1 and +0.1
Conclusion
The MTPI – SUI is a reliable medium-term probability model that simplifies complex market structure into an actionable, color-coded signal system. By distilling 6 intelligent inputs into one combined trend score, it offers clear directional bias and regime classification—crucial for positioning in a volatile asset like SUI. Whether used standalone or as part of a broader trend framework, this indicator enhances clarity, discipline, and precision in your medium-term trading decisions.

Price Imbalance Flow Tracker (PIFT)Price Imbalance Flow Tracker (PIFT)
PIFT is a visual volatility and structure indicator that maps market imbalance zones using dynamic envelope logic. It plots three sets of envelope bands derived from different moving averages — short, medium, and long — with volatility-based offsets scaled by ATR. These envelopes adapt in real time to reflect momentum expansion, compression, and directional pressure.
- The system highlights only the dominant envelope layer at any given moment (short cancels medium/long, medium cancels long) to reduce clutter and help you focus on the most reactive structure.
- There’s also a central yellow zone representing the core trend channel — a tighter band derived from the short MA, helping you track price containment and breakout zones.
- The green and red fills show where price is expanding beyond core levels, acting as pressure zones. These fills compress during consolidations and widen during impulse moves, giving you a clean read on momentum shifts.
You can toggle:
- Full grid view (all envelopes)
- Core channel only
- Price tracks (moving averages)
- Dynamic pressure zones
Use PIFT to:
- Identify clean trend continuation inside the yellow zone
- Spot momentum exhaustion when price rides the outer bands
- Filter false moves when fills contract but price keeps drifting
- See structure shifts before standard indicators like Bollinger Bands react
This isn’t just another moving average overlay. It’s a dynamic envelope hierarchy built for traders who want to read price flow — not just lagging trend direction.
See the following images for a more in-depth breakdown.
1.)
2.)
3.)
4.)
5.)
6.)
7.)
8.)
9.)
10.)
11.)
12.)
13.)
14.)

Savitzky Flow Bands [ChartPrime]An advanced trend-following tool that applies the Savitzky-Golay smoothing algorithm to price and dynamically adapts trend bands to visualize directional bias and trend strength.
savitzky_golay_filter_w_15_vectors(source) =>
float sum = 0.0
float polynomial = 0.0
float coefficients = array.new(16)
// Predefined 15 coefficients
for i = -4 to 4
coefficients.set(i + 4, i) // from -4 to 5
if i == 4
for j = 5 to -4
for g = 8 to 15
coefficients.set(g, j) // from 5 to -4
// Calculate normalization factor as the sum of absolute values of coefficients
float norm_factor = coefficients.sum()
// Loop through coefficients and calculate the weighted sum
for i = 0 to coefficients.size()-1
sum := sum + coefficients.get(i) * source
// Calculate the smoothed value
for i = 1 to length-1
polynomial := math.sum(sum / norm_factor, i) / i
polynomial
⯁ KEY FEATURES & HOW TO USE
Savitzky-Golay Filtered Line (Basis):
Smooths out price noise using the Savitzky-Golay method, offering a more refined trend path than traditional moving averages. This centerline acts as the trend anchor and visually changes color depending on its slope to reflect the active trend direction.
Dynamic Trend Bands (Upper/Lower):
Constructed from the filtered line with a dynamic offset based on recent price volatility (ATR). These bands shift based on price pressure and are locked once price closes beyond them.
Helpful for identifying breakout moments or exhaustion areas where reversals are likely.
Trend Direction Detection:
A directional signal is confirmed when price breaks and closes above the upper band (uptrend) or below the lower band (downtrend).
Provides a clear and systematic way to identify when a trend begins.
Trend Duration Counter (Visual Decay Line):
A fading overlay line shows how long a trend has been active since the last reversal. The longer the trend persists, the more transparent this extension becomes.
This visual fading effect helps traders anticipate potential trend exhaustion and prepare for reversals or take-profit zones.
Reversal Signals (Diamond Markers):
Diamond shapes are plotted at each market shift, allowing users to visually pinpoint when the trend has flipped.
These markers act as decision zones for entry, exit, or stop-loss adjustments based on directional flow changes.
Color-Based Bar and Candle Painting:
Candles are painted green in uptrends and orange in downtrends, providing an intuitive glance at trend state without needing to interpret numbers.
Helps users stay aligned with the trend visually and avoid counter-trend entries.
⯁ CONCLUSION
The Savitzky Flow Bands indicator offers a modernized, visually rich way to track trend shifts using a scientific smoothing method. With dynamic trend envelopes, color-coded cues, and visual markers, it equips traders with a structured framework to follow the market's flow and make data-driven decisions. Ideal for swing traders, momentum strategists, or any trader looking to trade in sync with the prevailing trend.

30-Day Rolling VWAP30-Day Rolling VWAP (30-RVWAP)
Overview:
The 30-Day Rolling VWAP is an advanced technical analysis tool designed for crypto traders that combines Volume Weighted Average Price over a 30-day rolling window with sophisticated volume analysis to generate high-probability trading signals.
Key Features:
1. Dynamic Color-Coded VWAP Line
Green glow = Strong bullish pressure
Red glow = Strong bearish pressure
Gray = Neutral/balanced market
The line changes color based on volume-weighted directional pressure
2. Volume Pressure Zones
Multi-layered glowing fill effect around VWAP
Expands/contracts based on volatility and volume
Shows potential support/resistance zones
3. Smart Alert System
Buy/Sell alerts based on VWAP color change
Cross above/below VWAP alerts
Confidence levels based on pressure strength
How to Use:
1. Color Signals
When VWAP turns green: Consider buying (bullish pressure)
When VWAP turns red: Consider selling (bearish pressure)
Gray color indicates consolidation/neutral market
2. Alert Structure
Buy/Sell alerts include confidence percentage (0-100%)
Higher confidence = stronger directional pressure
Cross alerts notify when price crosses VWAP with distance
3. Volume Pressure Zones
Wider zones = higher volatility/volume
Use zones as dynamic support/resistance levels
Watch for price reactions at zone boundaries
4. Trading Strategy
Enter long when VWAP turns green with high confidence (60%+)
Enter short when VWAP turns red with high confidence
Use VWAP as trailing stop (exit when cross alerts trigger)
Use pressure zones for profit targets
5. Alert Messages
Buy Signal: "BTCUSDT | 15m | BUY Signal | Price: 42380.00 | VWAP: 42350.00 | Distance: 0.07% | Confidence: 78% due to strong bullish pressure"
Cross Alert: "BTCUSDT | 15m | CROSS ABOVE VWAP | Price: 42360.00 | VWAP: 42350.00 | Distance: 0.02%"
Best Practices:
Use higher timeframes (4H+) for trend direction; preferably **daily timeframe**
Combine with other indicators for confirmation
Monitor volume for signal validation
Consider market context when entering trades
The indicator combines multiple volume metrics to filter out false signals and provides clear visual and alert-based trading signals.

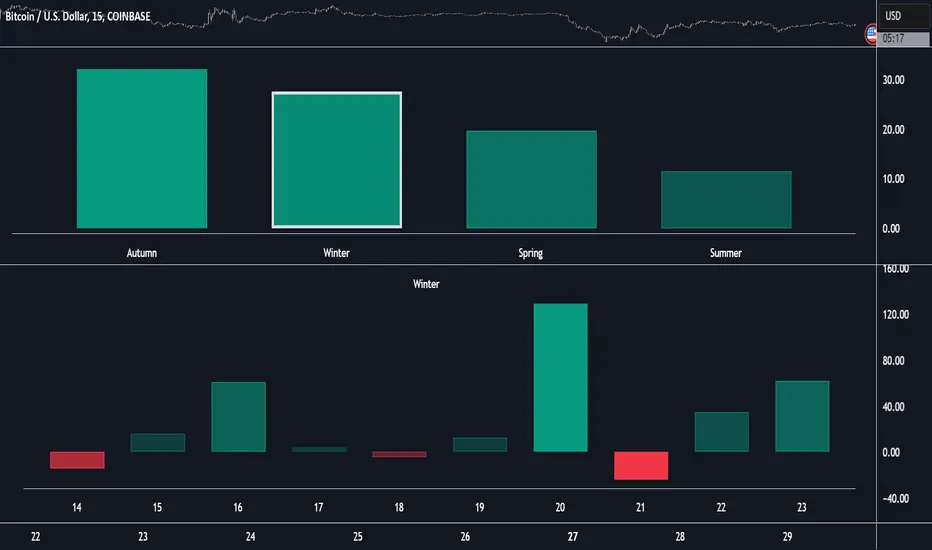
Market Performance by Yearly Seasons [LuxAlgo]The Market Performance by Yearly Seasons tool allows traders to analyze the average returns of the four seasons of the year and the raw returns of each separate season.
🔶 USAGE
By default, the tool displays the average returns for each season over the last 10 years in the form of bars, with the current session highlighted as a bordered bar.
Traders can choose to display the raw returns by year for each season separately and select the maximum number of seasons (years) to display.
🔹 Hemispheres
Traders can select the hemisphere in which they prefer to view the data.
🔹 Season Types
Traders can select the type of seasons between meteorological (by default) and astronomical.
The meteorological seasons are as follows:
Autumn: months from September to November
Winter: months from December to February
Spring: months from March to May
Summer: months from June to August
The astronomical seasons are as follows:
Autumn: from the equinox on September 22
Winter: from the solstice on December 21
Spring: from the equinox on March 20
Summer: from the solstice on June 21
🔹 Displaying the data
Traders can choose between two display modes, average returns by season or raw returns by season and year.
🔶 SETTINGS
Max seasons: Maximum number of seasons
Hemisphere: Select NORTHERN or SOUTHERN hemisphere
Season Type: Select the type of season - ASTRONOMICAL or METEOROLOGICAL
Display: Select display mode, all four seasons, or any one of them
🔹 Style
Bar Size & Autofit: Select the size of the bars and enable/disable the autofit feature
Labels Size: Select the label size
Colors & Gradient: Select the default color for bullish and bearish returns and enable/disable the gradient feature
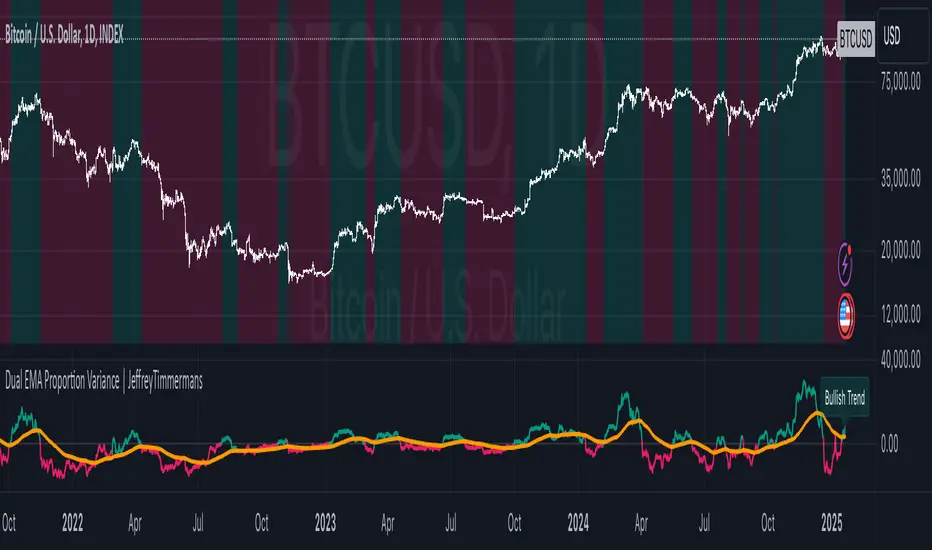
Dual EMA Proportion Variance | JeffreyTimmermansDual EMA Proportion Variance
The "Dual EMA Proportion Variance" Indicator provides a robust way to analyze price trends, volatility, and momentum using dual EMA calculations combined with percentile-based thresholds. This approach enables traders to identify significant bullish and bearish trends while incorporating smoothing and tailoring options for better adaptability.
Key Features
Dual EMA with Proportion Variance
DEMA Calculation: Computes the Dual Exponential Moving Average (DEMA) based on a user-defined length and source.
Proportion Thresholds: Uses percentile-based thresholds (e.g., 60/45, 60/40, 55/45, or 55/40) to determine upper and lower bounds for trend detection. Percentile thresholds help identify key levels of market behavior based on historical data.
Momentum and Volatility Analysis
Momentum Calculation: Computes momentum based on proximity to percentile levels, smoothed using a simple moving average (SMA) if enabled.
Volatility Incorporation: Uses the standard deviation (SD) of the lower percentile (PerDown) to define additional levels of significance.
Smoothing and Trend Calculation
Smoothing Options: Enables optional smoothing for momentum and trend values, helping reduce noise.
EMA Confluence: Adds an additional EMA overlay to enhance the trend confirmation process.
Customizable Visuals
Background Coloring: Dynamically changes the background color based on trend direction (bullish or bearish).
Momentum Plotting: Displays smoothed momentum and EMA confluence lines on the chart, with clear visual differentiation.
Alerts
Bullish Signal: Triggers when the trend transitions from neutral or bearish to bullish.
Bearish Signal: Triggers when the trend transitions from neutral or bullish to bearish.
Inputs Overview
DEMA Inputs
Length (DemaLen): Defines the length of the Dual EMA calculation.
Source (DemaSrc): Allows selection of price data (e.g., high, low, close) for the DEMA computation.
Proportion Settings
Proportion Length (PerLen): Defines the lookback period for percentile calculations.
Proportion Type (pertype): Choose from predefined combinations (e.g., 60/45, 60/40) to customize thresholds.
Smoothing Options
Enable Smoothing (UseSmoothing): Toggle to enable or disable smoothing.
Smoothing Length (SmoothingLen): Specifies the lookback period for smoothing.
Standard Deviation
Length (SDlen): Length of the lookback period used to calculate the standard deviation.
Tailoring
Bullish/Bearish Colors (ColUp/ColDown): Customizable colors for bullish and bearish trends.
Background Colors (ShowBGCol): Toggle to enable or disable background coloring.
Momentum Plot (PlotMomentum): Toggle to show or hide the momentum plot.
EMA Confluence
Enable Extra EMA (IncludeEma): Adds an additional EMA layer for trend confirmation.
Length (EmaLen): Defines the length of the EMA.
Indicator Behavior
Trend Detection
Bullish Trend: When the smoothed momentum (smoothedPT) is above zero and higher than the EMA (if enabled).
Bearish Trend: When the smoothed momentum is below zero and lower than the EMA (if enabled).
Signal Generation
Bullish Signal: Triggered on a crossover of smoothedTrend from negative to positive.
Bearish Signal: Triggered on a crossunder of smoothedTrend from positive to negative.
Customizations
Percentile Adjustments: Choose from various proportion thresholds to suit specific market conditions.
Smoothing Options: Fine-tune the level of noise reduction by adjusting smoothing parameters.
Visual Tailoring: Customize chart visuals, including colors, momentum plots, and background highlights.
EMA Inclusion: Optionally enable the extra EMA for more conservative trend confirmation.
Use Cases
Momentum Trading: Identify bullish or bearish momentum shifts based on percentile levels.
Volatility Assessment: Incorporate standard deviation levels to evaluate price volatility.
Trend Following: Align trades with dominant market trends using percentile thresholds and EMA confirmation.
Alerts for Automation: Set alerts for real-time notifications of potential trade opportunities.
This indicator provides flexibility and precision, making it suitable for a variety of trading styles, including trend following, swing trading, and momentum-based strategies.
This script is inspired by "Patito_1" . However, it is more advanced and includes additional features and options.
-Jeffrey
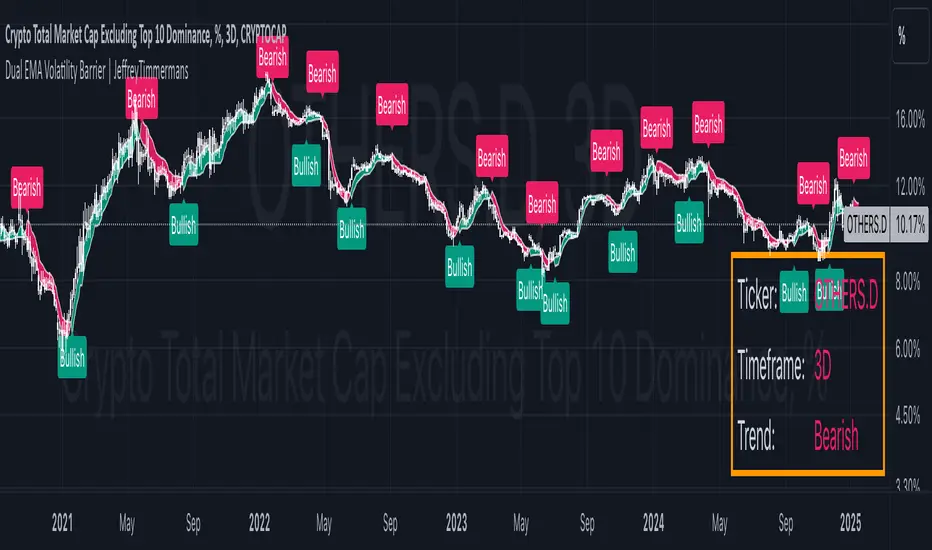
Dual EMA Volatility Barrier | JeffreyTimmermansDual EMA Volatility Barrier
The "Dual EMA Volatility Barrier" indicator combines the power of the Double Exponential Moving Average (DEMA) with volatility-based stops to provide a robust trend-following system. This indicator helps traders identify and confirm trends, offering a way to filter out noise using volatility measures like the Average True Range (ATR) and a higher timeframe filter for additional trend validation.
Key Features
Dual Exponential Moving Average (DEMA):
DEMA Calculation: A more responsive moving average that reduces lag compared to standard EMAs. This helps detect trend changes faster.
Source Customization: Allows traders to choose the source (default is close), which can help adapt the strategy for different market conditions.
Volatility Barrier (Vstop):
Volatility-Based Stops: The Vstop is calculated using the Average True Range (ATR) multiplied by a user-defined factor. This forms a dynamic stop level that adjusts based on market volatility.
Trend Direction: The Vstop adapts to whether the market is in an uptrend or downtrend, providing a stop-loss level that moves accordingly.
Higher Timeframe Trend Filter:
Higher Timeframe DEMA: The higher timeframe filter uses a DEMA from a larger timeframe to confirm the trend direction. Only consider bullish signals if the price is above the higher timeframe DEMA.
Customizable Higher Timeframe: Traders can select any timeframe (e.g., D for daily) to check the trend from a higher perspective.
Signal Generation:
Bullish Signal: Triggered when the trend is up, and the price is above the higher timeframe DEMA, with a corresponding Vstop change indicating an upward trend.
Bearish Signal: Triggered when the trend is down and the price is below the higher timeframe DEMA, with a corresponding Vstop change indicating a downward trend.
Trend Reversals: Identifies key trend reversals by showing the transition between uptrend and downtrend states.
Plotting and Visuals:
DEMA and Vstop Plot: The indicator plots both the DEMA and the Vstop on the chart, providing a visual guide for trend and volatility.
Background Color Fill: The area between the DEMA and Vstop is filled with a color (green for bullish, red for bearish) to provide a clear visual representation of the trend.
Signal Labels: Plot arrows and labels ("Bullish" and "Bearish") directly on the chart to highlight trend changes.
Dashboard:
Ticker & Timeframe Display: The dashboard in the bottom-right corner shows the current symbol (ticker) and timeframe, along with the current trend (Bullish or Bearish).
Real-Time Updates: The dashboard updates in real time, providing traders with quick insights into the current market conditions.
Alerts:
Bullish Alert: Activated when the trend is bullish and confirmed by the higher timeframe DEMA.
Bearish Alert: Activated when the trend is bearish and confirmed by the higher timeframe DEMA.
Customizable Messages: Alerts provide details about the ticker and trend conditions for easy action.
Improvements:
Higher Timeframe Filtering: The higher timeframe DEMA filter ensures that traders align their trades with the broader market trend, improving the overall accuracy of signals.
Volatility-Based Stops: The ATR-based volatility stops allow for adaptive risk management that responds to changing market conditions.
Dynamic Signal Detection: The bullish and bearish signals change in real time, providing actionable insights for traders.
Visual and Dashboard Updates: The chart visually reflects the trend and volatility dynamics, while the dashboard provides summary information at a glance.
Customizable Alerts: Alerts based on trend changes make it easy to stay informed without constantly monitoring the chart.
Use Cases:
Trend Following: Ideal for identifying and following strong trends by combining short-term and long-term trend indicators.
Volatility-Based Risk Management: Use the Vstop to manage trade exits, as it adjusts to market volatility.
Higher Timeframe Confirmation: Use the higher timeframe DEMA to ensure that the trade aligns with the overall market trend.
Alerts for Real-Time Action: Set alerts to notify when the market signals a shift, whether bullish or bearish.
The Dual EMA Volatility Barrier is a powerful tool for traders seeking to combine trend-following with volatility management. The integration of DEMA, ATR, and a higher timeframe filter allows for a more nuanced understanding of market conditions, ensuring traders can make informed decisions with minimal lag.
This script is inspired by "viResearch" . However, it is more advanced and includes additional features and options.
-Jeffrey
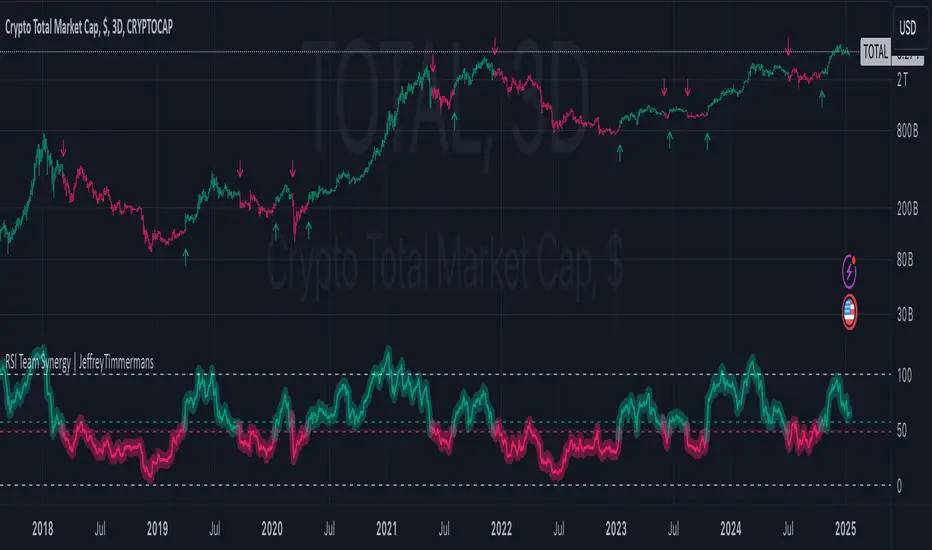
RSI Team Synergy | JeffreyTimmermansRSI Team Synergy
The "RSI Team Synergy" indicator is an advanced and highly customizable tool that integrates a Double RSI (DRSI) approach for comprehensive trend and momentum analysis. It utilizes two layers of RSI calculations, along with optional smoothing and various moving average types, to enhance signal accuracy. The dynamic visuals and alerts make this indicator a valuable resource for traders aiming to optimize their strategies.
Key Features
Double RSI (DRSI) Calculation
First RSI (Primary Layer): Captures the core price momentum using a configurable period.
Second RSI (DRSI Layer): Applies a second RSI calculation to the smoothed first RSI, refining signals and amplifying trend accuracy.
Double RSI Formula: Combines the smoothed RSI layers into a single robust indicator that adapts to market conditions.
Smoothing and Advanced Moving Averages
Optional Smoothing: Enables users to reduce noise by applying smoothing to both RSI layers.
Advanced MA Options: Supports multiple MA types, including SMA, EMA, WMA, RMA, DEMA, TEMA, VWMA, ZLEMA, and HMA. These can be applied to tailor the indicator to specific trading conditions.
Separate Configurations: Independent smoothing lengths and types for each RSI layer provide unparalleled customization.
Threshold and Signal System
Long Threshold: Highlights bullish conditions when the Double RSI exceeds the threshold.
Short Threshold: Signals bearish conditions when the Double RSI falls below the threshold.
Directional State: Tracks the overall direction using a state-based signal system (bullish, bearish, or neutral).
Dynamic Visualization
Oscillator Color Coding: Green shades for bullish momentum. Red shades for bearish momentum. Dynamic gradients for smoother transitions.
Glow Effect: Optional glowing lines enhance the visual clarity of the oscillator.
Threshold Lines: Configurable dashed horizontal lines to mark critical levels for easy reference.
Bar Color Integration
Bar Coloring: Matches bar colors to the oscillator's direction for cohesive visualization.
Advanced Control: Toggle bar coloring on/off without affecting other plots.
Alerts
Bullish Signal Alert: Triggers when the Double RSI crosses above the long threshold.
Bearish Signal Alert: Triggers when the Double RSI crosses below the short threshold.
Custom Messages: Alerts are equipped with descriptive messages for actionable insights.
Signal Arrows
Bullish Arrow (↑): Marks upward trends directly on the chart.
Bearish Arrow (↓): Highlights downward trends, ensuring traders never miss an opportunity.
Improvements
Customizable Thresholds: Adjustable long and short thresholds allow traders to fine-tune sensitivity.
Enhanced Smoothing Control: Separate smoothing options for each RSI layer provide flexibility in noise reduction.
Multiple MA Types: Extensive support for advanced moving averages to suit diverse trading preferences.
Color-Coded Oscillator: Improves trend visibility with gradient-based coloring and optional glow effects.
Signal Detection: Clear and intuitive arrows directly on the chart for quick signal interpretation.
Alerts and Notifications: Comprehensive alert conditions keep traders informed in real-time.
Use Cases
Momentum Analysis: Identify sustained bullish or bearish trends using the Double RSI calculation.
Noise Reduction: Utilize smoothing and advanced MA options to remove market noise.
Reversal Detection: Spot potential trend reversals with threshold-based signals.
Customizable Strategies: Tailor the indicator for scalping, swing trading, or long-term analysis.
The RSI Team Synergy indicator combines precision, flexibility, and intuitive design, making it an essential tool for traders at all levels. With its innovative Double RSI approach and advanced customization options, it provides actionable insights for mastering market trends.
This script is inspired by "Clokivez" . However, it is more advanced and includes additional features and options.
-Jeffrey
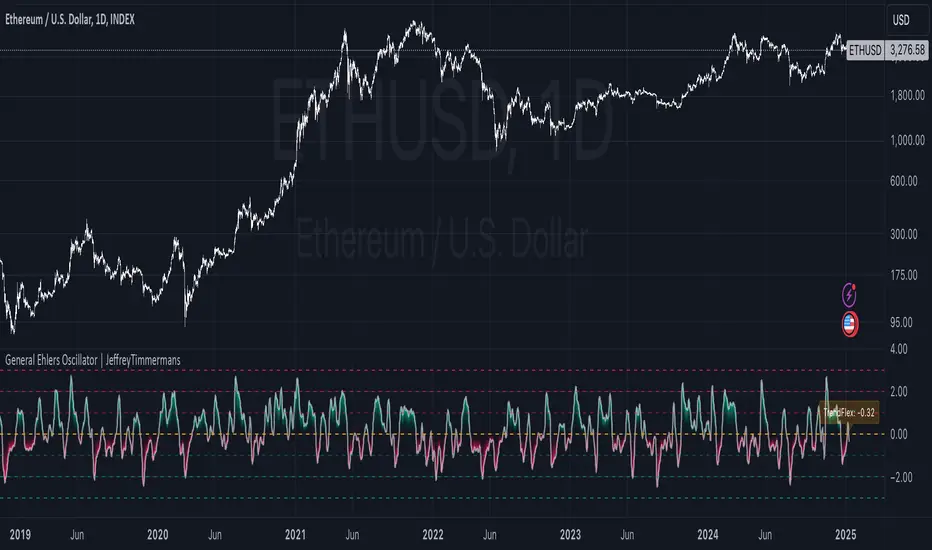
General Ehlers Oscillator | JeffreyTimmermansGeneral Ehlers Oscillator
The "General Ehlers Oscillator" is a powerful, technical indicator designed to provide traders with precise insights into market trends, reversals, and momentum. Built upon Dr. John Ehlers' innovative methodologies, this tool leverages advanced signal processing techniques to deliver near-zero lag with exceptional sensitivity to trend changes. Contact us via direct message to request access to this exclusive indicator.
Designed for multi-timeframe usability, the oscillator operates seamlessly across all intervals, from 1-second candles to monthly charts. Its outputs are normalized within a consistent range of -3.0 to +3.0, ensuring clarity and uniformity in identifying overbought, oversold, and midline conditions. With enhancements and added functionality, the General Ehlers Oscillator is a comprehensive tool for traders seeking to refine their analysis and improve trade timing.
This script is inspired by the Wizard: "ImmortalFreedom" . However, it is more advanced and includes additional features and options.
Core Methodology
The General Ehlers Oscillator employs cutting-edge techniques to enhance trend-following and reversal detection:
TrendFlex Calculation: Retains trend information while being highly responsive to reversals.
Zero-Lag Averaging: Near-zero lag processing ensures that signals are timely and reliable.
Bounded Output: Oscillator values are normalized between -3.0 and +3.0, allowing consistent interpretation across all timeframes.
Key Features
The General Ehlers Oscillator combines advanced calculations with user-friendly customization options to meet the needs of diverse trading strategies.
Adjustable Thresholds
Additional threshold levels have been introduced, offering more granular insights into overbought and oversold conditions.
Enhanced Threshold Coloring
Improved visual cues allow traders to quickly interpret the oscillator's position relative to key thresholds, making it easier to identify significant market conditions.
Dynamic Alerts
Real-time alerts provide notifications for critical events, such as midline crosses, extreme values, and reversal points, ensuring you never miss an important signal.
Dashboard Integration
The oscillator now features an integrated dashboard that displays key information at a glance. Traders can monitor critical metrics and oscillator conditions across multiple timeframes, ensuring comprehensive situational awareness.
Dynamic Label for TrendFlex
A dynamic label overlays the chart, providing immediate feedback on the oscillator’s TrendFlex readings and reinforcing its usability as a trend-confirmation and reversal tool.
Practical Applications
The General Ehlers Oscillator supports a variety of trading strategies, including:
Trend Confirmation: Use midline crossings and the slope of the oscillator to confirm ongoing trends.
Reversal Detection: Identify key turning points in the market with high sensitivity to reversals.
Mean-Reversion Strategies: Spot overbought and oversold conditions using oscillator extremes, signaling potential reversion opportunities.
Enhanced Utility
Reversal Sensitivity
The oscillator’s ability to detect reversals is enhanced by additional threshold levels and dynamic visual cues, helping traders act decisively at critical turning points.
Multi-Timeframe Consistency
With a bounded range of -3.0 to +3.0, the oscillator maintains consistent behavior across all timeframes, offering reliable insights for both intraday and long-term analysis.
Comprehensive Alerts
Set custom alerts for threshold breaches, midline crossings, and reversal signals to stay ahead of market movements.
Visual Enhancements
Improved threshold coloring and dynamic labels make interpreting market conditions faster and more intuitive, reducing analysis time and decision-making delays.
Recent Updates
The General Ehlers Oscillator has been significantly improved with the following updates:
Additional Thresholds: More thresholds have been added, providing detailed insights into varying levels of market conditions.
Enhanced Threshold Coloring: Thresholds are now color-coded with improved clarity, making it easier to identify critical zones.
Dynamic Alerts: Real-time alerts for trading, reversal points, and threshold breaches ensure timely notifications of key events.
Integrated Dashboard: The new dashboard consolidates critical information, offering a clear overview of oscillator behavior across timeframes.
Dynamic TrendFlex Label: A dynamic label overlays the chart, displaying real-time TrendFlex values and reinforcing the oscillator’s analytical capabilities.
Why Use the General Ehlers Oscillator?
The General Ehlers Oscillator combines advanced methodologies with enhanced usability, making it an indispensable tool for traders.
Advanced Signal Processing: Built on Dr. John Ehlers’ innovative techniques.
Bounded Range: Consistent performance with a normalized range of -3.0 to +3.0.
Enhanced Alerts: Stay on top of critical market events with dynamic alerts.
Visual Improvements: Clear, intuitive visuals ensure faster interpretation and decision-making.
Customizable Features: Tailor the oscillator’s behavior to suit your trading style and market conditions.
Whether you’re focused on trend-following, mean-reversion, or volatility analysis, the General Ehlers Oscillator provides the tools and insights you need to navigate complex market conditions with confidence. However, the General Ehlers Oscillator works best in trend-following regimes.
-Jeffrey
Improved Target Oscillator | JeffreyTimmermansImproved Target Oscillator
The Improved Target Oscillator is a versatile technical indicator that identifies trends, reversals, and market momentum. Designed to work effectively across various markets, this oscillator excels at capturing longer-term market trends, making it ideal for traders focused on sustained price movements. By using advanced mathematical techniques and dynamic visualization, the oscillator provides actionable insights, helping traders navigate complex market environments with confidence.
Key features include:
A dynamic oscillator line to reflect market momentum and reversals.
Clear gradient-based coloring to distinguish between bullish and bearish conditions.
Signal highlights for potential entry and exit points based on trend shifts.
This tool is particularly useful for identifying extended trends and provides a clean, intuitive interface for assessing market dynamics.
Improvements in the Improved Target Oscillator
Smoothing Feature:
Added an optional smoothing toggle, allowing the use of SMA or EMA for reducing noise.
Provides flexibility through adjustable smoothing length, enhancing clarity in choppy markets.
Alerts for Trade Opportunities:
Built-in alert conditions for bullish and bearish signals.
Allows traders to receive notifications when critical trend changes occur, ensuring they never miss an opportunity.
Customizable to integrate seamlessly into trading workflows.
Enhanced Visualization:
Introduced dynamic gradients for bullish and bearish conditions with improved customization options.
Provides clearer differentiation of momentum changes, improving interpretability.
Signal Highlights:
Improved visual cues for bullish and bearish signals with precise dot indicators.
Offers better alignment with oscillator momentum shifts, ensuring actionable insights.
Adaptability:
Tuned for use in capturing longer-term market trends, emphasizing its effectiveness in identifying sustained movements.
Adjusted oscillator sensitivity with a levels multiplier for better scalability across various market conditions.
Level Markers:
Clearer delineation of key oscillator levels, including half and full normalized levels for improved context.
A neutral line explicitly plotted for easier trend and momentum identification.
Summary
The Improved Target Oscillator combines a sophisticated mathematical foundation with practical visualization enhancements to deliver a more intuitive and precise tool for market analysis. With added flexibility, improved signals, and tailored features for longer-term trends, this oscillator is an essential resource for traders looking to refine their strategies.
-Jeffrey

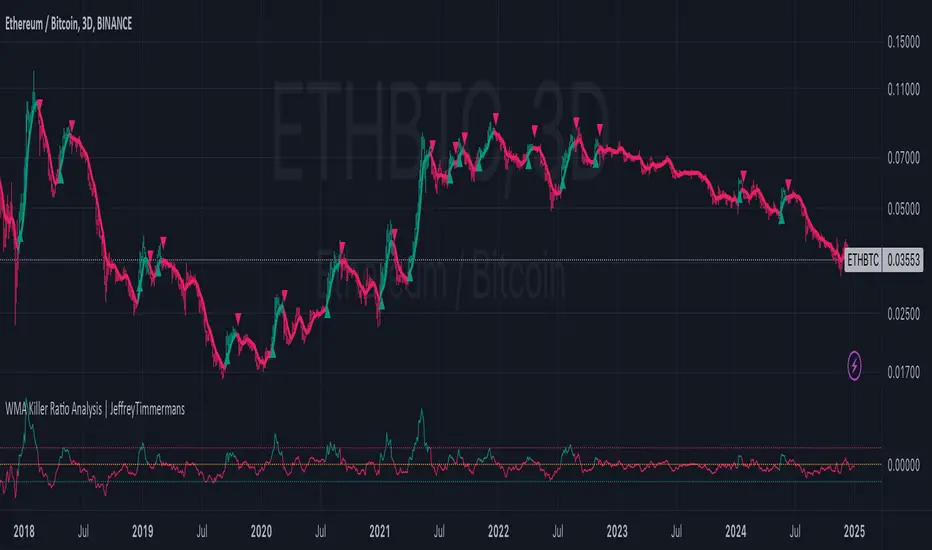
WMA Killer Ratio Analysis | JeffreyTimmermansWMA Killer Ratio Analysis
The WMA Killer Ratio Analysis is a highly responsive trend-following indicator designed to deliver quick and actionable insights on the ETHBTC ratio. By utilizing advanced smoothing methods and normalized thresholds, this tool efficiently identifies market trends. Let’s dive into the details:
Core Mechanics
1. Smoothing with Standard Deviations
The WMA Killer Ratio Analysis begins by smoothing source price data using standard deviations, which measure the typical variance in price movements. This creates dynamic deviation levels:
Upper Deviation: Marks the high boundary, indicating potential overbought conditions.
Lower Deviation: Marks the low boundary, signaling potential oversold conditions.
These levels are integrated with the Weighted Moving Average (WMA), filtering out market noise and honing in on significant price shifts.
2. Weighted WMA Bands
The WMA is further refined with dynamic weighting:
Upper Weight: Expands the WMA, creating an Upper Band to capture extreme price highs.
Lower Weight: Compresses the WMA, forming a Lower Band to reflect price lows.
This adaptive dual-weighting system highlights potential areas for trend reversals or continuations with precision.
3. Normalized WMA (NWMA) Analysis
The Normalized WMA adds a deeper layer of trend evaluation: It calculates the percentage change between the source price and its smoothed average. Positive NWMA values suggest overbought conditions, while negative NWMA values point to oversold conditions.
Traders can customize long (buy) and short (sell) thresholds to align signal sensitivity with their strategy and market conditions.
Signal Logic
Buy (Long) Signals: Triggered when the price remains above the lower deviation level and the NWMA crosses above the long threshold. Indicates a bullish trend and potential upward momentum.
Sell (Short) Signals: Triggered when the price dips below the upper deviation level and the NWMA falls beneath the short threshold. Suggests bearish momentum and a potential downward trend.
Note: The WMA Killer Ratio Analysis is most effective when paired with other forms of analysis, such as volume, higher time-frame trends, or fundamental data.
Visual Enhancements
The WMA Killer Ratio Analysis emphasizes usability with clear and dynamic plotting features:
1. Color-Coded Trend Indicators: The indicator changes color dynamically to represent trend direction. Users can customize colors to suit specific trading pairs (e.g., ETHBTC, SOLBTC).
2. Threshold Markers: Dashed horizontal lines represent long and short thresholds, giving traders a visual reference for signal levels.
3. Deviation Bands with Fill Areas: Upper and Lower Bands are plotted around the WMA. Shaded regions highlight deviation zones, making trend boundaries easier to spot.
4. Signal Arrows and Bar Coloring: Arrows or triangles appear on the chart to mark potential buy (upward) or sell (downward) points. Candlesticks are color-coded based on the prevailing trend, allowing traders to interpret the market direction at a glance.
Customization Options
Adjustable Thresholds: Tailor the sensitivity of long and short signals to your strategy.
Dynamic Weighting: Modify upper and lower band weights to adapt the WMA to varying market conditions.
Source Selection: Choose the preferred input for price data smoothing, such as closing price or an average (hl2).
The WMA Killer Ratio Analysis combines rigorous mathematical analysis with intuitive visual features, providing traders with a reliable way to identify trends and make data-driven decisions. While it excels at detecting key market shifts, its effectiveness increases when integrated into a broader trading strategy.
-Jeffrey