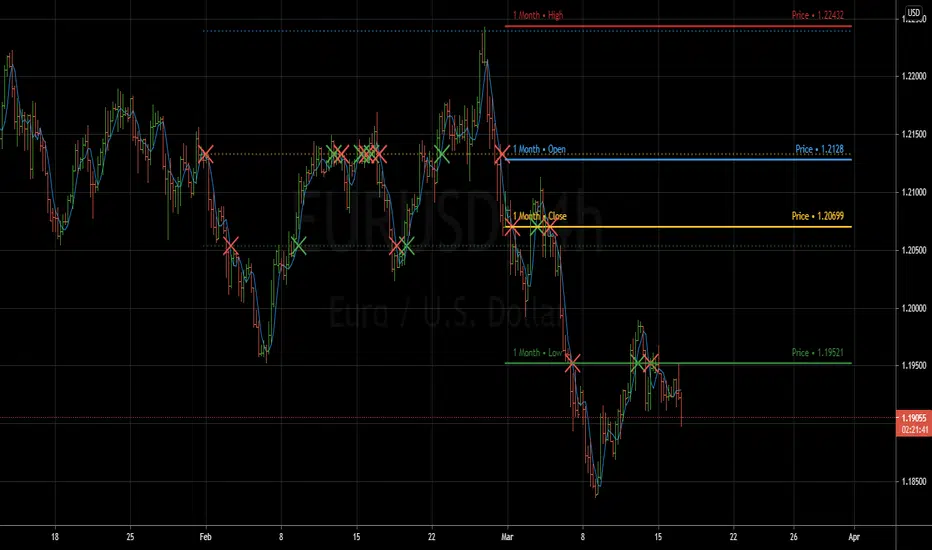
Previous Period Levels - X Alerts====== ABOUT THIS INDICATOR
- A simple but highly customisable display of previous higher time-frame
OHLC values, drawn using line.new and label.new. Nothing fancy but...
- Customised resolution input which excludes time frames lower than 1 hour
while extending the common higher reference inputs to include:
• 6, and 12 Hour
• 5 Day
• 3, and 6 Month
• 1 Year
- Alert conditions using an adjustable SMA to help reduce false positive
spam.
- Full visual customisation options for (almost) every aspect, so it can be
tuned to suit most individual preferences.
- In line with the miriad visual customisation options is the ability to
change the display format of the Labels, to show more or less information,
or disable them altogether.
====== REASON FOR STUDY
- To practice advanced user input option handling to allow for a full visual
customisation experience without stepping outside of, or interfering with,
the intended function of the indicator.
- Provide reasonably clear code commenting and structure in order to be
useful as a potential learning aid for others, and future reference for
myself.
====== DISCLAIMER
Any trade decisions you make are entirely your own responsibility.
I've made an effort to squash all the bugs, but you never know!
Timeframe
MTF Ichimoku Signal [Takazudo]A multi timeframe Ichimoku Signal indicator. This indicator shows the status of each Ichimoku Signals.
1. TK-Cross
Tenkan-Sen & Kijun-Sen cross status
2. Future Kumo
The newest Kumo color
3. Kumo & Current Relation
The relation between current price & Kumo.
4. Kumo & Chikou-Span Relation
The relation between Kumo & Chikou-Span.
5. Chikou-Span & Candle Cross
Chikou-Span & Candle cross status

Multi Timeframe Moving Average [xdecow]This indicator plots a moving average of 4 different timeframes.
The types of averages available are: SMA, EMA, DEMA, VWMA, RMA, WMA.

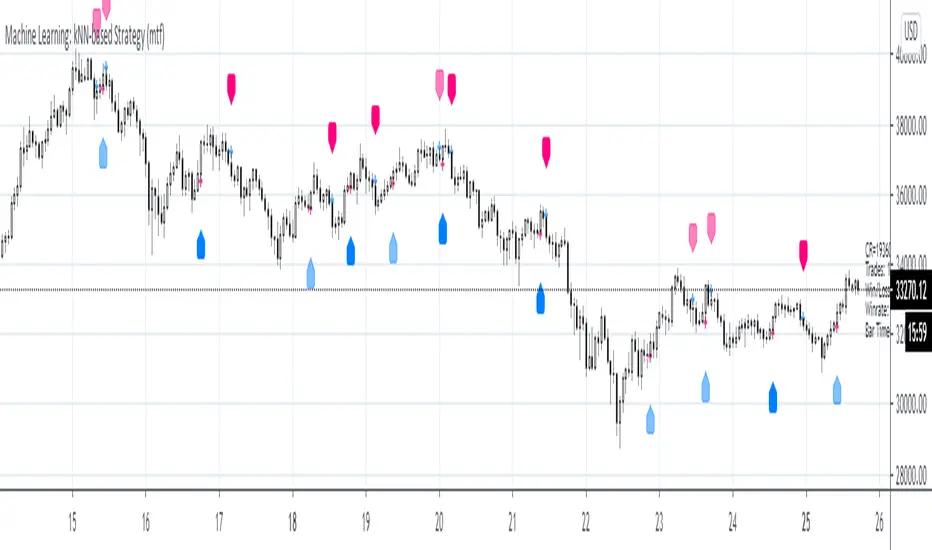
Machine Learning: kNN-based Strategy (mtf)This is a multi-timeframe version of the kNN-based strategy.

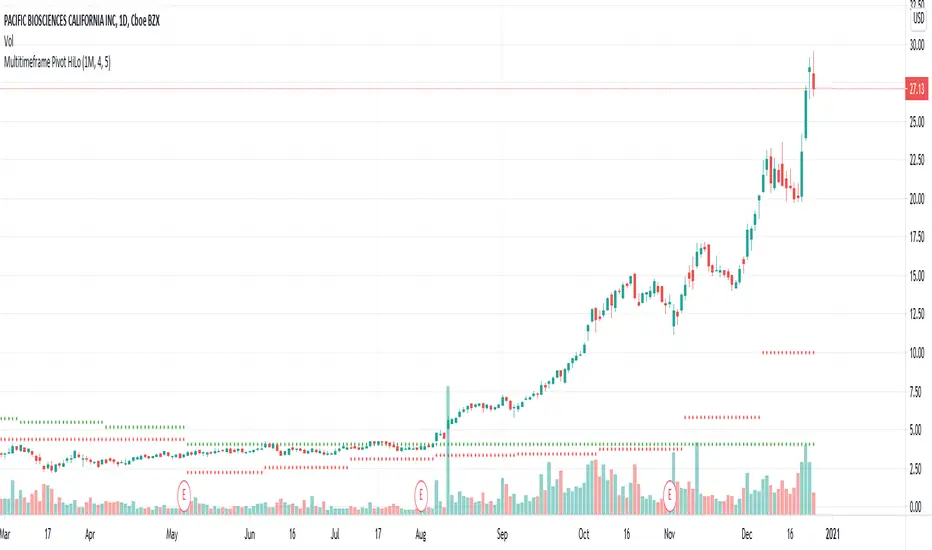
Multitimeframe Pivot HiLoPivot High/Low for multi timeframes.
Could be great entry filter to include multi time frame pivots in trend trading strategies.
Cosmic Multi-timeframe ChannelsThis script creates 3 channels out of common moving average plots, 1 in the user-specified timeframe (densely-colored) and 2 in higher multiples of the user-specified timeframe (progressively weaker-colored).
In this instance, the user-specified timeframe is 1D and shows the 1D channel. As the higher timeframe multiples are by default set to 3 and 9, they show the channels for 3D and 9D timeframes.

Triple RSIThis idea behind this indicator was to show an un cluttered view of the RSI on 3 different timeframes. The RSI for the current chart highlights Lime/Red when it crosses the Overbought and Oversold levels, which are editable in the Inputs tab. RSI 2 defaults to the 1h timeframe and prints a lime dot at the top of the indicator when it's above the 50 level and a Red Dot at the bottom of the indicator when it's below the 50 level. It can also be viewed as a plot line that changes color when it's above or below the 50 level. RSI 3 defaults to the 4h timeframe and prints a blue square at the top of the indicator when it's above the 50 level and an orange square at the bottom of the indicator when it's below the 50 level. It also can be viewed as a plot line that changes color when it's above or below the 50 level.
I've added the indicator multiple times to show a few of the different viewing options, with the default settings at the very bottom.

Asif Multi VwapMulti Time frame Vwap in One Script to identify Trend & identify supports & resistance.
Thanks

Renko MTF - Traditional and ATRSomehow there aren't too many renko bars that have the traditional setting built-in so I put one up. This one has the option to choose between Traditional and ATR, the size number corresponds to the option that was chosen. And just in case if anyone wanted, I put up a multi-time frame option to choose the time frame the bars take place. D is for day, W is for week, flat numbers are in minutes, and leaving it blank looks at the current time frame the chart is in. The calculation comes from how Tradingview handles renko bars.
Renko bars don't paint a color unless the market moves a certain amount based on its settings. When the market moves up it turns green, if it moves down it turns red, simple color changes alone can say a lot. They're a good way to try to find trends somewhat objectively and seem to be a good way to eliminate time and can replace other time-based indicators that can whipsaw or lag. The bars have a tendency to repeat themselves so it's a good way to find trends. There aren't too many settings for the box size, most people either just choose 5, 10, 14, etc where as other indicators have many options that differ on different markets. The numbers can be chosen easily enough to pick a sweet spot with just a single input where other indicators such as MACD have multiple inputs to pick the right number that can make it difficult to choose from(although it won't be as precise as a MACD would sometimes but can be worth the objectiveness and consistency and same setting repeatability in different markets in my opinion). Some example strategies could be to use them as an alternative trailing stop, finding trends, a simple color change for entry and exit on top of other strategies, etc. It can do the job of many in an all in one price action type indicator(although not better all the time, it can come close enough). Despite all this, it does seem to depend on which time-frame it's being looked at, how TV does the calculation for it, and how one can use this with the lack of practical information on it out there.

Multiple EMAs - Variable lengthsA simple cluster of EMAs that will switch the lengths based on intraday or not.
The fast, medium and slow periods will switch to set values as per input.
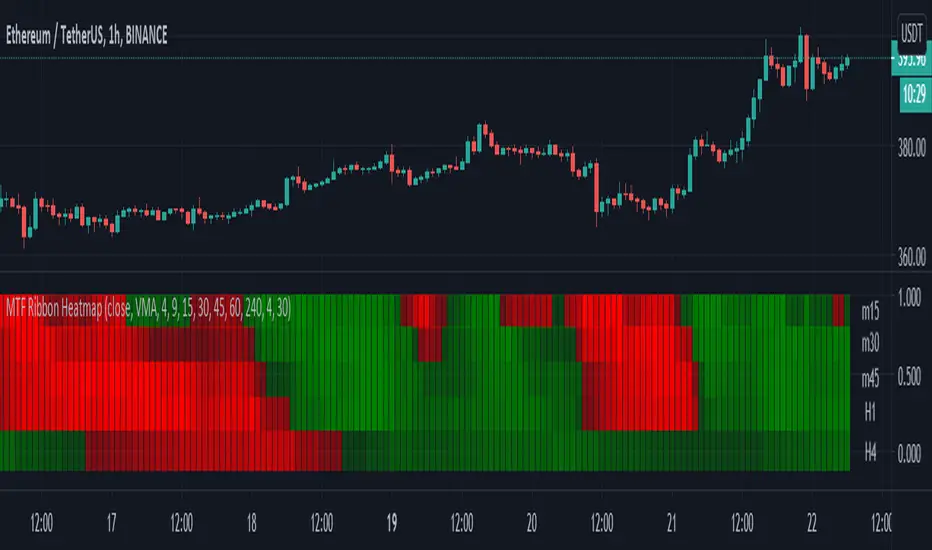
Moving Averages - 5 Ribbon MTF HeatmapThis is a 5 Ribbon heatmap moving averages indicator where each represents a different time frame, The RED or GREEN color palette is also affected by asset velocity using ATR.
Supports various moving averages including VMA (Default), Zero Lag, TSF (Time Series Forecast).
A single ribbon is set to GREEN when fast MA (moving average) is above the slower MA and RED when fast MA is below the slower MA.
In the settings you can set the ATR length (Average True Range) which will affect the velocity calculation for the colors, higher ATR length will smooth the coloring more (Less color changes), while lower ATR will show more instant changes.
HOW TO USE?
The brighter the GREEN is the stronger the up trend.
The brighter the RED is the stronger the down trend.
A weakening GREEN color can be a sign for a down reversal.
A weakening RED color can be a sign for a up reversal .
Supports alerts when fast moving average crosses slow moving average from all time frames, either way, up or down.
Comments/Suggested/Positive feedbacks are welcome and can make this indicator even better.
Follow for upcoming indicators: www.tradingview.com
MTF VWAP + Fibo Incremental deviationsI made a Fibo variant of my first script "VWAPs + devs" :
This new indicator give you the possibility to plot multi timeframes VWAP (D, W, M, 3M and 12M ) and Fibo deviations for each one.
VWAP is a powerfull indicator which is used by big players to get informations if the price is "overbought" or "oversold". Deviations give the opportunity to have supports and resistances in those "over"-zones.
I searched for better results and found those defaults values :
Fib 1 level : 0.618
Fib 2 level : 0.786
Fib 3 level : 1.000
Fib 4 level : 1.618
Fib 5 level : 2.618
In the thumbnail, we can see that the 1.618 deviation level made a great support on the last uptrend for BTCUSDT .
You can change each values but low ones as 0.382 and 0.5 don't give really interesting supports/resistances.
I made this script as clear and simple as possible with only one menu in the parameters.
Some examples of what you can do :
BTCUSDT (Binance) H4 / D, W, M, 3M ,12M VWAP without devs
BTCUSDT (Binance) M5 / Daily VWAP + Fibo devs
Hope this will be useful for you !

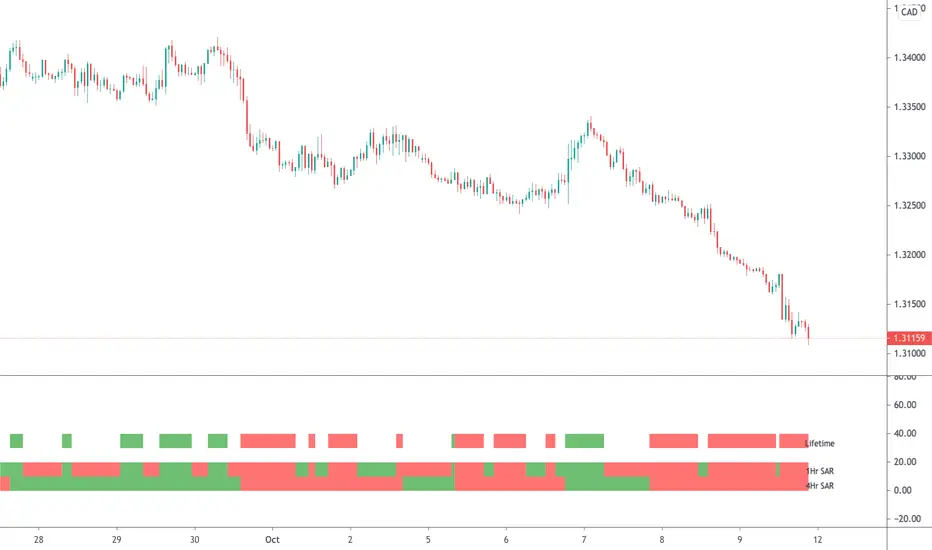
Parabolic SAR (MTF)This is a multi-timeframe Parabolic SAR indicator which uses 1 and 4 hour charts.
Using this indicator is simple, if the LifeTime line is green then buy, if red then sell OR don't trade. So...
Green Line - This strategy is in a buy position
Red Line - This strategy is in a sell position
Any other colour - DON'T TRADE
The traders approach is simple, when all indicators are green or red, then take the trade. As soon as one indicator changes, then re-evaluate using your normal process, such as price action, to determine whether to close the trade or continue.
If you require any further information or script modifications, please message me.
PLEASE CHECK OUT MY OTHER SCRIPTS
Supertrend (MTF) & Parabolic SAROne of my mixed approach strategy indicators which includes:
- Parabolic SAR
- 1 Hour Supertrend
- 4 Hour Supertrend
Whilst this script may appear slow due to the 4hr Supertrend, it does a great job of managing breakouts.
Using this indicator is simple, if the line labeled Lifetime is green then buy, if red then sell OR don't trade. So...
Green Line - This strategy is in a buy position
Red Line - This strategy is in a sell position
Any other Color - DON'T TRADE
The traders approach is simple, when all indicators are green or red, then take the trade. As soon as one indicator changes, then re-evaluate using your normal process, such as price action, to determine whether to close the trade or continue.
If you require any further information or script modifications, please message me.
PLEASE CHECK OUT MY OTHER SCRIPTS

Multi Time Frame CandlesHello Traders,
This script can show (upto) 3 candles of another time frames without changing chart time frame realtime . You can choose the time frame and number of candles in the options. You have option to change body and wick colors as well.
in this example number of candles is 2:
You can set body and wick colors:
In this example, weekly candles are shown on 1h chart:
Enjoy!

London Open Range Breakout by KviateqThis script is what I currently use to day trade forex on a 5-minute timeframe.
The script features Multi-timeframe EMA20 that uses timeframe multipliers and is smoother by the factor by which you're multiplying your current timeframe.
Default settings are set to display EMA20 on the current (M5) timeframe, as well as M15, H1, H4 and D1 timeframes.
The background color changes intensity based on how many conditions are met - are all EMAs in the right order, is the current close above/below all the EMAs.
Featured is also a range set to 1 hour since the London breakout (can be changed to M15, or however long you'd like - my current setting is 30 minute).
Also featured are levels that I find to be of most importance - such as Daily and Weekly Open, Previous Day's and Week's Highs.
The idea is to only take trades when all stars align - EMAs, break above/below the Opening Range and not to long/short into an important level.

KK_MA_MTFThis is multitimeframe Hull moving average
you can change offset to 0 if you want realtime data

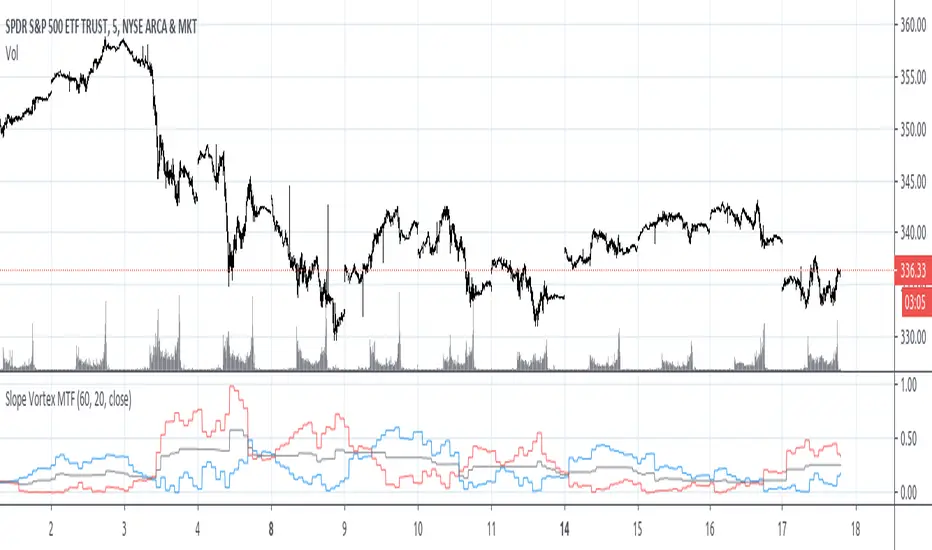
Slope Vortex MTFA request was made to make this script into a mult-time frame version. :)
I'm not fond of the outcome using a really high time frame like the 1 Day when you're looking at a 5 minute intraday chart, but I think it looks pretty decent on something like a 5 min chart with 1 hour higher time frame.
Please checkout the original Slope Vortex script for more information on how it can potentially be used as a trading signal.
Higher Timeframe Trend Indicator V3.0What is it?
An indicator that depicts the trend of up to 5 higher timeframes on the same chart without needing to context-switch between charts.
Features
- Supports up to 5 timeframes
- Trends indicated by 5 colored buttons: one for each timeframe
- Varying shades of green: uptrend
- Varying shades of red: downtrend
- White/silver: sideways/neutral
- Configurable length (time period) for each timeframe
- Increase length to capture long term trends; decrease it to capture only short term ones
- Configurable sensitivity for each timeframe
- Sensitivity determines what angle is considered trending and what is not
- Increase sensitivity to capture weak trends
- Decrease sensitivity to filter out weak trends and capture only strong/steep ones
- Sensitivity ranges from 1 (least sensitive) to 3 (most sensitive)
- Move the labels around vertically for better visibility by changing the "Location" and "Offset" parameters
How should one use it?
Use it to quickly browse through charts to understand the context across timeframes, and zero in on only those that have trends aligning on the higher and lower timeframes as per your strategy. For e.g., a chart that is trending up strongly on the 15min and 60min (indicated by dark green colored buttons), and trending down on the 1 and/or 5 min (indicated by red-colored buttons), can be shortlisted for a potential pullback trade. Use your favorite pullback strategy (Supply/Demand, Support/Resistance, Moving Averages, etc.) to hop in on the trend.
How are trends determined?
The indicator uses normalized %change in price of the linear regression line segment of the chosen price sources (close, high, low, MA, etc.) over a specified length to determine trend direction and intensity
Known Issues
Will indicate the trend correctly only for timeframes *higher* than the current (visible) resolution/timeframe of the chart. Might not indicate it correctly for lower timeframes ( i.e., lower than the current (visible) resolution/timeframe of the chart). For this reason, all timeframes lower than the current resolution will be hidden in the present release.
Future releases
- I am still experimenting with various sensitivity levels and the corresponding trend shades to make the tool as accurate and intuitive as possible. These modifications might come in
- Sensitivity levels might be increased.
- Bug fixes, if any

[CP]3 RSI Multi Timeframe InceptionTriple RSI indicator where you can set the timeframe for each RSI.
Take confirmation from different timeframes to make high probability trades!
Typical settings would be,
1 Day, 1 Week, 1 Month or
1 hr, 4hr, 1 Day or
3 min, 15 min, 1 hr or.........your imagination is the only limit here!

Efficient Support & Resistance LevelsThis script is a mixture of my two previous scripts "True Strong Classical Support/Resistance Levels" and "Hidden Supports & Resistances + Round Levels". This combination brings on better identification of the most efficient support/resistance levels.
Note that "Hidden SnR Levels" part of the code is only expected to work on Forex charts, but apart from that, the other parts could be applied to any chart.
The script may:
- Draw classical support/resistance levels which retraced the price previously, aided by multi-timeframe analysis
- Draw hidden support/resistance levels based on psychological patterns of the price
- Adjust to wicks better than Pine Script built-in pivot functions
- Differ the levels color based on chart reactions
- Merge nearby classical levels to avoid congestion on the chart
Feel free to use it and send me your thoughts.

A Deeper Look Into Security Function & Possible ImprovementsThere is a link below that further explain the purpose of this publication.
A fresh new look into the limitations of the security() function and perhaps expand our horizons on having access to more accurate data no matter from what timeframe you are on.
docs.google.com
As always, it is my desire to help the community to continue reaching new highs.
