Point and Figure (PnF) ChartThis is live and non-repainting Point and Figure Charting tool. The tool has it’s own P&F engine and not using integrated function of Trading View.
Point and Figure method is over 150 years old. It consist of columns that represent filtered price movements. Time is not a factor on P&F chart but as you can see with this script P&F chart created on time chart.
P&F chart provide several advantages, some of them are filtering insignificant price movements and noise, focusing on important price movements and making support/resistance levels much easier to identify.
If you are new to Point & Figure Chart then you better get some information about it before using this tool. There are very good web sites and books. Please PM me if you need help about resources.
Options in the Script
Box size is one of the most important part of Point and Figure Charting. Chart price movement sensitivity is determined by the Point and Figure scale. Large box sizes see little movement across a specific price region, small box sizes see greater price movement on P&F chart. There are four different box scaling with this tool: Traditional, Percentage, Dynamic (ATR), or User-Defined
4 different methods for Box size can be used in this tool.
User Defined: The box size is set by user. A larger box size will result in more filtered price movements and fewer reversals. A smaller box size will result in less filtered price movements and more reversals.
ATR: Box size is dynamically calculated by using ATR, default period is 20.
Percentage: uses box sizes that are a fixed percentage of the stock's price. If percentage is 1 and stock’s price is $100 then box size will be $1
Traditional: uses a predefined table of price ranges to determine what the box size should be.
Price Range Box Size
Under 0.25 0.0625
0.25 to 1.00 0.125
1.00 to 5.00 0.25
5.00 to 20.00 0.50
20.00 to 100 1.0
100 to 200 2.0
200 to 500 4.0
500 to 1000 5.0
1000 to 25000 50.0
25000 and up 500.0
Default value is “ATR”, you may use one of these scaling method that suits your trading strategy.
If ATR or Percentage is chosen then there is rounding algorithm according to mintick value of the security. For example if mintick value is 0.001 and box size (ATR/Percentage) is 0.00124 then box size becomes 0.001.
And also while using dynamic box size (ATR or Percentage), box size changes only when closing price changed.
Reversal : It is the number of boxes required to change from a column of Xs to a column of Os or from a column of Os to a column of Xs. Default value is 3 (most used). For example if you choose reversal = 2 then you get the chart similar to Renko chart.
Source: Closing price or High-Low prices can be chosen as data source for P&F charting.
Chart Style: There are 3 options for chart style: “Candle”, “Area” or “Don’t show”.
As Area:
As Candle:
X/O Column Style: it can show all columns from opening price or only last Xs/Os.
Color Theme: different themes exist => Green/Red, Yellow/Blue, White/Yellow, Orange/Blue, Lime/Red, Blue/Red
Show Breakouts is the option to show Breakouts
This tool detects & shows following Breakouts:
Triple Top/Bottom,
Triple Top Ascending,
Triple Bottom Descending,
Simple Buy/Sell (Double Top/Bottom),
Simple Buy With Rising Bottom,
Simple Sell With Declining Top
Catapult bullish/bearish
Show Horizontal Count Targets: Finds the congestion or consolidation pattern and if there is breakout then it calculates the Target by using Horizontal Count method (based on the width of congestion pattern). It shows how many column exist on congestion area. There is no guarantee that prices will reach the target.
Show Vertical Count Targets: When Triple Top/Bottom Breakouts occured the script calculates the target by using Vertical Count Method (based on the length of the column). There is no guarantee that prices will reach the target.
For both methods there is auto target cancellation if price goes below congestion bottom or above congestion top.
trend is calculated by EMA of closing price of the P&F
Whipsaw protection:
Last options are “Show info panel” and Labeling Offset. Script shows current box size, reversal, and recommanded minimum and maximum box size. And also it shows the price level to reverse the column (Xs <-> Os) and the price level to add at least 1 more box to column. This is the option to put these labels 10, 20, 30, 50 or 100 bars away from the last bar. Labeling content and color change according to X/O column.
do not hesitate to comment.
Target

Efficient Trend Step ChannelIntroduction
The efficient trend-step indicator is a trend indicator that make use of the efficiency ratio in order to adapt to the market trend strength, this indicator originally aimed to remain static during ranging states while fitting the price only when large variations occur. The trend step indicator family unlike most moving averages has a boxy appearance and could therefore not be classified as smooth, this makes it an indicator relatively uninteresting to use as input for other non-trending indicators such as oscillators.
Today a channel indicator making use of the efficient trend-step is proposed, the indicator has an upper and a lower extremity who can be used for breakout or support and resistance methodologies, however we will see that the indicator is sometimes able to return accurate support and resistance levels.
The Indicator
The indicator has the same settings has the efficient trend step indicator, length control the period of the efficiency ratio, fast control the period of the rolling standard deviation used for trending states, slow control the period of the rolling standard deviation used for ranging states, fast should be lower than slow , if both are equal then the indicator is equal to the classical trend step indicator and length does no longer affect the indicator output. Lower values of fast/slow will make the indicator more reactive to small variations thus changing direction more often.
The color changes you can see on the indicator are changed depending on the prior direction took by the indicator output, if the indicator where higher than its precedent value, then the color will be blue until the indicator is lower than its precedent value. Those colors help you have an estimate of the current trend direction.
Channel Calculation And Role
The extremities made from the efficient trend step allow for more advanced trading rules, they can act as stop/target level and can also give a rough estimate of the current market volatility, with wider extremities indicating a more volatile market.
The extremities are made directly from the dev element used by the efficient trend-step, the upper extremity is made by summing the efficient trend step with the value of dev when the efficient trend step change, the lower extremity is made the same way but the value is subtracted instead.
Is it a weird choice ? It sure is strange to see such approach, the absolute rolling average error between the price and the efficient trend step could have been a logical measure but using dev instead is more efficient and also allow for a more adaptive approach which can benefit the support and resistance methodology, the last reason is because i didn't wanted to "denature" the trend-step signature of the indicator.
The figure above represent the measurement used for making the extremities (in green).
Since the previously described measure change only when the efficient trend step change, we can conclude that such measure is representative of a relatively large variation, since the efficient trend step aim to only change when a large variations appear.
We can see that the upper extremity acted as an accurate resistance in this upper variation of AMD,
Here as well, however like other bands indicators it is safer to take into account the current trend direction, a strong uptrend will have less difficulties crossing the upper extremity, therefore it might be better to rely on the support (lower extremity) on an up-trending market (indicator in blue), and on the resistance (upper extremity) on an down-trending market (indicator in orange).
The figure above show support and resistances signals, a cross represent a false signal, while green arrows represent correct ones with their respective direction.
Conclusion
The presented indicator add more possibilities to the interpretation of the efficient trend step, the extremities can act as stop/target level, however this use has to be controlled, and the level should be in accordance to your risk/reward ratio.
Showcasing another trend-step indicator was a real pleasure. Thanks for reading :)

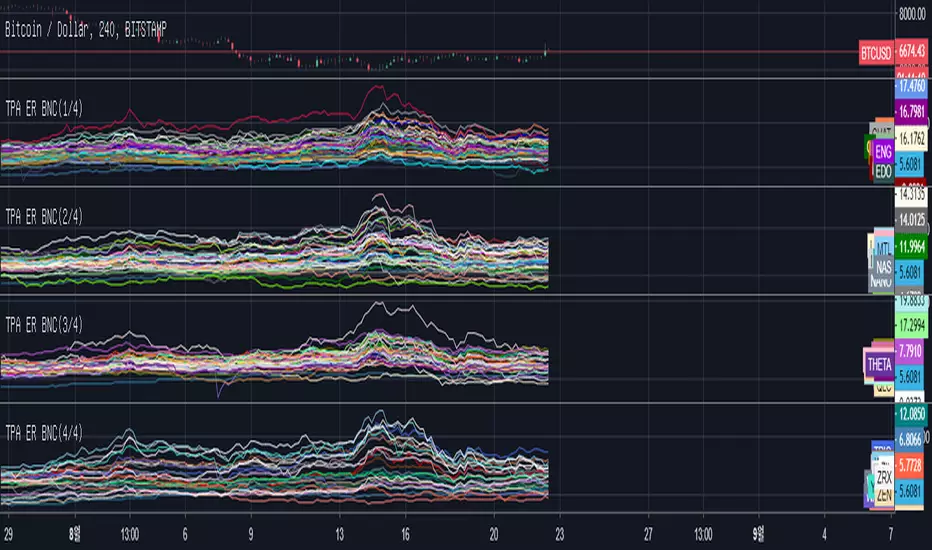
TPA Expected Return Binance(1/4)This indicator measures the moving average line as a resistor at the time of transition and indicates the expected return rate at that location when it reaches the plane line at the top.
The expected return rate for different categories is easy to obtain as a percentage, which helps to select trade items.
The length of the moving average line can be selected through the setting "LENTH".
All of the "BINANCE" stock items are listed on the index in English order.
Usually, using a setting of 4H - 240 gives good results.
이 지표는 장전환시 이동평균선을 저항선 으로 보고 상단에 존재하는 이평선까지 도달했을때 그 위치에서의 기대수익률을 나타냅니다.
여러 종목들의 기대수익률을 퍼센트로 구하기 쉬워지므로 매매종목 선정에 도움이 됩니다.
설정의 "LENTH"를 통해서 이동평균선의 길이를 선택 할 수 있습니다.
"BINANCE"의 전 종목들은 영문 순서대로 지표상 나열됩니다.
통상 4H - 240의 세팅을 사용하면 좋은 결과를 얻습니다.
MinhTarget Buy-Sell MinhTarget Buy-Sell has 2 option to buy-sell depends color of line or depends bar crosses with line ; so pls select on/off and see result.
Thank you!

Fibonacci Algo - LongAutomatic Fibonacci retracement entry, stop loss and extension target level as apart of a customisable strategy.
Automatic plots of 23.6% 38.2%, 50%, 61.8%, 65%, 78.6% and -23.6, -61.8% and -100% levels.
Customisable Fib Length - Time period over which max and min pivots are chosen.
Customisable Offsetfib - Offsets the pivots and sell zone as your entry position
will be some time after the upper and lower pivots are set.
Vegas Wave - Automatic plot. Shows price relative to wave and EMA crossover - See my 'Vegas Wave' code for more of an explanation.
A strategy based off buying the 50-618 with a defined stop loss the other side of the 65 or 786 can easily be formulated.
This tool will automatically plot those points but a defined Risk Management strategy will always be needed.
The 236 and 382 region can also be plotted, allowing for lesser retracements coinciding with wave 4 pullbacks ( Elliott Wave Traders).
Works best in Bullish trends but will work on all timeframes (Bullish correction in an downtrend also possible).
Previous pivots shown but be careful to identify which of the several pivots you are using.
Start at a larger timeframe and move down. (Entries consistent on several timeframes are golden)
Pivots and retracements are dynamic. Be sure to note your entry and targets.
Works well when used in combination with an oscillator which highlights Divergence.
Also refer to my other 'Fibonacci' Codes for more context.

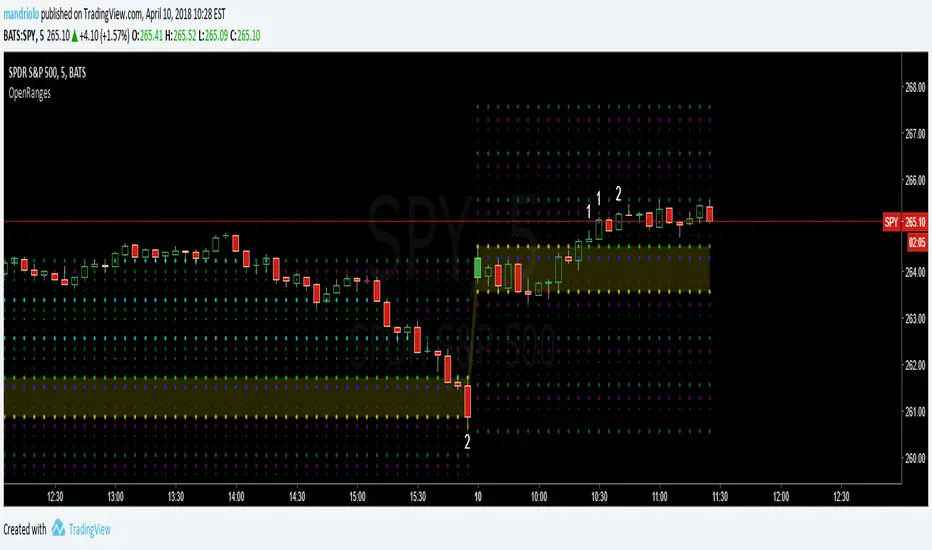
Opening-RangesThis indicator will give you expansion levels of the opening range ( I recommend/use 15 min opening range) to trade futures and stocks. There are two colors used, the Fuchsia(Magenta) colored dots are the opening range added and subtracted from opening price. The Aqua(Cyan) colored dots are the opening range stacked. Like blocks. They are both respected during the day. But not as much as longer time frame fib levels.