Take profit and Stop Loss ATR HL [Tcs] | ALGOThis indicator helps traders set stop loss and take profit levels based on either ATR or High-Low range.
The indicator calculates stop loss and take profit levels for both long and short positions, based on the user's input of ATR length, ATR smoothing method, and multiplier levels for each level. It’s possible to set 3 levels of take profit, for both long and short trades.
The indicator also includes the option to show or hide levels, bands, and labels for the calculated stop loss and take profit levels.
Additionally, the indicator has a function to calculate the user's risk based on their account balance, risk percentage, and broker fees.
Overall, this indicator can be helpful for traders who use stop loss and take profit levels in their trading strategies and want a visual representation of those levels on their charts.
Please note that this indicator is for educational purposes only and should not be used for trading without further testing and analysis.
Takeprofit

Cyatophilum SmartStrategy MakerThis indicator allows you to use any other indicator from the TradingView library and create complex entry and exit conditions with ease thanks to several external inputs. Add risk management to your strategy and backtest it before creating alerts!
Key Features:
1 — Entry Conditions: Traders can define their entry conditions using up to three sources. They can choose from several options such as "Cross," "Crossover," "Crossunder," "Above," "Below," or "Equal" for comparing the selected sources.
2 — Entry Gates: Users can set logical gates (e.g., "AND," "OR," "XOR," "NAND," "XNOR") to combine multiple entry conditions.
3 — Exit Conditions: Similar to entry conditions, traders can define exit conditions based on two sources and select from various comparison options.
4 — Stop Loss: The indicator allows users to enable or disable a stop-loss feature. The stop-loss value is calculated based on a percentage of the base order price.
5 — Take Profit: Traders can set multiple take-profit levels by specifying the number of take profits, a base percentage, and a step value. Take profits can be defined as a percentage from the total volume or the base order.
6 — Safety Orders (DCA): The indicator supports the use of safety orders (Dollar Cost Averaging) to help manage risks. Users can set the number of safety orders, price deviation, step scale, and volume scale.
7 — Backtest Settings: Traders can define the start and end periods for backtesting their strategy. This feature allows them to analyze the performance of their strategy within specific timeframes.
8 — Alerts: The indicator provides the option to create alerts for entry, exit, stop loss, take profit, and safety orders. Users can customize the alert messages using placeholders for dynamic values like price, symbol, and order size.

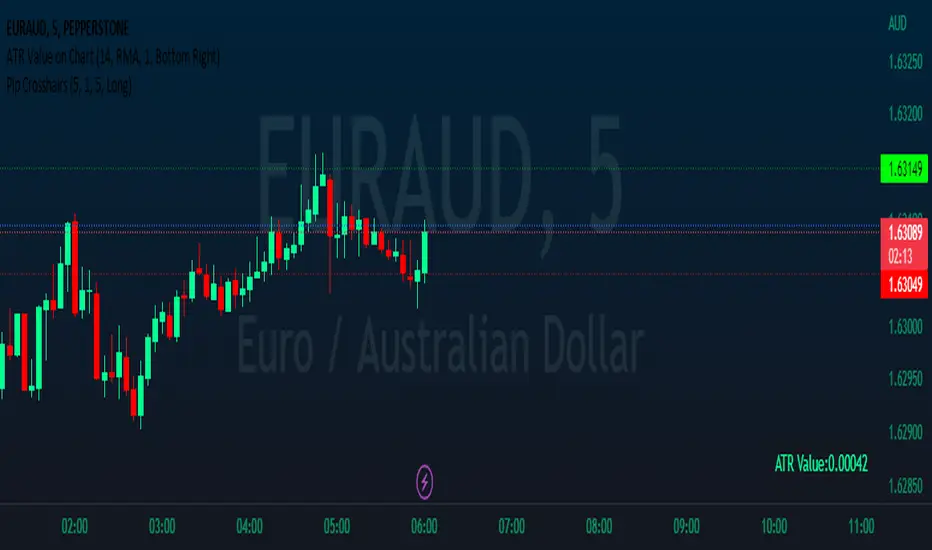
Pip CrosshairsThis is a simple tool designed to help you visualize your stop loss and take profit levels before entering a trade. The tool plots two lines on the chart - a green dotted line for take profit and a red dotted line for stop loss (similar to the price line) - with a simulated default spread of one pip factored in. The indicator has the option to toggle between long and short positions.
Please note that the spread used in the tool is not based on your actual spread and should be adjusted accordingly. As, to the best of my knowledge Pine Script does not have the ability to automatically include spread in an indicator, so you will need to input your spread manually. (if you can please let me know cause that would be a game changer).
Overall, should help save you a bit of time by not having to manually measure stop loss and take profit levels for each trade.
Happy hunting :)
Lorentzian ML [Sublime Traders]Lorentzian ML
Context: The whole idea of this indicator is to use the Lorentzian Classifier (a popular machine learning model suited for analyzing data in a time series) , add some oscillators and filter them with volume averages in order to get precise swing move indications.
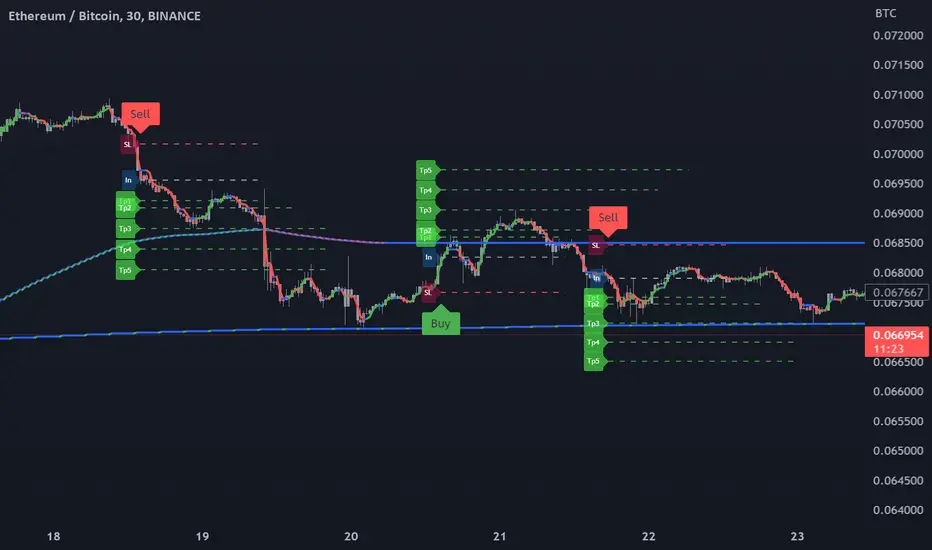
The Lorentzian ML indicator uses the Lorenzian Classifier (LDC) algorithm that takes into account the Commodity Channel Index (CCI) and Relative Strength Index (RSI) signals as raw material to provide buy and sell signals. The indicator is accompanied by take profit , stop loss and entry lines based on the Average True Range (ATR).
Features:
1. Lorentzian Classifier:
Uses the difference between the current and previous values of CCI and RSI to generate buy and sell signals.
The classifier threshold can be adjusted using the input parameter.
2. ATR-based Take Profit Line:
A horizontal take profit line is plotted when buy or sell signals occur.
The line is based on the ATR value and a user-defined multiplier.
3. VMA filtering
Using the simple switches: Scalper, Swing or Holder , the users can easily filter the frequency of the signals in addition to the lookback and threshold filters. This will affect the used VMA lines that use data gathered from multiple timeframes.
Visual Representation:
The indicator plots green candles for buy signals and red candles for sell signals.
Buy and sell labels are displayed on the chart to mark the points where signals occur.
The ATR-based take profit line is displayed in a user-defined color and line width.
Visual representation of the VMA lines : Red - bearish , Blue - uncertain , Green - bullish
Changes and features to come
Fix "holder" switch on sell side that sometimes bugs the whole chart.
Add more intuitive filtering methods.
Add two more oscillators to the Lorentzian pool.
Create switches for Lorentzian source.
Scaled Order Sizing and Take Profit Target ArraysWOAH Order Scaling!
This Provides a user with methods to create a list of profit targets and order sizes which grow or shrink. For size, the will add up to specific sum. for Targets they will include the first and last, and can lean towards either, to scale the order grid.
And thanks to @Hoanghetti for the markdown, i've included a basic usage example within the hover , o you don't need to search for the usage example, simply import, and when writing, the code hint contains a full example.
scaled_sizes(total_size, count, weight, min_size, as_percent)
create an array of sizes which grow or shrink from first to last
which add up to 1.0 if set the as_percent flag , or a total value / sum.
Parameters:
total_size : (float) total size to divide ito split
count : (int ) desired number of splits to create
weight : (float) a weight to apply to grow or shrink the split either towards the last being most, or the first being most, or 1.0 being each is equally sized as 1/n count
min_size : (float) a minimum size for the smallest value (in value of ttotal_size units)
as_percent : (float) a minimum size for the smallest value (in value of total_size units)
Returns: Array of Sizes for each split
scaled_targets(count, weight, minimum, maximum)
create a list of take profitt targets from the smallest to larget distance
Parameters:
count : (int ) number of targets
weight : (float) weight to apply to growing or shrinking
minimum : (float) first value of the output
maximum : (float) last value of the output
Returns: Array of percentage targets

Trend Movement S1-TMIdea:
This script combines: Moving Average (MA), Directional Movement (DMI), MACD
When condition of long or short position from all mentioned indicator are met script opens position. Once trend changes, it closes the position.
Then add some filter conditions to avoid noise.
Concept:
(Note that we take the close to get the closing price)
-Using only cross up down with MA will give a reversal point, but the downside is that it can be noisy.
-MACD will show the current trend detected by cross point.
-Then the +DI , -DI , ADX values are taken into account to confirm the price direction and movement strength.
-This strategy solves this problem by combining 2 more moving averages called 2 trend lines 1 long and 1 short. When the short line crosses up, it will show that the price trend is increasing (at this time the background between these 2 lines will be green) and vice versa (red). To determine if the current trend is bullish or bearish . This will avoid buying when price tend to go down.
-However, there will be many points where some more complex logic is needed. It will add conditions and calculate the probabilities before triggering the signals (You can see them through the item symbols B1, B2, ... ).
How it works:
1. The thin line is stand for short term moving average, and the thick line is stand for long term moving average.
If thin lines cross the thick lines, their color and background will turn green, the price is tend to go up (Uptrend).
If thin lines cross down thick lines, their color and background will turn red, the price is tend to go down (Downtrend).
2. Ability to check the checkbox in setting to show the Golden/De*ath cross.
The yellow symbol "+" is the Golden cross.
The black symbol "+" is the De*th cross.
3. Buy and Sell are show clearly on strategy as the buy and sell point. The default source from bar is CLOSE
4. Setting "Buy only" it using for spot market.
5. When "Not buy in down trend" is checked, it will not trigger buy when in down trend (thin lines cross down thick lines like description in 1.)
6. Setting High spread will call Close buy when it match the High spread bar with the High spread % value
7. It provides setting "Back test From date/To date" for backtest feature. You can set "BacktestFrom date" as the begin of test period. If check box "Using To Date" is check: "Backtest To Date" will be the end of test period.
Suitable time frames:
4h, 1D, 1W
* Please note that this logic does not attempt to predict future prices or 100% accurate signal; Strategy Tester are available to test the profitability of this strategy.
(INVITE ONLY indicator. Please direct message or visit website to try it out)
Hope you guys enjoy!
Examples:
BTCUSD 4H
TSLA 4H

kaptanFantastik[Take Profit and Stop Loss Finder]Hello all,
It's ATR based active take profit & stop loss finder.
You can set multipliers for taking profit and stop losing and you can change the price source for the calculation. Also, you can change the ATR level.
Defaults are my best settings. 2.2x for taking profit and 1.5x for stop losing. Open price is the source. Also, I think 5 ATR is the best for day and swing trade.
Levels are determined according to the open prices (This is because we can enter the position after our other indicators give the signal following the close price. Yet, you can change it). Since it's active and based on my calculation with ATR values, percentages for the taking profits and stop losing may change. Because of this, you need to note the take profit and stop lose prices after your entry price level is determined by the other indicators for the best success rates.
It can be used in any time frame with the other indicators to determine the best entry points. For example, 3 EMA levels with 5,8 and 13 is good option for the entry. You can enter the position when 5 crosses up 8 and both are above the 13. You can also use custom more advanced buy/sell indicators with this one for entry points.
It can be used with any asset from cryptocurrency to the stocks, from forex to gold etc.
Hint: You can set your levels lower than the take profit prices to maximize the success rate.
Note: Market should be open for the positions.
Example trade on the 5-minute timeline.
The below chart has both my custom indicator and the 3 EMAs mentioned above.
Trade 1: Entry price: 19191, Take Profit: 19276. Profit 0.44%
Trade 2: Entry price: 19189, Take Profit: 193009. Profit 0.625%
Türkçe bilen kullanıcılar için açıklama
Herkese merhabalar,
ATR tabanlı aktif kar al ve zararı durdur bulucu.
Kar almak ve zararı kesmek için çarpanlar belirleyebilir ve hesaplama için fiyat kaynağı değiştirebilirsiniz. Ayrıca, ATR seviyesini de değiştirebilirsiniz.
Varsayılanlar benim en iyi ayarlarım. Kar almak için 2,2 kat ve zararı durdurmak için 1,5 kat. Açılış, fiyat kaynağıdır. Ayrıca, 5 ATR'nin günlük ve kısa vade (swing trade) için en iyisi olduğunu düşünüyorum.
Seviyeler açılış fiyatına göre belirlenir (Çünkü diğer göstergelerimiz kapanış fiyatının ardından sinyal verdikten sonra pozisyona girebiliyoruz. Yine de bunu değiştirebilirsiniz). Aktif olduğu için ve ATR değerleri ile yaptığım hesaplamaya göre kar alma ve zarar kes yüzdeleri değişebilir. Bu nedenle, en iyi başarı oranları için; giriş fiyat seviyeniz diğer göstergeler tarafından belirlendikten sonra kar al ve zararı durdur fiyatlarını not etmeniz gerekir.
En iyi giriş noktalarını belirlemek için diğer göstergelerle herhangi bir zaman diliminde kullanılabilir. Örneğin, 5,8 ve 13 ile 3 EMA seviyesi giriş için iyi bir seçenektir. 5, 8'i geçtiğinde ve her ikisi de 13'ün üzerinde olduğunda pozisyona girebilirsiniz. Giriş noktaları için bununla birlikte daha gelişmiş özel al/sat göstergelerini de kullanabilirsiniz.
Kripto paradan hisse senetlerine, forexten altına vb. her türlü varlıkla kullanılabilir.
İpucu: Başarı oranını en üst düzeye çıkarmak için seviyelerinizi kar alma fiyatlarından daha düşük ayarlayabilirsiniz.
Not: Pozisyonlar için piyasa açık olmalıdır.
5 dakikalık zaman çizilgesinde örnek işlem.
Yukarıdaki örnek grafikte hem özel indikatörüm hem de yukrıda belirtilen 3 EMA var.
İşlem 1: Giriş fiyatı: 19191, Kazanç Al: 19276. Kar %0.44
İşlem 2: Giriş fiyatı: 19189, Kazanç Al: 193009. Kar %0.625

Lines and Table for risk managementABOUT THIS INDICATOR
This is a simple indicator that can help you manage the risk when you are trading, and especially if you are leverage trading. The indicator can also be used to help visualize and to find trades within a suitable or predefined trading range.
This script calculates and draws six “profit and risk lines” (levels) that show the change in percentage from the current price. The values are also shown in a table, to help you get a quick overview of risk before you trade.
ABOUT THE LINES/VALUES
This indicator draws seven percentage-lines, where the dotted line in the middle represents the current price. The other three lines on top of and below the middle line shows the different levels of change in percentage from current price (dotted line). The values are also shown in a table.
DEFAULT VALUES AND SETTINGS
By default the indicator draw lines 0.5%, 1.0%, and 1.5% from current price (step size = 0.5).
The default setting for leverage in this indicator = 1 (i.e. no leverage).
The line closest to dotted line (current price) is calculated by step size (%) * leverage (x) = % from price.
Pay attention to the %-values in the table, they represent the distance from the current price (dotted line) to where the lines are drawn.
* Be aware! If you change the leverage, the distance from the closest lines to the dotted line showing the current price increase.
SETTINGS
1. Leverage: set the leverage for what you are planning to trade on (1 = no leverage, 2 = 2 x leverage, 5 = 5 x leverage...).
2. Stepsize is used to set the distance between the lines and price.
EXAMPLES WITH DIFFERENT SETTINGS
1) Leverage = 1 (no leverage, default setting) and step size 0.5 (%). Lines plotted at (0.5%, 1%, 1.5%, and –0.5%, –1%, –1,5%) from the current price.
2) Leverage = 3 and stepsize 0.5(%). Lines plotted at (1.5%, 3.0%, 4.5%, and –1.5%, –3.0%, –4.5%) from the current price.
3) Leverage = 3 and stepsize 1(%). Lines plotted at (3%, 6%, 9%, and –3%, –6%, –9%) from the current price.
The distance to the nearest line from the current price is always calculated by the formula: Leverage * step size (%) = % to the nearest line from the current price.

Position Size and PNL CalculatorPosition Size and PNL Calculator is a Tool indicator which will help trader determine Trading's Position Size base on many risk management method such is Risk Per Trade, Fix Position Size, Fix Initial cost. The stoploss of the order will be set after ATR Stoploss method like my lasted Indicator ATR Stop Loss and Take Profit Finder .
This Tool is using the concept of
- ATR ( Average True Range )
- Risk Reward Ratio (Money Management method)
- Leverage Position Size Calculation
- Leverage PNL Calculation
- Risk Per Trade money management for calculating the size of position base on Account Balance and Risk
How Position Size and PNL Calculator working?
1) The tool will let user Input time and price that trader are entering the order. Then trader have to select the direction of trade, weather it is long position or short position
2) Next It will use entry price to Calculate the Stoploss price buy Calculating its ATR according to the setting then, then The entry price will be plus/mins by ATR*Multiply to get a Stoploss price
3) then we will * Risk Reward Ratio to the distance of stoploss in order to create Takeprofit price
4) After then the tool will simulate and calculate Initial cost/Initial position size base on your setting, and will display Stoploss Price, Take Profit Price, PNL% of Loss if Stoploss is trigger, PNL% of Gain if Take profit is Trigger and current RR/ PNL%
5) User can adjust the leverage and other setting in Indicator setting
How to use Position Size and PNL Calculator
As it was mention, Position Size and PNL Calculator is just a tool that help trader determine Trading's Position Size, PNL and risk management. Trader must use this tool only as a Position Tracking after you help entry order with your our trading strategy

Most Power V5 Most Power V5
The MOST indicator is an indicator used as a Moving Stoploss. The MOST indicator also generates a buy signal in case the prices rise, unlike the traditional indicators that allow you to make stop losses.In the MOST POWER V5 indicator, stoploss generates its signals using moving averages such as 'SMA', 'EMA', 'WMA', 'VWMA', 'HMA', 'SMMA', 'DEMA' rather than just the current price. In this way, it aims to prevent false signals that may be produced by excessive price movements during the day.
MOST POWER Indicator follows the average by preserving the stop loss distance in the movement of the moving average in the same direction.
The second variable that creates the MOST POWER curve is the stop loss distance that gives power to MOST with the moving average used and the shift rate that provides the stop signal. In this version, this distance is prepared with 2 separate inputs for both buy and sell.You can set these values as "percentage for long trend" and "percentage for short trend" in the indicator input properties.
You can also enter your Take Profit-1, Take Profit-2-, Take Profit-3- and Stop Loss levels in the indicator input properties, especially if you are interested in algo trading or to take advantage of the wonderful alarm setup features of tradingview and get the chance to get maximum profit. (If you enter Take Profit-1, Take Profit-2-, Take Profit-3- and Stop Loss levels as 0. Only buy and sell labels will appear on the indicator.)
Also, activate the amplitude filter option from the indicator input settings to get less signal and filter our inputs.
In addition, the entry price, take profit1, take profit2, take profit3 values for the last transaction opened to make things easier are located in the upper right corner of your graph as a table.
Important note: No indicator guarantees investment. That's why the tests you will do before real trades are very important in this indicator. I wish you all successful trades.
i will show how works with examples
Example 1
If you enter Take Profit-1, Take Profit-2-, Take Profit-3- and Stop Loss levels greater than 0
Example 2
If you enter Take Profit-1, Take Profit-2-, Take Profit-3- and Stop Loss levels as 0 (u will see only buy - sell labels)
Example 3
if select Amplitude Filter is on . you will see less signal
how works Amplitude Filter whats logic ?
if Amplitude Filter is active the signal from mostpower will be combined with Amplitude Filter.
for example, if the amplitude value is 2, the highest price and the lowest price of the last 2 bars are calculated. then this amplitude value is calculated for sma with its source high and low. Based on these values, the trend is determined in the amplitude of the price movement.
Important note: No indicator guarantees investment. That's why the tests you will do before real trades are very important in this indicator. I wish you all successful trades.

Auto Risk Reward CalculatorAuto RR Calculator
Gives you the price of certain risk to rewards based on your entry and stop loss inputs.
The information given by this tool does not constitute as financial advice.
FFT Strategy Bi-Directional Stop/Profit/Trailing + VMA + AroonThis strategy uses the Fast Fourier Transform inspired from the source code of @tbiktag for the Fast Fourier Transform & @lazybear for the VMA filter.
If you are not familiar with the Fast Fourier transform it is a variation of the Discrete Fourier Transform. Veritasium on youtube has a great video on it with a follow up recommendation from 3brown1blue. In short it will extract all the frequencies from a set of data. @tbiktag laid the groundwork for creating the indicator which will allow you to isolate only those signals which are the most relevant and remove the noise. I recommend having @tbiktag's FFT Transform indicator side by side with this to understand what my variation is doing by setting similar settings .
Using this idea, you can then optimize a strategy to the frequencies that are best. The main entry signal is when the FFT Signal crosses above or below the 0 line .
Included with this strategy is the ability to optionally bi-directionally set:
Stop Loss
Trailing Stop Loss
Take Profit
Trailing Take Profit
Entries are optionally further filtered by use of the VMA using the algorithm from LazyBear which allows you to adjust a variable moving average with 3 market trend detections. Green represents upwards momentum; Blue sideways trading and Red downwards momentum. The idea being to filter out buy or sell entries unless the market is moving in that direction, and this makes a big difference as you can see for yourself when you turn it off or on. Turning it off will change the color of the FFT signal to orange instead of the green, blue, red colors .
I have added 2 custom stop loss types as well for experimentation:
1. VMA Filter stop loss to exit the trade if the VMA detects a market trend direction change matching the rules you have set. I have set this to off by default, but it is there so you can see what affect it may have on other tickers. It can increase the profit factor but usually at a cost of net profit.
2. The Aroon Filter stop loss with different lengths for the short or long direction. For the Aroon strategy (which is a trend change detector) it is considered bullish if the upper line (green in my code) is above 70 and the lower line (red in my code) is below 30 and the opposite for the bearish case. With this in mind, I have set it to filter by default only the extreme ends (99 and 1) to increase profit factor and net profit but I encourage you to try different settings and see how it affects things. Turning this off yields much higher net profit but at the cost of the profit factor and drawdown . To disable this just uncheck the 'Use Aroon Filter Long' (or short) and it will also hide the aroon graphics and crosses on the plot.
I will be adding more features in an attempt to lower the drawdown on this strategy but I hope you enjoy what I have so far!

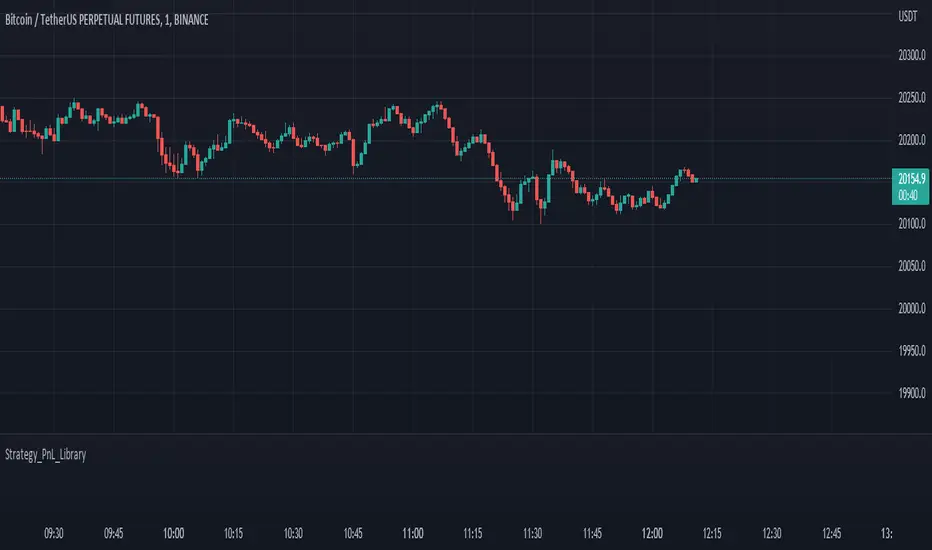
Strategy PnL LibraryLibrary "Strategy_PnL_Library"
TODO: This is a library that helps you learn current pnl of open position and use it to create your own dynamic take profit or stop loss rules based on current level of your profit. It should only be used with strategies.
inTrade()
inTrade: Checks if a position is currently open.
Returns: bool: true for yes, false for no.
notInTrade()
inTrade: Checks if a position is currently open. Interchangeable with inTrade but just here for simple semantics.
Returns: bool: true for yes, false for no.
pnl()
pnl: Calculates current profit or loss of position after the commission. If the strategy is not in trade it will always return na.
Returns: float: Current Profit or Loss of position, positive values for profit, negative values for loss.
entryBars()
entryBars: Checks how many bars it's been since the entry of the position.
Returns: int: Returns a int of strategy entry bars back. Minimum value is always corrected to 1 to avoid lookback errors.
pnlvelocity()
pnlvelocity: Calculates the velocity of pnl by following the change in open profit compared to previous bar. If the strategy is not in trade it will always return na.
Returns: float: Returns a float value of pnl velocity.
pnlacc()
pnlacc: Calculates the acceleration of pnl by following the change in profit velocity compared to previous bar. If the strategy is not in trade it will always return na.
Returns: float: Returns a float value of pnl acceleration.
pnljerk()
pnljerk: Calculates the jerk of pnl by following the change in profit acceleration compared to previous bar. If the strategy is not in trade it will always return na.
Returns: float: Returns a float value of pnl jerk.
pnlhigh()
pnlhigh: Calculates the highest value the pnl has reached since the start of the current position. If the strategy is not in trade it will always return na.
Returns: float: Returns a float highest value the pnl has reached.
pnllow()
pnllow: Calculates the lowest value the pnl has reached since the start of the current position. If the strategy is not in trade it will always return na.
Returns: float: Returns a float lowest value the pnl has reached.
pnldev()
pnldev: Calculates the deviance of the pnl since the start of the current position. If the strategy is not in trade it will always return na.
Returns: float: Returns a float deviance value of the pnl.
pnlvar()
pnlvar: Calculates the variance value of the pnl since the start of the current position. If the strategy is not in trade it will always return na.
Returns: float: Returns a float variance value of the pnl.
pnlstdev()
pnlstdev: Calculates the stdev value of the pnl since the start of the current position. If the strategy is not in trade it will always return na.
Returns: float: Returns a float stdev value of the pnl.
pnlmedian()
pnlmedian: Calculates the median value of the pnl since the start of the current position. If the strategy is not in trade it will always return na.
Returns: float: Returns a float median value of the pnl.
Calculate target by Range [Wyckoff,PnF]First of all, I would like to thank the author @LonesomeTheBlue.
This indicator developed on the source code "Point and Figure (PnF)" by author @LonesomeTheBlue.
This indicator calculate the range (Cause) of Phase accumulation or distribution to calculate the taget (Effect) based on the Wyckoff Method.
Formula for calculate move value target : Col * BoxSize * Reversal
Col -> Number of Column (PnF) in the range (Cause)
BoxSize -> Value in one Box (PnF)
Reversal -> Reversal (PnF)

ATR Stop Loss and Take Profit FinderThe purpose of this tool is to help the trader determine a safe stop loss price and take profit which dynamically changes due to ATR (Average True Range)
This tool uses the concept of
ATR (Average True Range)
Risk Reward Ratio (Money Management method)
How is ATR Stop Loss and Take Profit Finder working
Step 1 ) Tool will calculate TR(True Range
Step 2) Then the TR will be used to find the Average value of X time frame, using 5 math models: RMA SMA EMA WMA and LSMA
Step 3) The value from Step 2 will be multiplied by the factor, and the result is ATR
After we got ATR Value, the Tool will find 2 lines: Upper Band and Lower Band which will function as a Stoploss value for both Short and Long trade
ATR Stop Loss and Take Profit Finder will be using Upper Band and Lower Band to calculate Take profit price. A trader can set their Target Risk Reward Ratio by setting
How to use ATR Stop Loss and Take Profit Finder
ATR Stop Loss and Take Profit Finder is not an indicator, it is only a tool to help the trader quickly find their stop loss/take profit price. t
For open long position, We comment trade to switch mode of 'Type of open Position to be long. Same as short which is need to be changed to short

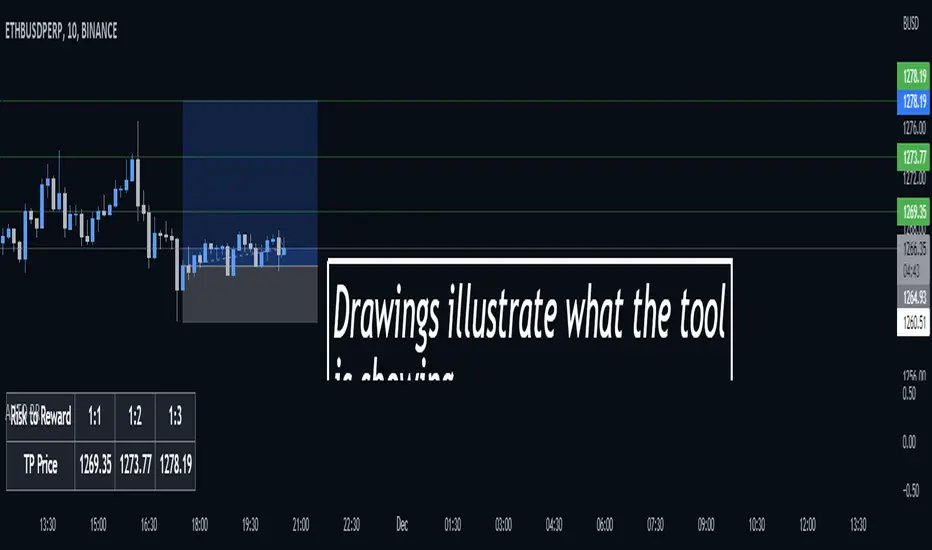
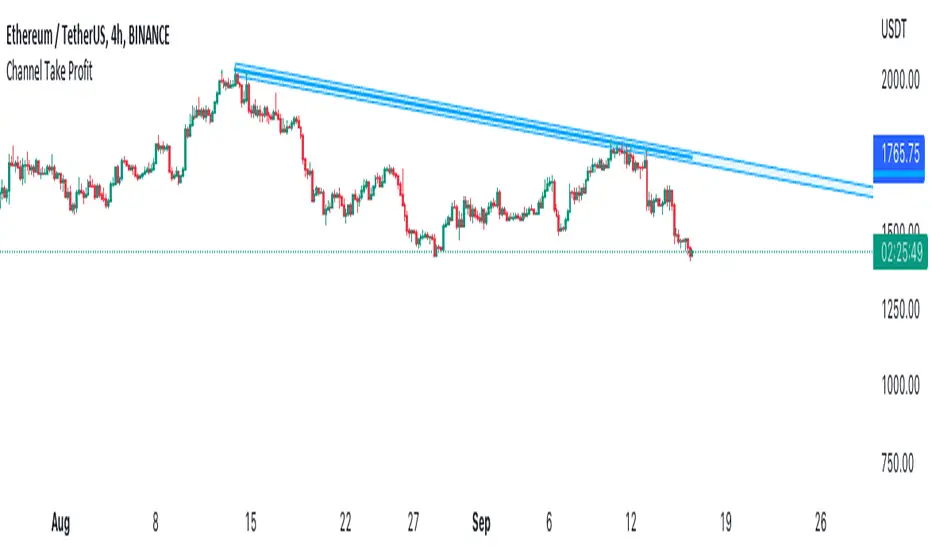
Channel Take Profit Tool for AlertatronWhat is this for
This tool is designed as a companion to an automated strategy running on Alertatron. Sometimes when a strategy opens a trade, you decide that based on TA you would like to close all or or a portion of your trade at a support or resistance level. The strategy may already be programmed to take profit but this tool allows you to add additional take profit criteria that can trigger an alert to Alertatron if it happens before the strategy closes.
How to use it
When you add the indicator to your chart, it will ask you to select two points on the chart. These two points will be connected by a line and create the parallel channel that will be used for triggering a take profit alert. The offset is how wide you want the channel to be. When the high or low of a candle enters the channel from either direction, the alert will be fired. AFTER you add the indicator to the chart and configure ALL of the settings, you need to create an alert on the indicator for "All Alert Functions" and paste your incoming alert webhook from Alertatron into the webhook input.
Alertatron Setup
You will need to provide the API name that you have configured in Alertatron that matches the account the trade is open in. This tool supports ByBit and FTX.us by may work with other exchanges too (this option just chooses which currency/pair divider is used in the alert message).
SuperTrend Entry(My goal creating this indicator) : Provide a way to enter the market systematically, automatically create Stop Loss Levels and Take Profit Levels, and provide the position size of each entry based on a fix Percentage of the traders account.
The Underlying Concept :
What is Momentum?
The Momentum shown is derived from a Mathematical Formula, SUPERTREND. When price closes above Supertrend Its bullish Momentum when its below Supertrend its Bearish Momentum. This indicator scans for candle closes on the current chart and when there is a shift in momentum (price closes below or above SUPERTREND) it notifies the trader with a Bar Color change.
Technical Inputs
- If you want to optimize the rate of signals to better fit your trading plan you would change the Factor input and ATR Length input. Increase factor and ATR Length to decrease the frequency of signals and decrease the Factor and ATR Length to increase the frequency of signals.
Quick TIP! : You can Sync all VFX SuperTrend Indicators together! All VFX SuperTrend indicators display unique information but its all derived from that same Momentum Formula. Keep the Factor input and ATR Length the same on other VFX SuperTrend indicators to have them operating on the same data.
Display Inputs
- The indicator has a candle overlay option you can toggle ON or OFF. If toggled ON the candles color will represent the momentum of your current chart ( bullish or bearish Momentum)
your able to change the colors that represent bullish or bearish to your preference
- You can toggle on which shows the exact candle momentum switched sides
your able to change the colors that represent a bullish switch or bearish switch to your preference
- The trader can specify which point you would like your stop loss to reference. (Low and High) Which uses the Low of the Momentum signal as the reference for your Stop Loss during buy signals and the High as the reference during sell signals. Or (Lowest Close and Highest Close) which uses the Lowest Close of the Momentum signal as the reference for your Stop Loss during buys and the Highest Close as the reference during sells.
- The colors that represent your Stop Loses and Take Profits can also be changed
Risk Management Inputs
- Your Risk MANAGMENT section is used to set up how your Stop Loss and Take Profit are calculated
- You have the option to take in account Volatility when calculating your Stop Loss. A adjusted ATR formula is used to achieve this. Increase Stop Loss Multiplier from 0 to widen stops.
- Increase Take Profit Multiplier from 0 to access visual Take Profit Levels based on your Stop Loss. This will be important for traders that Prefer trading using risk rewards. For Example: If the the Take Profit Multiplier is 3 a Take Profit level 3 times the size or your stop loss from your entry will be shown and a price number corresponding to that Take Profit Level becomes available.
- Enter your current Account size, Bet Percentage and Fixed Spread to get your Position Size for each trade
-Toggle on the Current Trade Chart and easily get the size of your Position and the exact price of your Take Profit and Stop Loss.
You can increase the Size of the Current Trade Chart= Tiny, Small, Normal, Large, Huge and change the Position of the Current
trade Chart to your preference, (Top- Right, Center, Left) (Middle- Right, Center, Left) (Bottom- Right, Center, Left).
How it can be used ?
- Enter Trades and always know where your stop is going to be
- Eliminate the need to manual calculate Position Size
- Get a consistent view of the current charts momentum
- Systematical enter trades
- Reduce information overload

TTP Kent StratKent Strat trades breakouts using Bollinger Bands together with SuperTrend.
Features:
- Risk/reward ratio parameter
- Longs, shorts and combined positions.
- Breakout settings
- Trailing SL, trailing TP
- Use of latest candles to place the SL using a lookback parameter (how many candles to look back for a low/high price)
- Select your SL between the ATR trendline and the latest candle: the closest or furthest away value
- Show the trendline
- Backtest mode for accurate backtests
- Signal mode for live price accurate signals
- Date range backtesting
Filters:
- EMA 200 filter and timeframe selector. This filter can be used to trade with the trend: open longs on an uptrend and shorts on a downtrend.
- ADX filter using threshold. This filter can be used to filter entries where the trend is not very strong.
- ADX pointing up. ADX values pointing up and above certain threshold can improve entries.
- Relative volume filter based on the volume being X% above the MA of the Volume. Trading with volume can help filtering out bad trades.
Example setup:
1) pick BINANCE:ETHUSDT chart, 15 min chart
2) trade longs + shorts
3) pick ratio 3
4) trailing SL checked
5) trailing TP unchecked
7) stop loss "furthest"
8) candle loopback 30
9) BB period 21, dev 1, ATR filter on, atr period 5
10) EMA filter on, 15 min
11) ADX off
12) Volume filter on set to 60%

Take Profit On Trend v2 (by BHD_Trade_Bot)The purpose of strategy is to detect long-term uptrend and short-term downtrend so that you can easy to take profit.
The strategy also using BHD unit to detect how big you win and lose, so that you can use this strategy for all coins without worry about it have different percentage of price change.
ENTRY
The buy order is placed on assets that have long-term uptrend and short-term downtrend:
- Long-term uptrend condition: ema200 is going up
- Short-term downtrend condition: 2 last candles are down price (use candlestick for less delay)
CLOSE
The sell order is placed when take profit or stop loss:
- Take profit: price increase 2 BHD unit
- Stop loss: price decrease 3 BHD unit
The strategy use $1000 for initial capital and trading fee is 0.1% for each order.
Pro tip: The 1-hour time frame for ETH/USDT has the best results on average.

R:R Trading System FrameworkFirst off, huge thanks to @fikira! He was able to adapt what I built to work much more efficiently, allowing for more strategies to be used simultaneously. Simply put, I could not have gotten to this point without you. Thanks for what you do for the TV community. Second, I am fairly new to pinescript writing, so I welcome criticism, thoughtful input and improvement suggestions. I would love to grow this concept into something even better, if possible. So please let me know if you have any ideas for improvement. However I do juggle a lot of different things outside of TV, so implementations may be delayed.
I have decided, at this time, not to add alerts. First, because I feel most people looking to adapt this framework can add their own pretty easily. Also, given how customized the framework is currently, while also attempting to account for all the possible ways in which people may want alerts to function after they customize it, it seems best to leave them out as it doesn't exactly fit the idea of a framework.
For best viewing, I recommend hovering over the script's name > ... > Visual order > Bring to front. Also I found hollow candles with mono-toned colors (like pictured) are more visually appealing for me personally. I HIGHLY RECOMMEND USING WITH BAR REPLAY TO BETTER UNDERSTAND THE FRAMEWORK'S FUNCTIONALITY.
▶️ WHAT THIS FRAMEWORK IS
- A huge collection of concepts and capabilities for those trying to better understand, learn, or teach pinescript.
- A system designed to showcase Risk:Reward concepts more holistically by providing all of the most popular components of retail trading to include backtesting, trade visual plotting, position tracking, market condition shifts, and useful info while positioned to help highlight changes in your risk:reward based decision-making processes.
- A system that can showcase individual strategies regardless of trade direction, allowing you to develop hedging strategies without having multiple indicators that do not correlate with each other.
- Designed around the idea that you trade less numbers of assets but manage your positions and risk based on multiple concurrently running strategies to manage your risk exposure and reward potential.
- An attempt to combine all the things you need to execute with an active trading management style.
- A framework that uses backtested results (in this case the number of averaged bars it takes to hit key levels) in real-time to inform your risk:reward decision-making while in-trade (in this case in your Trade Tracking Table using dynamic color to show how you might be early, on-time, or late compared to the average amount of backtested time it normally takes to hit that specific key level).
▶️ WHAT THIS FRAMEWORK IS NOT
- A complete trading product. DO NOT USE as-is. It is a FRAMEWORK for you to generate ideas of your own and fairly easily implement your own triggering conditions in the appropriate sections of the script.
▶️ USE CASES
- If you decide you like the Stop, Target, Trailing Stop, and Risk:Reward components as-is, then just understanding how to plug in your Entry and Bullish / Bearish conditions (Triangles) and adjust the input texts to match your custom naming will be all you need to make it your own!
- If you want to adapt certain components, then this system gives you a great starting point to adapt your different concepts and ideas from.
▶️ SYSTEM COMPONENTS
- Each of the system's components are described via tooltips both in the input menu and in the tables' cells.
- Each label on the chart displays the corresponding price at those triggered conditions on hover with tooltips.
- The Trailing Stop only becomes active once it is above the Entry Price for that trade, and brightens to show it is active. The STOP line (right of price) moves once it takes over for the Entry Stop representing the level of the Trailing Stop at that time for that trade.
- The Lines / Labels to the right of price will brighten once price is above for Longs or below for Shorts. The Trade Tracking Table cells will add ☑️ once price is above for Longs or below for Shorts.
- The brighter boxes on the chart show the trades that occurred based on your criteria and are color coded for all components of each trade type to ensure your references are consistent. (Defaults are TV built-in strategies)
- The lighter boxes on the chart show the highest and lowest price levels reached during those trades, to highlight areas where improvements can be made or additional considerations can be accounted for by either adjusting Entry triggers or Bullish / Bearish triggers.
- Default Green and Red Triangles (Bullish / Bearish) default to having the same triggering condition as the Entry it corresponds to. This is to highlight either a pyramiding concept, early exit, or you can change to account for other things occurring during your trades which could help you with Stop and Target management/considerations.
TradingView and many of its community members have done a lot for me, so this is my attempt to give back.

Squeeze Momentum Strategy [LazyBear] Buy Sell TP SL Alerts-Modified version of Squeeze Momentum Indicator by @LazyBear.
-Converted to version 5,
-Taken inspiration from @KivancOzbilgic for its buy sell calculations,
-Used @Bunghole strategy template with Take Profit, Stop Loss and Enable/Disable Toggles
-Added Custom Date Backtesting Module
------------------------------------------------------------------------------------------------------------------------
All credit goes to above
Problem with original version:
The original Squeeze Momentum Strategy did not have buy sell signals and there was alot of confusion as to when to enter and exit.
There was no proper strategy that would allow backtesting on which further analysis could be carried out.
There are 3 aspects this strategy:
1 ) Strategy Logic (easily toggleable from the dropdown menu from strategy settings)
- LazyBear (I have made this simple by using Kivanc technique of Momentums Moving Average Crossover, BUY when MA cross above signal line, SELL when crossdown signal line)
- Zero Crossover Line (BUY signal when crossover zero line, and SELL crossdown zero line)
2) Long Short TP and SL
- In strategies there is usually only 1 SL and 1 TP, and it is assumed that if a 2% SL giving a good profit %, then it would be best for both long and short. However this is not the case for many. Many markets/pairs, go down with much more speed then they go up with. Hence once we have a profitable backtesting setting, then we should start optimizing Long and Short SL's seperately. Once that is done, we should start optimizing for Long and Short TP's separately, starting with Longs first in both cases.
3) Enable and Disable Toggles of Long and Short Trades
- Many markets dont allow short trades, or are not suitable for short trades. In this case it would be much more feasible to disable "Short" Trading and see results of Long Only as a built in graphic view of backtestor provides a more easy to understand data feed as compared to the performance summary in which you have to review long and short profitability separately.
4) Custom Data Backtesting
- One of most crucial aspects while optimizing for backtesting is to check a strategies performance on uptrends, downtrend and sideways markets seperately as to understand the weak points of strategy.
- Once you enable custom date backtesting, you will see lines on the chart which can be dragged left right based on where you want to start and end the backtesting from and to.
Note:
- Not a financial advise
- Open to feedback, questions, improvements, errors etc.
- More info on how the squeeze momentum works visit LazyBear indicator link:
Happy Trading!
Cheers
M Tahreem Alam @mtahreemalam

Strategy Backtesting Template [MYN]A few people have been asking me to share my backtesting template. Currently I use this as my starting point for validating existing strategies and developing new ones.
Features:
Trading Date Range
Trade Direction
4 progressive take profits with target percents and percentage of position to take profit on (Thanks adolgo)
Variable percentage Stop Loss
Automatic ProfitView Alert Syntax builder for Longs and Shorts
ADX checkbox to automatically add conditional logic to your strategy

ATR MultiplierOVERVIEW
The Average True Range Multiplier (ATRX) is a simple technical indicator that takes the value of the ATR indicator and multiplies it by a user-specified amount.
CONCEPTS
This indicator is primarily used to set key levels based on historical volatility. The ATR indicator alone measures the historical volatility of the selected instrument, this indicator just multiplies that value to save the hassle of doing that yourself.
