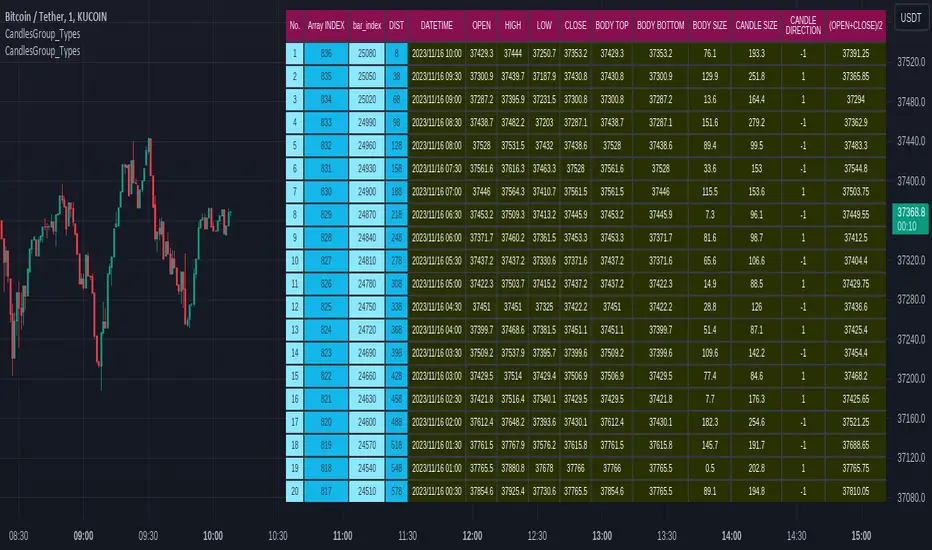
CandlesGroup_TypesLibrary "CandlesGroup_Types"
CandlesGroup Type allows you to efficiently store and access properties of all the candles in your chart.
You can easily manipulate large datasets, work with multiple timeframes, or analyze multiple symbols simultaneously. By encapsulating the properties of each candle within a CandlesGroup object, you gain a convenient and organized way to handle complex candlestick patterns and data.
For usage instructions and detailed examples, please refer to the comments and examples provided in the source code.
method init(_self)
Namespace types: CandlesGroup
Parameters:
_self (CandlesGroup)
method init(_self, propertyNames)
Namespace types: CandlesGroup
Parameters:
_self (CandlesGroup)
propertyNames (string )
method get(_self, key)
get values array from a given property name
Namespace types: CandlesGroup
Parameters:
_self (CandlesGroup) : : CandlesGroup object
key (string) : : key name of selected property. Default is "index"
Returns: values array
method size(_self)
get size of values array. By default it equals to current bar_index
Namespace types: CandlesGroup
Parameters:
_self (CandlesGroup) : : CandlesGroup object
Returns: size of values array
method push(_self, key, value)
push single value to specific property
Namespace types: CandlesGroup
Parameters:
_self (CandlesGroup) : : CandlesGroup object
key (string) : : key name of selected property
value (float) : : property value
Returns: CandlesGroup object
method push(_self, arr)
Namespace types: CandlesGroup
Parameters:
_self (CandlesGroup)
arr (float )
method populate(_self, ohlc)
populate ohlc to CandlesGroup
Namespace types: CandlesGroup
Parameters:
_self (CandlesGroup) : : CandlesGroup object
ohlc (float ) : : array of ohlc
Returns: CandlesGroup object
method populate(_self, values, propertiesNames)
populate values base on given properties Names
Namespace types: CandlesGroup
Parameters:
_self (CandlesGroup) : : CandlesGroup object
values (float ) : : array of property values
propertiesNames (string ) : : an array stores property names. Use as keys to get values
Returns: CandlesGroup object
method populate(_self)
populate values (default setup)
Namespace types: CandlesGroup
Parameters:
_self (CandlesGroup) : : CandlesGroup object
Returns: CandlesGroup object
method lookback(arr, bars_lookback)
get property value on previous candles. For current candle, use *.lookback()
Namespace types: float
Parameters:
arr (float ) : : array of selected property values
bars_lookback (int) : : number of candles lookback. 0 = current candle. Default is 0
Returns: single property value
method highest_within_bars(_self, hiSource, start, end, useIndex)
get the highest property value between specific candles
Namespace types: CandlesGroup
Parameters:
_self (CandlesGroup) : : CandlesGroup object
hiSource (string) : : key name of selected property
start (int) : : start bar for calculation. Default is candles lookback value from current candle. 'index' value is used if 'useIndex' = true
end (int) : : end bar for calculation. Default is candles lookback value from current candle. 'index' value is used if 'useIndex' = true. Default is 0
useIndex (bool) : : use index instead of lookback value. Default = false
Returns: the highest value within candles
method highest_within_bars(_self, returnWithIndex, hiSource, start, end, useIndex)
get the highest property value and bar index between specific candles
Namespace types: CandlesGroup
Parameters:
_self (CandlesGroup) : : CandlesGroup object
returnWithIndex (bool) : : the function only applicable when it is true
hiSource (string) : : key name of selected property
start (int) : : start bar for calculation. Default is candles lookback value from current candle. 'index' value is used if 'useIndex' = true
end (int) : : end bar for calculation. Default is candles lookback value from current candle. 'index' value is used if 'useIndex' = true. Default is 0
useIndex (bool) : : use index instead of lookback value. Default = false
Returns:
method highest_point_within_bars(_self, hiSource, start, end, useIndex)
get a Point object which contains highest property value between specific candles
Namespace types: CandlesGroup
Parameters:
_self (CandlesGroup) : : CandlesGroup object
hiSource (string) : : key name of selected property
start (int) : : start bar for calculation. Default is candles lookback value from current candle. 'index' value is used if 'useIndex' = true
end (int) : : end bar for calculation. Default is candles lookback value from current candle. 'index' value is used if 'useIndex' = true. Default is 0
useIndex (bool) : : use index instead of lookback value. Default = false
Returns: Point object contains highest property value
method lowest_within_bars(_self, loSource, start, end, useIndex)
get the lowest property value between specific candles
Namespace types: CandlesGroup
Parameters:
_self (CandlesGroup) : : CandlesGroup object
loSource (string) : : key name of selected property
start (int) : : start bar for calculation. Default is candles lookback value from current candle. 'index' value is used if 'useIndex' = true
end (int) : : end bar for calculation. Default is candles lookback value from current candle. 'index' value is used if 'useIndex' = true. Default is 0
useIndex (bool) : : use index instead of lookback value. Default = false
Returns: the lowest value within candles
method lowest_within_bars(_self, returnWithIndex, loSource, start, end, useIndex)
get the lowest property value and bar index between specific candles
Namespace types: CandlesGroup
Parameters:
_self (CandlesGroup) : : CandlesGroup object
returnWithIndex (bool) : : the function only applicable when it is true
loSource (string) : : key name of selected property
start (int) : : start bar for calculation. Default is candles lookback value from current candle. 'index' value is used if 'useIndex' = true
end (int) : : end bar for calculation. Default is candles lookback value from current candle. 'index' value is used if 'useIndex' = true. Default is 0
useIndex (bool) : : use index instead of lookback value. Default = false
Returns:
method lowest_point_within_bars(_self, loSource, start, end, useIndex)
get a Point object which contains lowest property value between specific candles
Namespace types: CandlesGroup
Parameters:
_self (CandlesGroup) : : CandlesGroup object
loSource (string) : : key name of selected property
start (int) : : start bar for calculation. Default is candles lookback value from current candle. 'index' value is used if 'useIndex' = true
end (int) : : end bar for calculation. Default is candles lookback value from current candle. 'index' value is used if 'useIndex' = true. Default is 0
useIndex (bool) : : use index instead of lookback value. Default = false
Returns: Point object contains lowest property value
method time2bar(_self, t)
Convert UNIX time to bar index of active chart
Namespace types: CandlesGroup
Parameters:
_self (CandlesGroup) : : CandlesGroup object
t (int) : : UNIX time
Returns: bar index
method time2bar(_self, timezone, YYYY, MMM, DD, hh, mm, ss)
Convert timestamp to bar index of active chart. User defined timezone required
Namespace types: CandlesGroup
Parameters:
_self (CandlesGroup) : : CandlesGroup object
timezone (string) : : User defined timezone
YYYY (int) : : Year
MMM (int) : : Month
DD (int) : : Day
hh (int) : : Hour. Default is 0
mm (int) : : Minute. Default is 0
ss (int) : : Second. Default is 0
Returns: bar index
method time2bar(_self, YYYY, MMM, DD, hh, mm, ss)
Convert timestamp to bar index of active chart
Namespace types: CandlesGroup
Parameters:
_self (CandlesGroup) : : CandlesGroup object
YYYY (int) : : Year
MMM (int) : : Month
DD (int) : : Day
hh (int) : : Hour. Default is 0
mm (int) : : Minute. Default is 0
ss (int) : : Second. Default is 0
Returns: bar index
method get_prop_from_time(_self, key, t)
get single property value from UNIX time
Namespace types: CandlesGroup
Parameters:
_self (CandlesGroup) : : CandlesGroup object
key (string) : : key name of selected property
t (int) : : UNIX time
Returns: single property value
method get_prop_from_time(_self, key, timezone, YYYY, MMM, DD, hh, mm, ss)
get single property value from timestamp. User defined timezone required
Namespace types: CandlesGroup
Parameters:
_self (CandlesGroup) : : CandlesGroup object
key (string) : : key name of selected property
timezone (string) : : User defined timezone
YYYY (int) : : Year
MMM (int) : : Month
DD (int) : : Day
hh (int) : : Hour. Default is 0
mm (int) : : Minute. Default is 0
ss (int) : : Second. Default is 0
Returns: single property value
method get_prop_from_time(_self, key, YYYY, MMM, DD, hh, mm, ss)
get single property value from timestamp
Namespace types: CandlesGroup
Parameters:
_self (CandlesGroup) : : CandlesGroup object
key (string) : : key name of selected property
YYYY (int) : : Year
MMM (int) : : Month
DD (int) : : Day
hh (int) : : Hour. Default is 0
mm (int) : : Minute. Default is 0
ss (int) : : Second. Default is 0
Returns: single property value
method bar2time(_self, index)
Convert bar index of active chart to UNIX time
Namespace types: CandlesGroup
Parameters:
_self (CandlesGroup) : : CandlesGroup object
index (int) : : bar index
Returns: UNIX time
Point
A point on chart
Fields:
price (series float) : : price value
bar (series int) : : bar index
bartime (series int) : : time in UNIX format of bar
Property
Property object which contains values of all candles
Fields:
name (series string) : : name of property
values (float ) : : an array stores values of all candles. Size of array = bar_index
CandlesGroup
Candles Group object which contains properties of all candles
Fields:
propertyNames (string ) : : an array stores property names. Use as keys to get values
properties (Property ) : : array of Property objects
Table
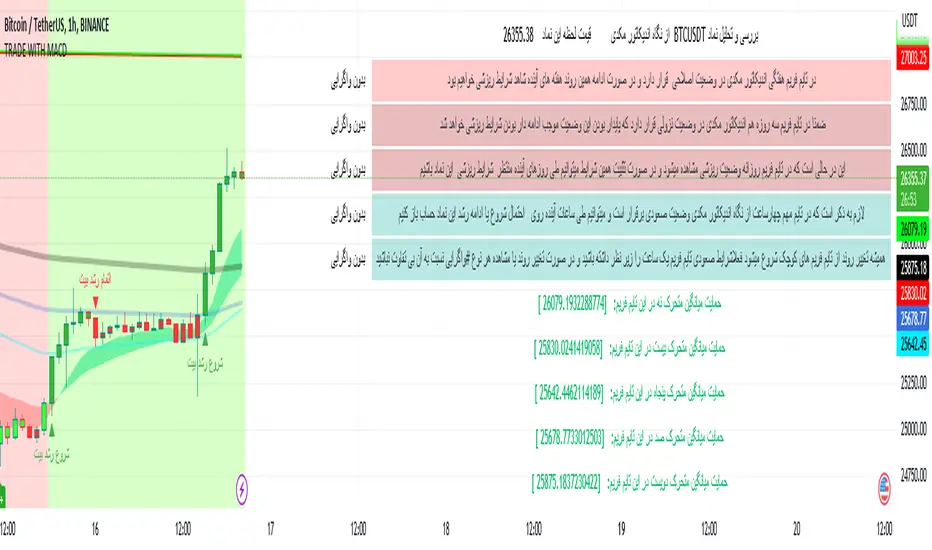
TRADE WITH MACDThis indicator is used to identify the trend through the background color and by using the MACD indicator information and summarizing the moving average information and identifying the trend through the integration of information and then warning the fall and growth of the price of Bitcoin relative to the successful entry into any transaction by the trader. it helps
Some features of this indicator:
- The table draws the time frames in the desired time period quickly and accurately
- Identifying and inserting ascending and descending trends
- View the chart of five moving averages (9, 20, 50, 100, 200) at the same time
- Draw charts automatically or draw a chart with the desired interval length and desired start time
- Automatic updating of price data charts
- Changing the background color and warning in separate time frames from the current time frame as desired by the trader
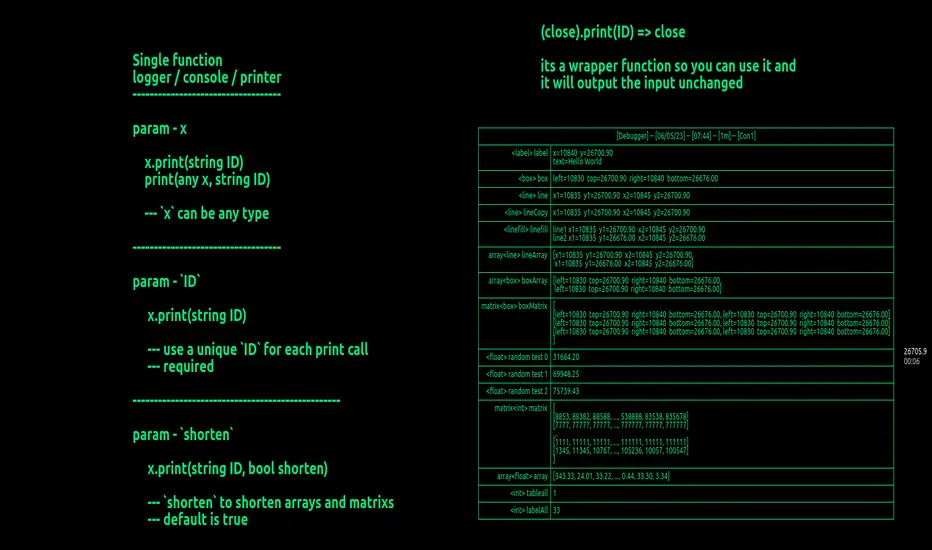
.print()
You don't need to initialize anything..
After you import the library you can use .print() as easy as that..!
Hope this helps
* use a unique ID for each .print() call
let me know if you run into any bugs
by trying to make it as user friendly as possible i had to do
some not ideal things so there's a chance it could present some bugs with
a lot of labels present on the chart
and if you use label.all to parse and manipulate the labels on the chart..
most likely it will cause an issue but not a lot of people use this so
I don't think that will be a problem.
thanks,
FFriZz | frizlabz
Library "print"
Single function to print any type to console
method str(inp)
`method` convert all types to string
```
(overload)
*.str(any inp) => string
```
Namespace types: series string, simple string, input string, const string
Parameters:
inp (string) : `any` - desc | Required
Returns: `string` formatted string
method str(inp)
Namespace types: series int, simple int, input int, const int
Parameters:
inp (int)
method str(inp)
Namespace types: series float, simple float, input float, const float
Parameters:
inp (float)
method str(inp)
Namespace types: series bool, simple bool, input bool, const bool
Parameters:
inp (bool)
method str(inp)
Namespace types: series linefill
Parameters:
inp (linefill)
method str(inp)
Namespace types: series line
Parameters:
inp (line)
method str(inp)
Namespace types: series box
Parameters:
inp (box)
method str(inp)
Namespace types: series label
Parameters:
inp (label)
method str(inp)
Namespace types: matrix
Parameters:
inp (matrix)
method str(inp)
Namespace types: matrix
Parameters:
inp (matrix)
method str(inp)
Namespace types: matrix
Parameters:
inp (matrix)
method str(inp)
Namespace types: matrix
Parameters:
inp (matrix)
method str(inp)
Namespace types: matrix
Parameters:
inp (matrix)
method str(inp)
Namespace types: matrix
Parameters:
inp (matrix)
method str(inp)
Namespace types: matrix
Parameters:
inp (matrix)
method str(inp)
Namespace types: matrix
Parameters:
inp (matrix)
method str(inp)
Namespace types: linefill
Parameters:
inp (linefill )
method str(inp)
Namespace types: line
Parameters:
inp (line )
method str(inp)
Namespace types: box
Parameters:
inp (box )
method str(inp)
Namespace types: label
Parameters:
inp (label )
method str(inp)
Namespace types: string
Parameters:
inp (string )
method str(inp)
Namespace types: int
Parameters:
inp (int )
method str(inp)
Namespace types: float
Parameters:
inp (float )
method str(inp)
Namespace types: bool
Parameters:
inp (bool )
method arrayShorten(str)
arrayShorten
Namespace types: series string, simple string, input string, const string
Parameters:
str (string) : `string` - the string to shorten | Required
Returns: `string` - a shortened version of the input string if it is an array with more than 7 elements, otherwise the original string
method matrixShorten(str)
matrixShorten
Namespace types: series string, simple string, input string, const string
Parameters:
str (string) : `string` - the string to shorten | Required
Returns: `string` - the shortened matrix string if the input is a matrix, otherwise returns the input string as is
method print(x, ID)
print all types to theh same console with just this `method/function`
```
(overload)
*.print(any x, string ID, bool shorten=true?) => console
"param 'shorten' - only for arrays and matrixs" | true
```
Namespace types: series string, simple string, input string, const string
Parameters:
x (string) : - `any` input to convert
ID (string) : - `string` unique id for label on console `MUST BE UNIQUE`
Returns: adds the `ID` and the `inp` to the console on the chart
method print(x, ID)
Namespace types: series float, simple float, input float, const float
Parameters:
x (float)
ID (string)
method print(x, ID)
Namespace types: series int, simple int, input int, const int
Parameters:
x (int)
ID (string)
method print(x, ID)
Namespace types: series box
Parameters:
x (box)
ID (string)
method print(x, ID)
Namespace types: series bool, simple bool, input bool, const bool
Parameters:
x (bool)
ID (string)
method print(x, ID)
Namespace types: series label
Parameters:
x (label)
ID (string)
method print(x, ID)
Namespace types: series line
Parameters:
x (line)
ID (string)
method print(x, ID)
Namespace types: series linefill
Parameters:
x (linefill)
ID (string)
method print(x, ID, shorten)
Namespace types: string
Parameters:
x (string )
ID (string)
shorten (bool)
method print(x, ID, shorten)
Namespace types: float
Parameters:
x (float )
ID (string)
shorten (bool)
method print(x, ID, shorten)
Namespace types: int
Parameters:
x (int )
ID (string)
shorten (bool)
method print(x, ID, shorten)
Namespace types: box
Parameters:
x (box )
ID (string)
shorten (bool)
method print(x, ID, shorten)
Namespace types: bool
Parameters:
x (bool )
ID (string)
shorten (bool)
method print(x, ID, shorten)
Namespace types: label
Parameters:
x (label )
ID (string)
shorten (bool)
method print(x, ID, shorten)
Namespace types: line
Parameters:
x (line )
ID (string)
shorten (bool)
method print(x, ID, shorten)
Namespace types: linefill
Parameters:
x (linefill )
ID (string)
shorten (bool)
method print(x, ID, shorten)
Namespace types: matrix
Parameters:
x (matrix)
ID (string)
shorten (bool)
method print(x, ID, shorten)
Namespace types: matrix
Parameters:
x (matrix)
ID (string)
shorten (bool)
method print(x, ID, shorten)
Namespace types: matrix
Parameters:
x (matrix)
ID (string)
shorten (bool)
method print(x, ID, shorten)
Namespace types: matrix
Parameters:
x (matrix)
ID (string)
shorten (bool)
method print(x, ID, shorten)
Namespace types: matrix
Parameters:
x (matrix)
ID (string)
shorten (bool)
method print(x, ID, shorten)
Namespace types: matrix
Parameters:
x (matrix)
ID (string)
shorten (bool)
method print(x, ID, shorten)
Namespace types: matrix
Parameters:
x (matrix)
ID (string)
shorten (bool)
method print(x, ID, shorten)
Namespace types: matrix
Parameters:
x (matrix)
ID (string)
shorten (bool)
Monthly Strategy Performance TableWhat Is This?
This script code adds a Monthly Strategy Performance Table to your Pine Script strategy scripts so you can see a month-by-month and year-by-year breakdown of your P&L as a percentage of your account balance.
The table is based on realized equity rather than open equity, so it only updates the metrics when a trade is closed.
That's why some numbers will not match the Strategy Tester metrics (such as max drawdown), as the Strategy Tester bases metrics like max drawdown on open trade equity and not realized equity (closed trades).
The script is still a work-in-progress, so make sure to read the disclaimer below. But I think it's ready to release the code for others to play around with.
How To Use It
The script code includes one of my strategies as an example strategy. You need to replace my strategy code with your own. To do that just copy the source code below into a blank script, delete lines 11 -> 60 and paste your strategy code in there instead of mine. The script should work with most systems, but make sure to read the disclaimer below.
It works best with a significant amount of historical data, so it may not work very effectively on intraday timeframes as there is a severe limitation of available bars on TradingView. I recommend using it on 4HR timeframes and above, as anything less will produce very little usable data. Having a premium TradingView plan will also help boost the number of available bars.
You can hover your mouse over a table cell to get more information in the form of tooltips (such as the Long and Short win rate if you hover over your total return cell).
Credit
The code in this script is based on open-source code originally written by QuantNomad, I've made significant changes and additions to the original script but all credit for the idea and especially the display table code goes to them - I just built on top of it:
Why Did I Make This?
None of this is trading or investment advice, just my personal opinion based on my experience as a trader and systems developer these past 6+ years:
The TradingView Strategy Tester is severely limited in some important ways. And unless you use complex Excel formulas on exported test data, you can't see a granular perspective of your system's historical performance.
There is much more to creating profitable and tradeable systems than developing a strategy with a good win rate and a good return with a reasonable drawdown.
Some additional questions we need to ask ourselves are:
What did the system's worst drawdown look like?
How long did it last?
How often do drawdowns occur, and how quickly are they typically recovered?
How often do we have a break-even or losing month or year?
What is our expected compounded annual growth rate, and how does that growth rate compare to our max drawdown?
And many more questions that are too long to list and take a lifetime of trading experience to answer.
Without answering these kinds of questions, we run the risk of developing systems that look good on paper, but when it comes to live trading, we are uncomfortable or incapable of enduring the system's granular characteristics.
This Monthly Performance Table script code is intended to help bridge some of that gap with the Strategy Tester's limited default performance data.
Disclaimer
I've done my best to ensure the numbers this code outputs are accurate, and according to my testing with my personal strategy scripts it appears to work fine. But there is always a good chance I've missed something, or that this code will not work with your particular system.
The majority of my TradingView systems are extremely simple single-target systems that operate on a closed-candle basis to minimize many of the data reliability issues with the Strategy Tester, so I was unable to do much testing with multiple targets and pyramiding etc.
I've included a Debug option in the script that will display important data and information on a label each time a trade is closed. I recommend using the Debug option to confirm that the numbers you see in the table are accurate and match what your strategy is actually doing.
Always do your own due diligence, verify all claims as best you can, and never take anyone's word for anything.
Take care, and best of luck with your trading :)
Kind regards,
Matt.
PS. If you're interested in learning how this script works, I have a free hour-long video lesson breaking down the source code - just check out the links below this script or in my profile.

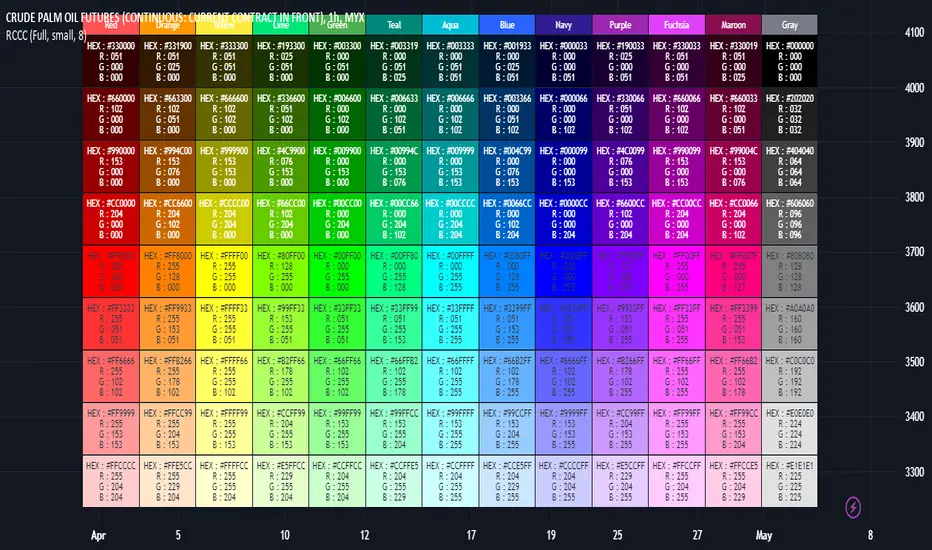
RGB Color Codes Chart█ OVERVIEW
This indicator is an educational indicator to make pine coders easier to input color code.
Color code displayed either in hex or rgb code or both.
█ INSPIRATIONS
RGB Color Codes Chart
Table Color For Pairing Black And White
█ FEATURES
Hover table cell to see all properties of color such as Hex code and RGB code via tooltip.
Cell can be show either Full, HEX, RGB, R, G, B or na.
█ LIMITATION
This code does not consider usage of color.new()
█ CONSIDERATION
Code consideration to be used such as color.r(), color.g(), color.b() and color.rgb()
█ EXAMPLE OF USAGE / EXPLAINATION
toolsLibrary "tools"
A library of many helper methods, plus a comprehensive print method and a printer object.
This is a newer version of the helpers library. This script uses pinescripts v5 latest objects and methods.
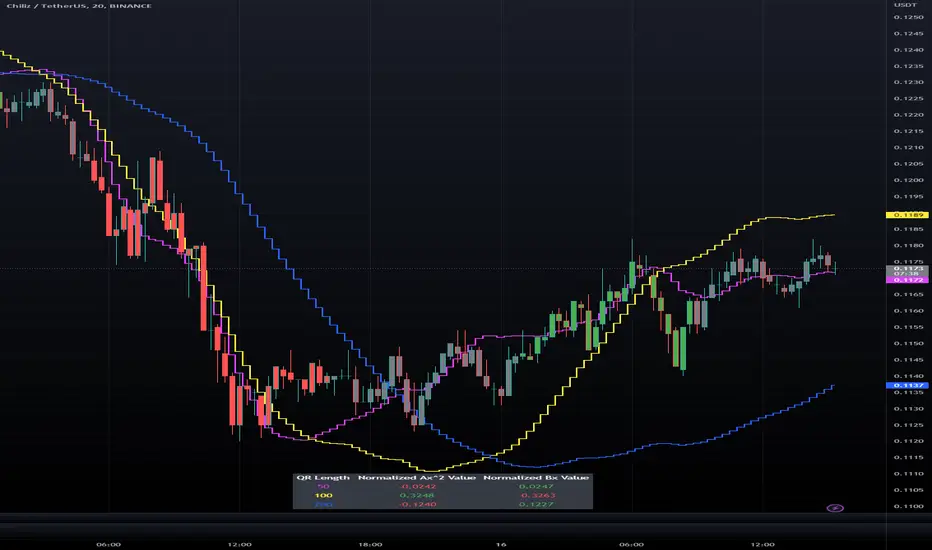
Triple Quadratic Regression (w/ Normalized Value Table)This indicator draws three step lines - a fast (fuchsia), a medium (yellow), and a slow (blue) quadratic regression line to help the user obtain a clearer picture of current trends. Quadratic regression is better suited to determining (and predicting) trend than linear regression; y = ax^2 + bx + c is better to use than a simple y = ax + b. Calculating the regression involves five summation equations that utilize the bar index (x1), the price source (defaulted to ohlc4), the desired lengths, and the square of x1. Determining the coefficient values requires an additional step that factors in the simple moving average of the source, bar index, and the squared bar index.
In addition to the plotted lines, a change in bar color and a table were added. The bar color is influenced by the values of ax^2 and bx of the fast and medium length regressions. If ax^2 and bx for both the fast and medium lengths are above 0, the bar color is green. If they are both under 0, the bar color is red. Otherwise, bars are colored gray. In the table, located at the bottom of the chart (but can be moved), the ax^2 and bx values for each regression length are shown. The option to view normalized (scale of -1 to +1) values or the standard values is included in the indicator settings menu. By default, the normalized values are shown.
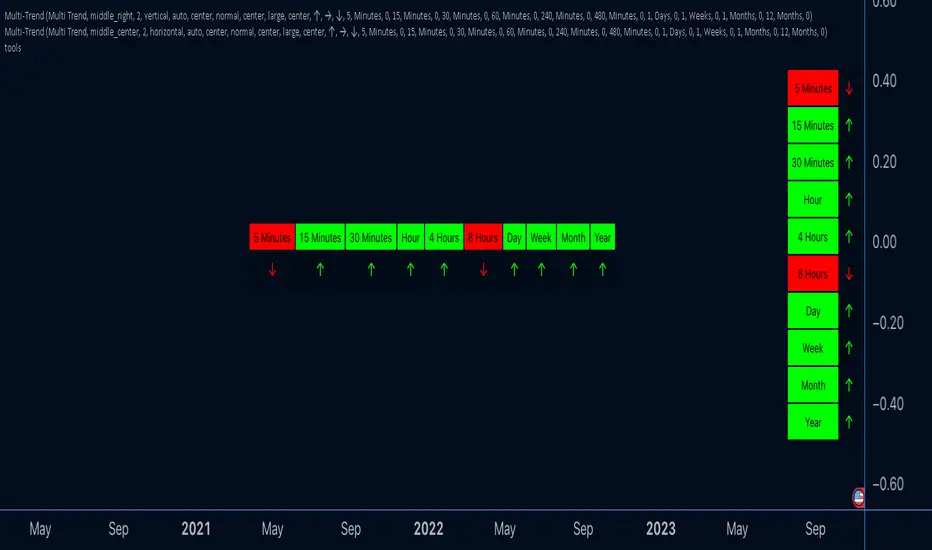
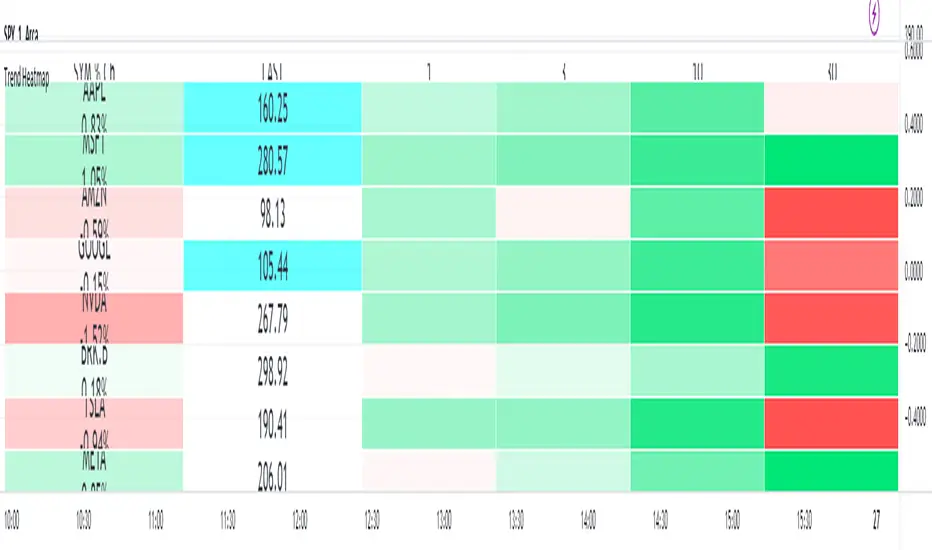
MultiSymbol Multitimeframe Supertrend TableThis is an initial release for four symbols and four timeframes.
Symbols and timeframes are customizable.
There is a gradient heatmap for the daily percentage change as well as another heatmap for each of the timeframe trends.
The two different forms of heatmap have separate settings so can have different colors and scaling if desired.
The trend used is Trading View's built in Supertrend and the gradient for the trend changes based on how far above or below that timeframe's trend the latest price currently is
It is recommended to place this in a separate pane and use it in the top left so it occupies the whole pane.
You can adjust the cell width and height to fit to your own chart window
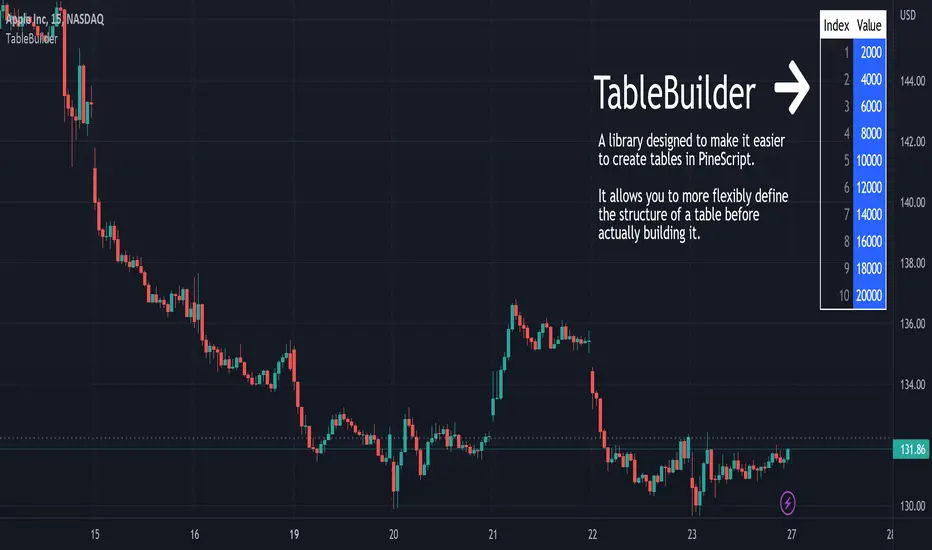
TableBuilderLibrary "TableBuilder"
A helper library to make it simpler to create tables in pinescript
This is a simple table building library that I created because I personally feel that the built-in table building method is too verbose. It features chaining methods and variable arguments.
There are many features that are lacking because the implementation is early, and there may be antipatterns because I am not familiar with the runtime behavior like pinescript. If you have any comments on code improvements or features you want, please comment :D

[-_-] 2D FractalsThe sole purpose of this script is to demonstrate what's possible to make with Pinescript, namely to display images (2D Fractals in this case).
The script consists of two functions: one that generates the values of a fractal and one that displays them (utilising table) with each cell being used as a "pixel". We can control the "resolution" of image, as well as choose one of three fractal types.

MA Band Distance Monitor'MA Band Distance Monitor' indicator is a simple tool for traders who rely on moving averages to make trading decisions. This indicator plots two moving averages of your choice (you can select the type of the moving average), and fills the space between them, creating a "band".
The indicator also generates a table that displays the current price distance from both the fast and slow moving averages, as well as the average of the two. This allows you to quickly assess the strength of the trend and potential entry or exit points.
In addition, the table also shows the average price distance from one to another MA and also the current distance between them, allowing you to compare the current price action to the historical average. This information can help you identify potential trend reversals and assess the overall health of the market.
*** Slow length input must be greater than fast length input, otherwise indicator will produce faulty results

Donchian Cloud Score w/ TableThis indicator contains a set of 5 Donchian channels (upper, lower, and basis plotted) defaulted to lengths of 25, 50, 100, 150, and 200. A set of conditions associated with the channels aims to determine ranging versus trending markets. Weights are given to these conditions accordingly, then tallied up to determine the "cloud score", ranging between -25 and 25. For the purposes of this indicator, a ranging market is determined by a cloud score between -10 and 10, while a positive trending market has a score higher than 10 and a negative trending market has a score lower than -10. This score is accompanied by altered bar color to reflect the score - gray for ranging markets, green for positive trending markets, and red for negative trending markets. Breaking of upper or lower Donchian bands is typically a good indication of a potential breakout. Having a weighted system for these conditions will provide more insight and layers of confirmation into a Donchian breakout trading strategy. The table will reflect these values through positive, negative, and neutral coloration.
The list of conditions and their associated weights for this indicator are as follows:
- Broke the 25-length DC (DC(25)) upper band in the previous 3 bars - +1 if true, 0 if false
- Broke the DC(50) upper band in the previous 3 bars - +2 if true, 0 if false
- Broke the DC(100) upper band in the previous 3 bars - +3 if true, 0 if false
- Broke the DC(150) upper band in the previous 3 bars - +4 if true, 0 if false
- Broke the DC(200) upper band in the previous 3 bars - +5 if true, 0 if false
- Broke the DC(25) lower band in the previous 3 bars - -1 if true, 0 if false
- Broke the DC(50) lower band in the previous 3 bars - -2 if true, 0 if false
- Broke the DC(100) lower band in the previous 3 bars - -3 if true, 0 if false
- Broke the DC(150) lower band in the previous 3 bars - -4 if true, 0 if false
- Broke the DC(200) lower band in the previous 3 bars - -5 if true, 0 if false
- DC(25) basis line above the DC(50) basis line - +1 if true, -1 if false
- DC(25) basis line above the DC(100) basis line - +1 if true, -1 if false
- DC(25)basis line above the DC(150) basis line - +1 if true, -1 if false
- DC(25) basis line above the DC(200) basis line - +1 if true, -1 if false
- DC(50) basis line above the DC(100) basis line - +1 if true, -1 if false
- DC(50) basis line above the DC(150) basis line - +1 if true, -1 if false
- DC(50) basis line above the DC(200) basis line - +1 if true, -1 if false
- DC(100) basis line above the DC(150) basis line - +1 if true, -1 if false
- DC(100) basis line above the DC(200) basis line - +1 if true, -1 if false
- DC(150) basis line above the DC(200) basis line - +1 if true, -1 if false

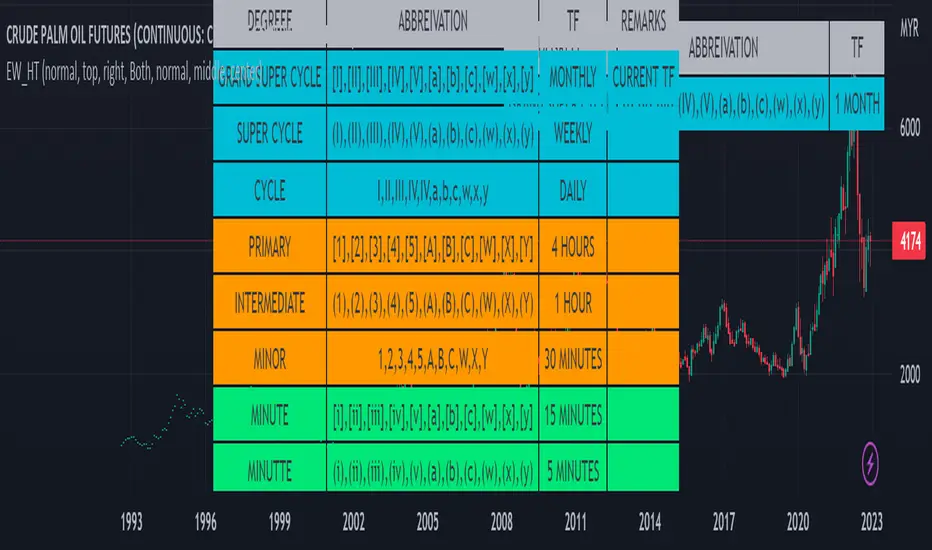
Elliot Wave Helper Table█ OVERVIEW
This indicator is intend to be helper to help Elliot Wave user to properly Elliot Wave tools according to correct degree such as 12345 or ABCWXY. The abbreviation changes according to timeframe.
█ FEATURES
1. Abbreviation degree adaptive to timeframe. Eg : Subminutte for 1 minute chart, etc.
2. Works for custom timeframe. Eg : Subminutte for 1 to 4 minute chart, etc.
3. Show reference table if necessary.
█ REFERENCE
Adaptive Elliot Wave Degree Chart
█ EXAMPLES / USAGES
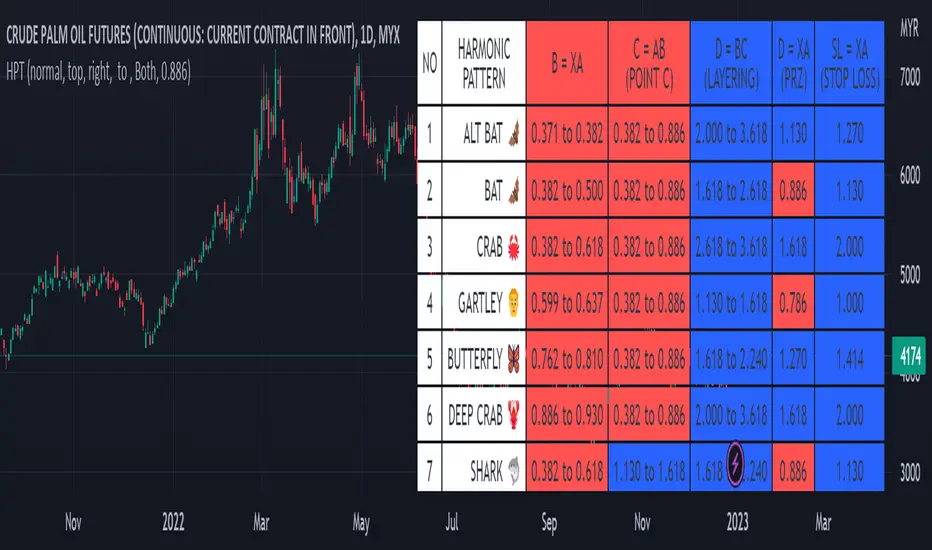
Harmonic Pattern Table UDT█ OVERVIEW
This table indicator was intended as helper / reference for using XABCD Pattern drawing tool.
The values shown in table was based on Harmonic Trading Volume 3: Reaction vs. Reversal written by Scott M Carney.
Code upgrade from Harmonic Pattern Table (Source Code) and based on latest User-Defined Type (UDT) .
As a result, code appeared more cleaner.
█ FEATURES
1. List Harmonic Patterns.
2. Font size small for mobile app and font size normal for desktop.
3. Options to show Animal name in text, emoji or both.
█ USAGE
Similar to Harmonic Pattern Table (Source Code).
█ CREDITS
Scott M Carney, Trading Volume 3: Reaction vs. Reversal
TableBuilderTableBuilder is a library designed to make it easier to create tables in PineScript.
It allows you to more flexibly define the structure of a table before actually building it.
Features:
Style inheritance: styles are inherited from Table, to Column, to Row, and then Cell.
Columns are useful for propagating/reusing style but they are not required.
Add rows with different numbers of cells. The resultant number of columns in the table will be determined by the max number of cells vs the number of defined columns.
Auto text color: Instead of having to set the font color for every cell, the color is automatically determined by the luminosity of the background color.
See the 'Demo' section of the code for an example.
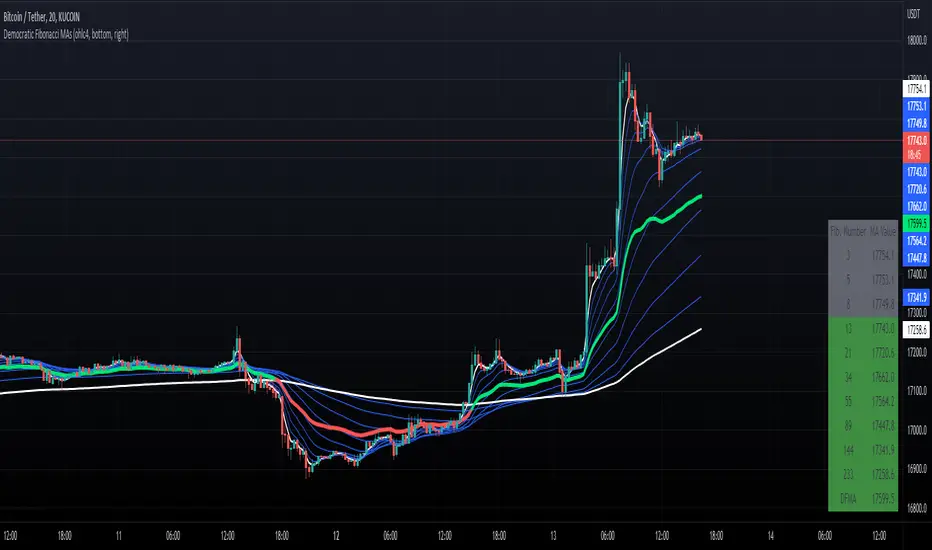
Democratic Fibonacci Moving AveragesWith this indicator, we have taken moving averages at Fibonacci lengths (3 to 233) as well as the average of these values, labeled the DFMA. Additionally, these values have been inputted into a table overlay. The cross of the FibMA(233) and the DFMA can be used as a signal for long or short.
The FibMA lengths of 3 and 233 are plotted in white by default, the FibMAs with lengths between 3 and 233 are plotted in blue by default, and the democratic line (DFMA) that averages these lines is plotted in green or red (depending on if the value is above or below the 233-length FibMA).
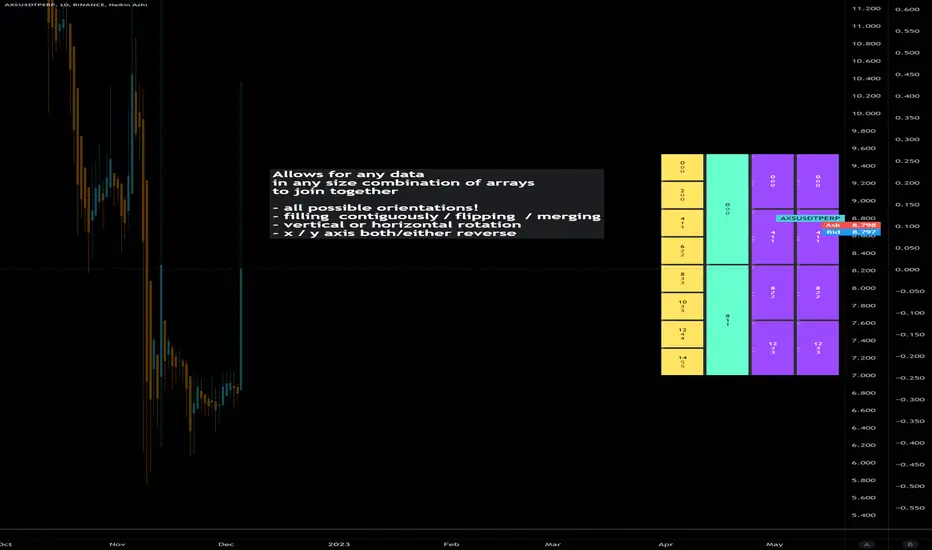
Dynamic Array Table (versatile display methods)Library "datTable"
Dynamic Array Table.... Configurable Shape/Size Table from Arrays
Allows for any data in any size combination of arrays to join together
with:
all possible orientations!
filling all cells contiguously and/or flipping at boundaries
vertical or horizontal rotation
x/y axis direction swapping
all types array inputs for data.
please notify of any bugs. thanks
init(_posit)
Get Table (otional gapping cells)
Parameters:
_posit : String or Int (1-9 3x3 grid L to R)
Returns: Table
coords()
Req'd coords Seperate for VARIP table, non-varip coords
add
Add arrays to display table. coords reset each calc
uses displaytable object, string titles, and color optional array, and second line optional data array.
Coin & market cap tableThis table was built specifically for the Crypto market.
It gives you a quick overview of the markets without having to scroll through numerous charts. The information is the overall markets daily change and the charts coins movement on a daily, weekly and monthly basis.
The weeks start on a Monday morning, the months start on the 1st of the month so this is last weeks data and last calendar months data.
It also gives you Bitcoins dominance. (Total2) you can change it to Bitcoin & Ethereum dominance (Total3)

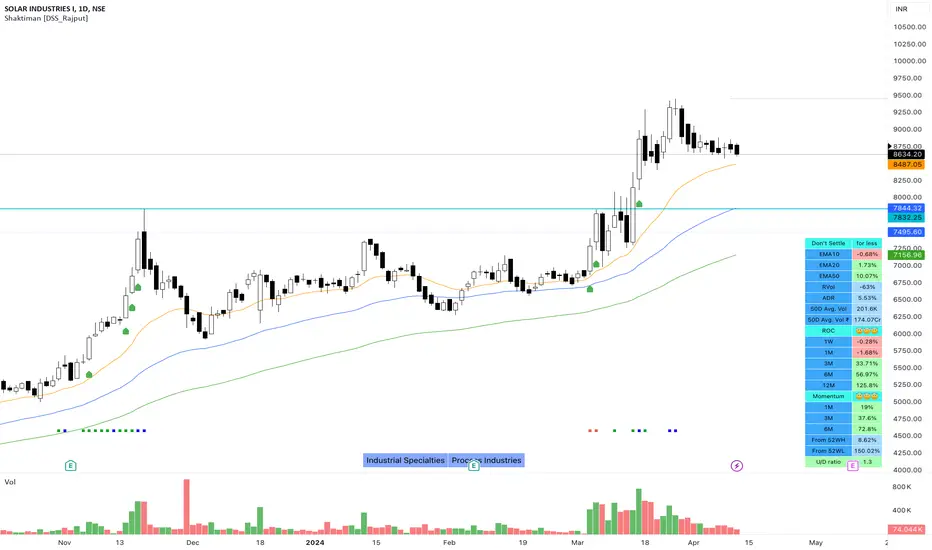
Shaktiman [DSS_Rajput]I'm a Momentum Trader, following the Indian markets, Mark Minervini and William O'Neil follower.
User Settings
Inputs tab
EMA option for Table - It compares the current price of the symbol to its key EMA's and calculates the rate of return to make it easier to track the performance of the symbol. It Helps you to identify how far the price is from its Key EMA's
ADDITIONAL TABLE DATA - It will allow you to use multiple performance data sets with your set of customizable inputs (You can change periods as per your requirements)
Show Inside Bar (IB): Allows you to add Inside Bar on your chart
Show NR4 (Narrow Range): Allows you to add an NR4 bar on your chart
Show INR7(Narrow Range): Allows you to add NR7 Bar on your chart
Distance_From_EMA_Table: Allows you to enable/disable the price difference with its key EMA's table.
ROC_Table: It compares the current price of the symbol to its past price and calculates the rate of return to make it easier to track the performance of the symbol.
Note that the Performance sidebar is not updated in real-time, while this indicator is, so on real-time charts.
The formula of the calculation is (Current value - Past value) * 100 / Past value, where Past value is: 1W, 1M, 3M, 6M, 1Y
Momentum_Table: It compares the current price of the symbol to its past lowest price of that period and calculates the %Gain of the symbol from the low of that period
Power_Play_Candidate: It will show the power play candidate, similar to IBD, It merely qualifies for Power_Play.
You need to wait for the Right Entry point. It will give you 8 Week Range.
According to IBD, it should move 100%+ in less than 8 weeks. You can modify your criteria by changing the percentage gain.
U/D Ratio: IBD defines the U/D ratio as "A 50-day ratio that is derived by dividing total volume on up days by the total volume on down days.
A ratio greater than 1.0 implies positive demand for a stock"
UpVol criteria: close>open and vice versa for DownVol
Rvol (Relative Vol): Percentage volume change (compared to daily average volume)
ADR : It allows you to add the Average Daily Range to the table.
Show 50D Avg. Vol & Avg. Vol rupee: It allows you to add 50-Day Avg. Vol and 50-Day Avg. Vol rupee.
Show_Bull_Snort: Allows you to add bull snort to your chart and style the bar.
Bull Snort is the work of Oliver Kell. For more info about Oliver kell, check youtube videos of Oliver Kell.
Normal Moving Average: Plot 4 Simple, Exponential, and Weighted Moving Averages. (You can choose an option between EMA/SMA/WMA)
Fixed Moving Average : Plot 4 Simple, Exponential, and Weighted Moving Averages. (You can choose an option between EMA/SMA/WMA)
Plus Point: It will not change its value when you switch to a different timeframe. Let's say you applied Fixed Daily 20MA, on the intraday chart.
It will not change its value and It will give you much more clarity that, from where the price is bouncing from 20MA. Explore it (You will definitely love it!)
Fixed Moving Average : Plot 2 Simple, Exponential, and Weighted Moving Averages. (You can choose an option between EMA/SMA/WMA)
Plus Point: It will not change its value when you switch to a different timeframe. (It's like Plotting 10 Week Line on Daily Chart & Intraday Charts)
Numbers of weeks to show High & Low: It will add data to the tables and also add 52 weeks of High & Low lines on the charts.
(Number of weeks is customizable, you can change as per your requirements.)
Style tab
You can modify the style and color of any of the inputs except table color.
Conclusion
If you like this script, click on Add to favorite indicators, so that you can easily add this indicator from your favorites tab right away.
Hope you find this useful. Please leave any questions you have in the comment section and I'll be happy to answer them.
Thanks!
ATR / Volatility / Leverage [JoseMetal]============
ENGLISH
============
- Description:
This is a utility indicator, it prints a table with ATR for 3 custom timeframes, using the ATR of basis, it calculates volatility (%) and a recommended leverage depending on your risk settings.
I use this tool to determine the leverage for each asset and keep the same risk management for all of them.
- Visual:
It shows a table with ATR, volatility and leverage for 3 timeframes.
For each timeframe it also prints 2 periods, short and long, also customizable, so you can determine the range.
- Customization:
You can customize up to 3 different timeframes, ATR short and long length, as well as a multiplier.
There's a risk setting that you should tweak depending on your way to trade.
Everything else customizable (as usual in my scripts), colors, indicator settings etc.
- Usage and recommendations:
Default settings are my own, feel free to tweak them as you wish, i usually trade on 4H using 1-2% of my account balance per trade with low leverage, so you probably want to increase the risk setting, that's also extremely recommended if you trade forex and metals, because i trade crypto mainly.
Enjoy!
============
ESPAÑOL
============
- Descripción:
Este es un indicador de utilidad, muestra una tabla con ATR para 3 temporalidades personalizables, usando el ATR de base, calcula la volatilidad (%) y un apalancamiento recomendado dependiendo de tu configuración de riesgo.
Yo uso ésta herramienta para determinar el apalancamiento para cada activo y mantener la misma gestión de riesgo para todos ellos (no tiene sentido ir a 5x en BTC y 5x en ORO, por ejemplo... ésta utilidad resuelve ese problema).
- Visual:
Muestra una tabla con el ATR, la volatilidad y el apalancamiento para 3 temporalidades.
Para cada temporalidad también muestra 2 rangos de periodización, corto y largo, también personalizables, para que puedas determinar de un vistazo los rangos en los que se mueve.
- Personalización:
Puedes personalizar hasta 3 temporalidades diferentes, la longitud del ATR corto y largo, así como un multiplicador.
Hay un ajuste de riesgo que debes ajustar dependiendo de tu forma de operar.
Todo lo demás es personalizable (como es habitual en mis scripts), colores, configuración de los indicadores, etc.
- Uso y recomendaciones:
Los ajustes por defecto son los míos, siéntete libre de ajustarlos como desees, yo suelo operar en 4H utilizando el 1-2% del saldo de mi cuenta por operación con un bajo apalancamiento, por lo que probablemente quieras aumentar el ajuste de riesgo, eso también es muy recomendable si operas fórex y metales, porque yo tradeo cripto principalmente.
¡Que lo disfrutes!

OHLC-TablesENGLISH VERSION
The command shows the opening-high-low-closing-change values of that day based on the previous value in each period.
You can set the clock in any time zone you want.
You can use the indicator by adapting it wherever you want on your screen. You can adjust its position. Top-Left-Middle Left- Bottom Left/ Top Right-Middle Right- Bottom Right.
Although it is not a command with a Buy-Sell indicator, its user-friendliness and convenience were taken into account while developing it.
The purpose of the indicator is to allow you to consider the values while focusing not only on the chart you are watching.

CFH | RSI-SRSI tableShows RSI and SRSI values on multiple timeframes, highlights oversold and overbought
Timeframes and colors are customizable
/V1llager/

Volume Price and FundamentalsVolume Price and Fundamentals indicators contains 4 exponential moving averages based upon Fibonnaci numbers as period (8, 21, 55 & 144) with crossovers and crossunders.
It also contain a table for volume and 50 Day Avg. Volume, Relative volume, Change in Volume, Volume Value, Up-Down Closing Basis days in last 50 days, Volume ratio (U/D Ratio) on last 50-day Up / Down days and along with fundamental analysis table with various Fundamental Analysis parameters and QoQ & YoY comparison basis for better investment decision making.
