bg_FibCastVersion 1.0
A simple script to place horizontal lines where fib levels are, over a given period of candles, on a specified or charted time-frame. Includes the option to fib-retrace a "sub-zone" or the space between Fibonacci levels.
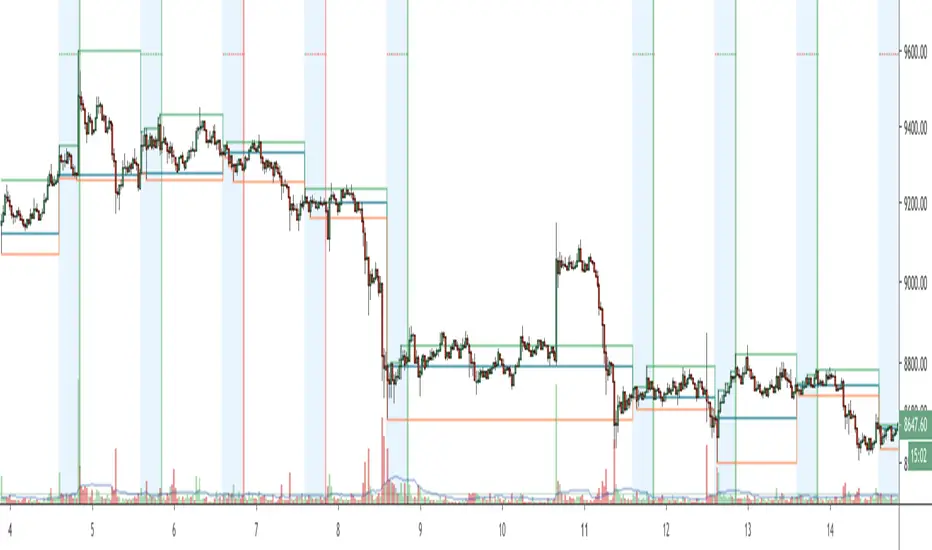
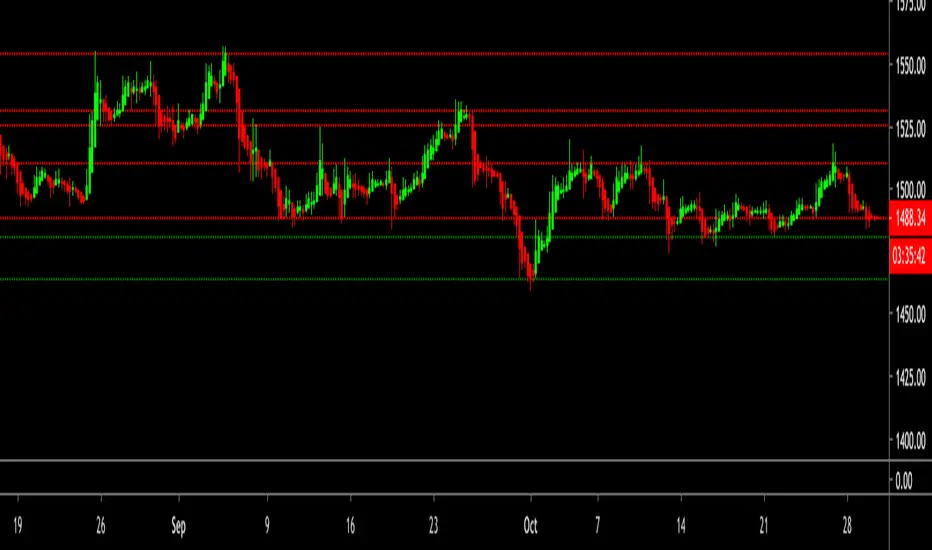
In The Depicted Example Above:
- Large white Fibonacci Lines from 377 Daily Candle Range, Gray "Sub-Fib" levels are plotted in "Zone 4" of the 377 1D Fib. Re-trace. (Zone 4 is between the 0.5 and 0.618, Zone 3 is between 0.618 and 0.786, etc.)
- Optional 1.618 Fib Extension is available for the main Fibonacci indicator, but is not shown here (Disabled/Hidden).
- Supports multiple time-frames, which is also depicted above. (377 Daily Candles used on 12-Hour chart.)
Support

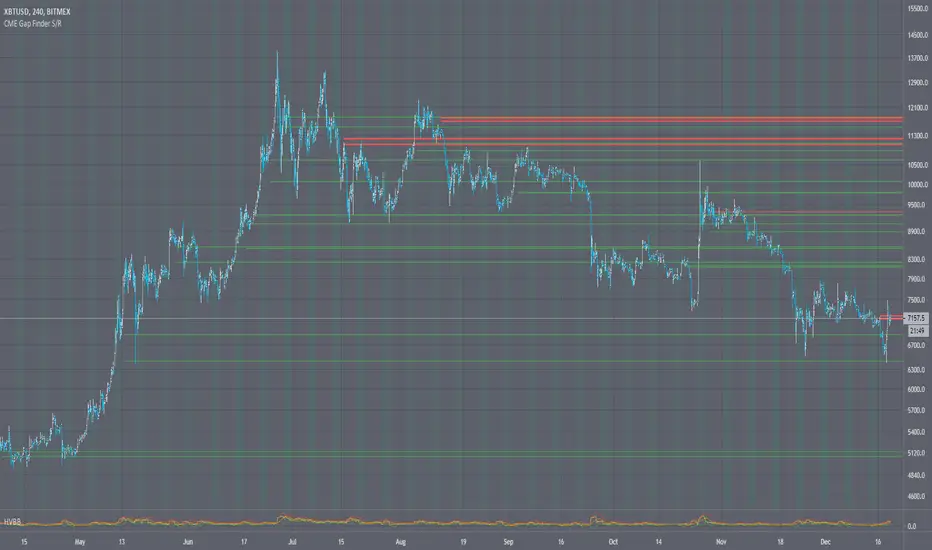
CME Bitcoin Gap Finder Orderblock Support ResistanceCME Bitcoin Gap Finder Orderblock Support Resistance
Intro
I had a backlog of scripts to release, and so everyone is getting some Christmas gifts early!
I have been watching CME gaps and how they relate to BTC for over a year now. I find they make good orderblock support/resistance areas.
Description
There is a limitation to how many lines I can draw with the new pine script functions. So for instance if you want to see the gaps from 2018 I have included a date range selector (similar to how a backtest works). This way you can only display the gaps from the dates ranges you want to see.
There's also the ability to check for gaps on the daily, 12h, 4h, and 1h charts. I recommend using 12H. But know that depending on what period you choose it will effect the size of the gaps, so experiment and see what works for you.
Lastly I included the ability to have background highlights whenever CME is closed on the weekend, just for visual reference.
You can use this indicator on any BTC ticker, and it will show you where the CME gaps are (without having to switch/reference the CME chart).
👍 We hope you enjoyed this indicator and find it useful! We post free crypto analysis, strategies and indicators regularly. This is our 74th script on Tradingview!
💬Check my Signature for other information
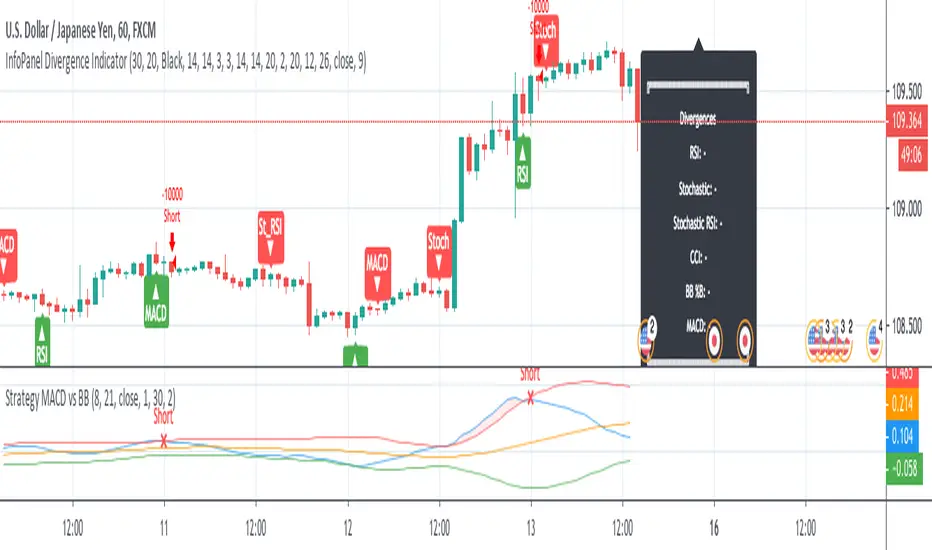
Strategy MACD vs BBStrategy based on MACD and Bollinger Bands, where BBs are calculatend from macd signal.
Strategy doesn't open at breakout of bands but it waits for a pullback.
Upper and lower bands are used as resistance and support.
There are various parameters that can be optimized.
I have also a study with alerts.
Please use comment section for any feedback or cointact me if you need support.
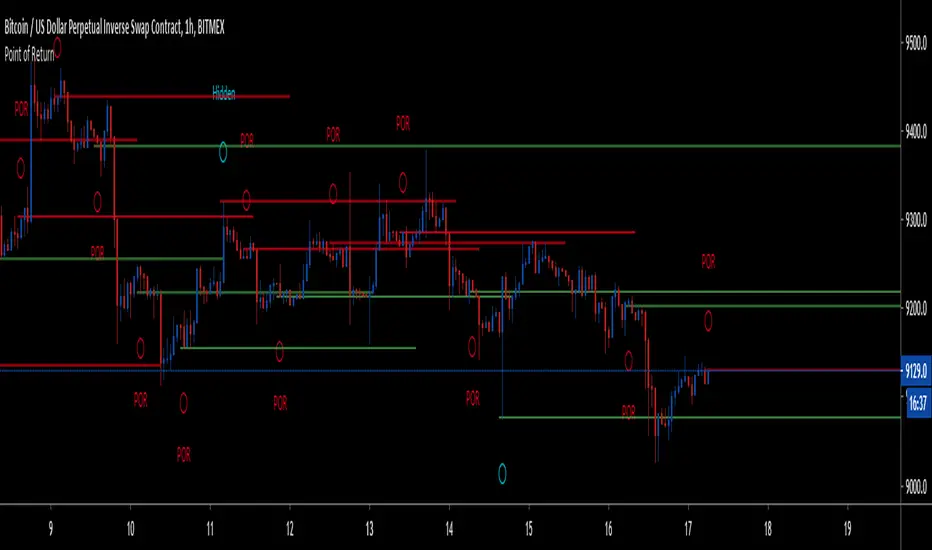
Point of Return - Dynamic Price Reaction RangesThis is one of the many parts of my upcoming strategy, and used by me on daily basis.
This indicator incorporates various price action models and candlestick patterns, and combines them together to form a price point which is highly reactive in nature.
In the background it works on multitude of permutations and combinations to calculate the price point which tell us exactly where price will most likely react in the future, removing rooms for errors while drawing support and resistance .
This can be used on multiple ways:
1. Chop indication - As soon as the indication pops up, it marks a price which is most likely start of a chop zone and break from either direction marks end of the chop zone.
2. Point of Return - As soon as a the price moves away from the chop zone, it will most likely return to the indicated price before moving in the direction of the break, giving us high RR trades.
3. Dynamic Support and Resistance - This also acts as a dynamic support and resistance and apart from your already established S/R you can incorporate these price points as your decision maker or breakers.
PS : This is not to be used as a Buy/Sell signals and is only should act as confirmation of what you already know and to gauge the market sentiments.
There is a hidden easter egg on this page and chart which gives you preview of the upcoming indicator. Have fun finding out.
You can reach me here on my DM for more details.
Below are the few snaps from different timeframes:
1. 4H XBTUSD -
2. 2H XBTUSD -
3. 8H XBTUSD -
Stock Analysis SoftwareStock Analysis Software is a full trading setup and style that is meant for swing trading stocks, but can also be used for Forex, cryptocurrencies, indices and commodities. Whatever your choice of trading style (Intraday, Scalping, Swing trading, Investing) or trading instrument is (FX, Futures, Cryptos, Stocks) I can tailor it for you specifically. For example if you want to use it for trading Forex intraday I will show you how to use it for that.
The software consists of 11 indicators, 7 are custom and 4 are common and well known indicators available on Tradingview. The system itself is part software and part learning my specific pattern finding techniques. There is no one without the other. This is a complete system
This trading system is something I have developed over the last 10 years through extensive research and development and is now available on this platform.
The indicators used are mostly screening for trend breakouts, support and resistance, specific candle patterns, overextended, volume spikes and more.
This is a system that can be taught easily if one is motivated to learn.
The setup includes a video guide and a live one-on-one full breakdown on how to use it to your benefit.

Heatmap - Support & Resistance (Volume Clusters)Heatmap - Support & Resistance (Volume Clusters)
The Heatmap is based on the real traded volume.
The Heatmap can help identify the levels of Support and Resistance , thus validating other indicators' Oversold or Overbought conditions.
Small blocks don't have much significance. On the other hand, bigger and brighter ones would mean strong levels of Support or Resistance .
Alerts are available to be set to fire whenever the Support or Resistance levels are reached.
Related tools:
• Volume Delta
• CVD
• Counters Ratio

Fibonacci BandsFibonacci Bands are derived from Fibonacci ratios expansion from a fixed moving average.
These bands help traders find key areas of support and resistance . "Fibonacci bands" are
computed by adding a Fibonacci ratio distance (Up and Down) from a "key moving" average
(21, 34, 89 periods). An 8 period average of "True range" is computed. The multiples of
Fibonacci ratios of this range are added to the fixed moving average to compute Fibonacci
Bands
One of the best ways to find trend reversals is to watch the price action near the extreme bands
(both lower and higher). Markets tend to reverse when prices trade outside of the band for a
few bars and again trade inside the bands. After reversals, markets also tend to trade from one
extreme band to the other end (opposite) of the extreme bands.

Scalp Master V1.1This version has added support and resistance to help traders identify the best entry and exit points.
Also, we included a linear regression band to identify the last period's trend, the prices would normally swing between the upper and lower dotted white line and it gives a good starting point for traders to identify possible bounces or rejection moments of the price.

Gap Automatic Retrocess LevelsThis Script detects Bearish / Bullish GAP at market opening 09:30 am NY and automatically traces backward levels, of which 2 are configurable at your discretion.
Pivots With CPR,Moving Average and VWAP - by AnanthThis indicator is a combination of Pivot points with CPR, Moving Average and VWAP.

NYSE Session for 24/7 marketsThis script is used for analyzing the correlation between 24/7 markets with regards to the price action during NYSE session. Defaults to showing daily session open/high/low but there is the option to show the weekly session data.
Daily Progressive Donchian ChannelsThis is the first script that I publish.
His main goal is to help identify the extreme of the day and to compare the VWAP with the average DPDC to find meaningful resistance and support.
BBPivotIt can helps you to see BB pivots . It's based on bollinger bands .
Best Settings: (20,3) - (50,2)
Cheers :)

K2 SRThis indicator is used to automatically plot the strongest support and resistance points that are nearest to the current price.
This indicator works on all assets and all time frames so it is applicable to all traders whether you are a scalper, intraday or swing trader.
Additionally, you can adjust the settings to have the indicator scan for closer or farther support and resistance points to tailor specifically to your trading strategy.
Support Resistance IV FinderUseful to find Support/Resistance levels in chop markets.
Developed on 15min BTCUSD chart
On different timeframes/trading pairs it must be used and tweaked with EMA Slope and Inverse Volatility for optimal results
Scroll back on the chart to load older lines
Swing Trade Pros - Support/Resistance LevelsThe STP Support/Resistance Levels accurately detect the key levels by identifying large swings/pivots in historical price action automatically. It identifies price levels where historically the price reacted by either bouncing or reversing the direction. Prior price behavior at these levels can leave clues for future price behavior. These tops and bottoms in price action show where lots of buyers or sellers came into the market and might act as future levels of support or resistance. By default, the code detects the last 3 significant swing highs and the last 3 swing lows. When price action breaks above the resistance line the color changes to green because it's now support. Likewise, when the price action breaks below the support line the color changes to red because it's now resistance.
Trendlines 2x +Copy of "Trendlines - JD" script by Duyck, which draws Trendlines from the pivot points in the price chart.
I have simply Doubled the amount of Trendlines, so now there are;
A Primary set of Trendlines at a higher lookback length and Thicker Line Width
and
A Secondary set of Trendlines at a Lower lookback length and Thinner Line Width
The default values work well when comparing multiple time frames at 3x time difference, play around with these values for other x time variations
I have also simplyfied the Trendline Extension Function to make it more user friendly
Please use the Alerts with caution as the Trendline Break function still needs to be optimised
Also included are Trend Candles to color the bars according to momentum, Trencandles script is a copy of UCS_Trend by ucsgears

[ALL-IN-ONE] Algorithmic S/R and Pivots and Long Term LevelsHello my trading padawans.
Hope you're all having a blast
Here's the invite-only script of the week. The ALL-IN-ONE saga continues with another script.
This time, I compiled a lot of algorithmic supports and resistances (S/R) - to be used with any indicators out there.
Those S/R are universal and work with all asset classes (FOREX, CRYPTO, INDICES, STOCKS, COMMODITIES, ...)
No one can predicts which S/R will stop a move - generally - the high timeframes S/R + the SMAs with a big input value - work as strong walls often forcing the candles to retrace a bit short-term.
At Today's post (October, 25th 2019 - 12 pm UTC-4), we see how useful they were, to identify how high BTC/USD could go before retracing.
I. 💎 SCRIPTS ACCESS 💎
1.🖐️ Access can only be requested through my website.
2.🖐️ My website URL is in this script signature at the very bottom (you'll have to scroll down a bit and going past the long description) and in my profile status available here : Daveatt
3.🖐️ A tutorial article/video will be provided on those sub mentioned links + Tradingview
4.🖐️ You obviously can contact me directly for more information
II. 🔎 ALL-IN-ONE Supports and Resistances 🔎
You can display the algorithmic S/R, and/or pivots, (not finished yet) and the long terms levels.
For the 3 types of S/R, I pre-selected those that I think are the most relevant and useful for everyone. Please let me know if you'd like me to add/remove some.
All those listed by default are important and provide a MAP for a trader.
They give great take profits zones, levels where it's better to wait for a pullback before entering.
2.1 👁️🗨️ S/R mode 👁️🗨️
Each type of S/R can be displayed or not.
2.2 📱 Mobile optimized display 📱
Preview : imgur.com I posted 2 images there
The script is made using the newest version of Pinescript, and displaying small labels for every support/resistance.
✨ This will come in handy for mobile users - they'll get nice looking labels displayed at the right of their chart.
Each S/R type have its own labels and label position. The script users can activate/deactivate them at will
Let's review quickly each one.
2.3 Algorithmic SMAs
I cherish, love, sometimes despite them, but they're very relevant for all asset classes. The tool displays as many relevant algorithmic and generic SMAs that I could think of.
The indicator lists about 18 different SMAs in multiple timeframes.
2.4 Pivots
7 pivots are displayed (S1/S2/S3/P/R1/R2/R3)
You can choose one of 4 pivot point types:
- Traditional
- Woodie
- Fibonacci
- Camarilla.
The fun doesn't stop here. You can also select a timeframe between Daily/Weekly/Monthly/Yearly for those pivots.
For INDICES, for example, I use a lot the daily Traditional Pivots.
2.5 Long Terms Levels
Display by default the highest/lowest weekly/monthly/quarterly/monthly levels.
The scripts user can chose to select the previous highest/lowest also.
-------------------------------------------------------------------------------------------------------------------------------------
If you have any doubts or questions, please hit me up directly or ask in the comments section of this script.
I'll never claim I have the best trading methodology or indicators.
You only will judge and I'll appreciate all the questions and feedback you're sending my way.
They helped me a ton for developing indicators based on all the requests I received.
May the force 💪 be with you all 🥳.
Dave

Support and Resistance lines by PeterOAs all seasoned traders know, there's no better trading tactics than Price Action. Price Action understood not as some fancy candlestick formations, but as horizontal lines called Support and Resistance, generated by the market in the past - where the price reacted and reversed, showing which levels were strongly defended by traders around the world.
Price very often reverses again and again from these lines and once it finally breaks through them, very often returns for a retest before continuing its journey, very juicy for the trader. Support becomes Resistance and Resistance becomes Support - surely you have heard those rules before.
Support and Resistance lines are a map to the market. They are best entry spots out there. You might want to add more tools and techniques to your trading analysis, but truth is, moves will always start on some Support or Resistance line. Very often to the tick. People not seeing these lines trade blindfolded.
Difficulty is when it comes to removing those lines. You cannot hold them forever, as the chart would get completely blurred. So this script not only automaticaly draws lines, but also deletes those which become irrelevant. It also shows lines created by 4 tiers of pivot points, by default: 2 bars, 10 bars, 60 bars and 240 bars. So on one-minute chart it would present even 4h Support and Resistance levels, perfect for finding entries even for scalpers. All configurable.
I mostly trade Forex, but S/R rules are applicable to all markets out there.
This is invite-only script, PM me for access.

Opening Range Breakout- ORB Large Price Targets
During this period, you want to identify the high and low of the day. In addition, you will also want to account for the pre-market highs and lows, as these levels will often act like a magnet on price action after the bell rings.
Since the opening bell is associated with big trading volumes and volatility , this time of the session provides many trading opportunities. In this manner, traders use the opening range to set entry points on the chart and to forecast the price action for the day.
Add on to the ORB Script for Higher Price Targets 700% to 1061%

Opening Range Breakout- ORB Higher Price Targets
The opening range is simply the high and low of a given period after the market opens. This period is generally the first 30 minutes or the first hour of trading.
During this period, you want to identify the high and low of the day. In addition, you will also want to account for the pre-market highs and lows, as these levels will often act like a magnet on price action after the bell rings.
Since the opening bell is associated with big trading volumes and volatility , this time of the session provides many trading opportunities. In this manner, traders use the opening range to set entry points on the chart and to forecast the price action for the day.
Add on to the ORB Script for Higher Price Targets 300% to 661%

SFL Levels - levels that matterThis is an indicator that gives you an easy way to display the following significant levels on a chart:
- The daily open
- The weekly open
- The monthly open
- Yesterday's high and low price
- Last week's high and low price
These levels often function as natural support and resistance and because of that, it's relevant to have them on your charts.
Every type of level can be enabled or disabled, allowing you to easily customize for the levels you want to see.
The colours and line types can also be changed as you wish.

