Cyatophilum SuperTrend [BACKTEST]The SuperTrend Indicator and Strategy built upon Average True Range.
- Backtest Version -
>> READ HOW TO USE HERE <<
Supertrend

Self-Adjusting SuperTrendWhat is this tool?
This is an implementation of the well-known SuperTrend indicator that can adjust parameters on the fly to achieve a better profitability.
The algorithm was borrowed from Profitable SuperTrend and connected to the basic SuperTrend implementation. So, now it will switch parameters automatically without any manual work required.
Alerts
The same alerts as for the basic SuperTrend + special alert to notify user about parameters switching.
Profitable SuperTrend indicator can be found here:
SuperTrend indicator can be found here:
Good luck!

Williams Vix Fix paired with Supertrend HeatmapThis script shows my mod of the powerful Williams' Vix Fix indicator paired with a modified Supertrend Heatmap, originally created by Daveatt.

Supertrend MTF Heatmap V2Hello traders and aspiring Pinescripters
You might remember this script Supertrend-Heatmap-Multi-timeframes/ ?
A follower, asked me in a comment to do a version where YOU guys can select the timeframes
Well... what follower asks, follower (sometimes) gets. I'm not Santa Claus but this is Christmas with a few months in advance (#oh #oh #oh)

Supertrend MTF LAG ISSUEThis script based on
we all use Super trend but it main issue is the lag as it buy too late or sell too late
using Deavaet study of Heat map MTF we can do a little trick
if you look on his study you can see that major signal for example will happen in the time frame before it happen at larger time frame
so in this example if signal at MTF 30 min and signal at MTF 60 min happen at the same time at 2 hours or 4 hours candles then this signal are more likely to be true then random signal at each time frame specific.
since we use shorter time frame on larger time frame we can remove the lag issue that make supertrend not so effective
In this example I set the signal to be MTF 30 +60 om 2 hour TF , can be good also for 4 hour candles..
So you get the signal to close inside the larger candle
now if you want to make on even shorter TF then change the code to 15 and 30 MTF on candles on 1 hour
or 1 and 5 min on 30 min or 15 min

SUPERTREND ATR WITH TRAILING STOP LOSS## THIS SCRIPT IS ON GITHUB
## MORE BACKTEST
SuperTrend is a moving stop and reversal line based on the volatility (ATR).
The strategy will ride up your stop loss when price moviment 1%.
The strategy will close your operation when the market price crossed the stop loss.
The strategy will close operation when the line based on the volatility will crossed
The strategy has the following parameters:
+ **ATR PERIOD** - To select number of bars back to execute calculation
+ **ATR MULTPLIER** - To add a multplier factor on volatility
+ **INITIAL STOP LOSS** - Where can isert the value to first stop.
+ **POSITION TYPE** - Where can to select trade position.
+ **BACKTEST PERIOD** - To select range.
## DISCLAIMER
1. I am not licensed financial advisors or broker dealers. I do not tell you when or what to buy or sell. I developed this software which enables you execute manual or automated trades multiple trades using TradingView. The software allows you to set the criteria you want for entering and exiting trades.
2. Do not trade with money you cannot afford to lose.
3. I do not guarantee consistent profits or that anyone can make money with no effort. And I am not selling the holy grail.
4. Every system can have winning and losing streaks.
5. Money management plays a large role in the results of your trading. For example: lot size, account size, broker leverage, and broker margin call rules all have an effect on results. Also, your Take Profit and Stop Loss settings for individual pair trades and for overall account equity have a major impact on results. If you are new to trading and do not understand these items, then I recommend you seek education materials to further your knowledge.
**YOU NEED TO FIND AND USE THE TRADING SYSTEM THAT WORKS BEST FOR YOU AND YOUR TRADING TOLERANCE.**
**I HAVE PROVIDED NOTHING MORE THAN A TOOL WITH OPTIONS FOR YOU TO TRADE WITH THIS PROGRAM ON TRADINGVIEW.**
## NOTE
I accept suggestions to improve the script.
If you encounter any problems i will be happy to share with me.
+ Authors: @exit490
+ Revision: v1.0.0
+ Date: 5-Aug-2019
+ Pinescript version: 4
## LICENSE
Copyright 2019 Mauricio Pimenta / exit490
SuperTrend with Trailing Stop Loss script may be freely distributed under the (../LICENSE).

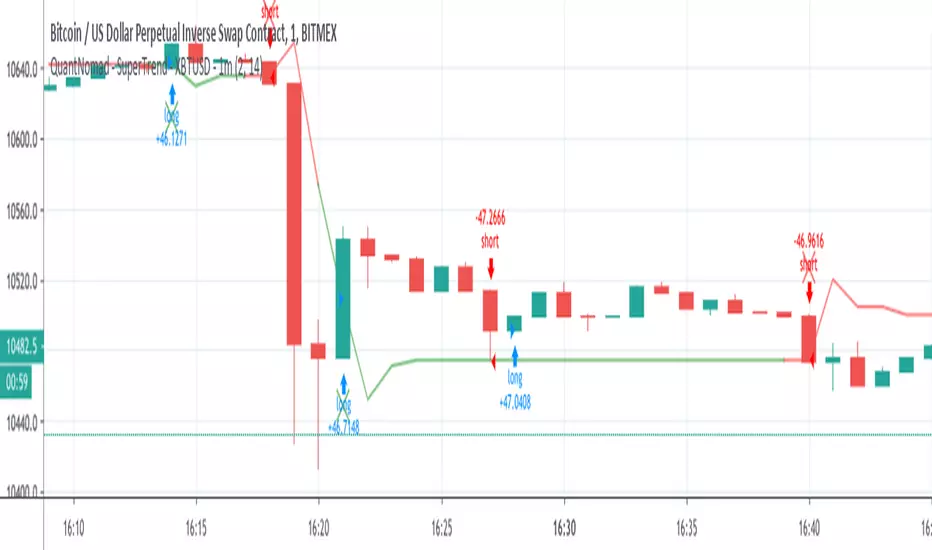
QuantNomad - SuperTrend - XBTUSD - 1mInteresting performance for Super Trend strategy for XBTUSD 1m chart.
Params: ST Mult: 2, ST Period 14.
Performance: 144% profit, 1988 trades, only 41% prof, 2.04% dd , 2.51 Sharpe.
On its own, it might be not a very good strategy, but the big amount of trades allows you to add more filters and improve it.
And remember:
Past performance does not guarantee future results.
Algorithm Builder (Signal version)Gentlemen traders
As promised, here's the Algorithm Builder (Signal Version) that is an alternative version of that previous indicator : Strategy-Builder-Crypto-Single-Trend-Plots/
This one was quite successful and already 11 person bought for me which is unbelievable. Thank you so much guys for your appreciation of my work
The script of this present post is still invite-only because it required years in the making (it's the fruit of all my errors and trials while trading for the past 7 years and when developing trading bots for traders professionally)
What's the Algorithm Builder?
Simply put, the indicator will detect the confluence/convergence of multiple unrelated indicators and alert you when the ones YOU selected will be in the same direction. (if you didn't understand this it's because I'm french)
For example, let's say you select a MM cross and MACD, whenever the MM cross will be green/bullish AND MACD green/bullish also, you'll get a nice .... wait for it..... green/bullish /diamond. Starting to see what I meant before now :)
Not sure if I should go as far as introducing the other example but let's go for it. Still, in the same spirit, a confluence of red/bearish MM cross and red/bearish MACD will give .... (finish the sentence and you'll get my appreciation. hint: the color of the diamond will be red)
So what's cool about it now ... or I should say even cooler... even more awesome (Barney Stinson, please hive five me for this tool...) is that it can be plugged in a single click to a complete Backtest engine
I inspired myself greatly from the Pinescripters Backtesting-Trading-Engine-PineCoders/ but had to make changes to adapt it to my tool.
It took me a few days of work and I'll share it also tomorrow so please stay tuned and give me a follow so that you'll be updated
In the Backtester itself, I added some features like :
- Stop-loss based on supertrend
- Hard Exit based on indicators used by the Algorithm Builder
I just made it more relevant for my indicator
Performance sir?
The period selected for the screenshot below is the last 3 months
Here's a preview of what you should expect tomorrow as well imgur.com
There isn't a BEST configuration for the tool. I made one that matches my psychology and capital. You'll have to find yours by playing with it or asking me for a bit of help if you're lost
Will require a bit of work but could be very worth it in the end :)
What's next sir?
I'm perfectly aware that the indicator doesn't give a lot of signals and that's because it's an entry-level version of all the Algorithm Builders I'm selling now and will be available on my website by end of August (along with the website itself)
More advanced versions already made allow to :
- get more entries
that one is the best addition, in my opinion, it multiplies the gains (and losses :P) as it allows some orders pyramiding and to reinforce a position if the trend is very strong. You won't have to do anything, just to wait for the alerts by email/sms from TradingView
- multiple take profit levels
- connected to systems like Autoview/ProfitView to automatize even more your trading and send those signals to your broker directly (I will strongly advise starting with a demo account for 1 week or 2 here, I don't want you to burn your capital if any unexpected bad event will happen)
- screener
If you're interested please message me. I can develop your custom indicator/strategy/backtest/automatic system or if you're ready the take the leap of faith and try this indicator or the more advanced versions
And before I get asked, yes this is the tool I use for my own trading as initially, I made it for me. Now sharing a bit of my work (and too much of my life) with the community
PS
____________________________________________________________
Feel free to hit the thumbs up as it shows me that I'm not doing this for nothing and will motivate to deliver more quality content in the future.
- I'm an officially approved PineEditor/LUA/MT4 approved mentor on codementor. You can request a coaching with me if you want and I'll teach you how to build kick-ass indicators and strategies
Jump on a 1 to 1 coaching with me
- You can also hire for a custom dev of your indicator/strategy/bot/chrome extension/python
- if you like my work and wants to buy me some coffee :
- BTC TipJar: 3MKDve7stWTe1io99oFxeQXvP8XB4zCQ8m
- LTC TipJar: MC5oeBAhw9BLqyi65TR3J1Lid8io9uHADw

QuantNomad - SuperTrend - TSLA - 1mInteresting performance for Super Trend strategy for Tesla ( TSLA ) 1m chart.
Params: ST Mult: 3, ST Period 120.
Performance:61% profit, 637 trades, only 33% prof, 4.84% dd , 0.4 Sharpe.
On its own, it might be not a very good strategy, but the big amount of trades allows you to add more filters and improve it.
The strategy is not bad both with "when" params when strategy executed on open of next bar and with stop orders when strategy enters on exact Super Trend level.
You can comment/uncomment lines in the code and switch from one approach to another.
And remember:
Past performance does not guarantee future results.


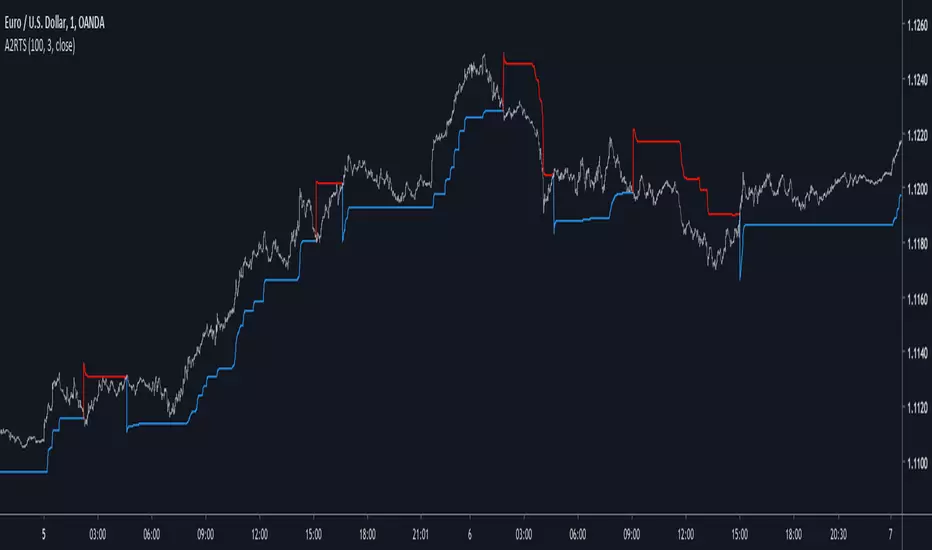
Adaptive Autonomous Recursive Trailing StopIntroduction
Trailing stop are important indicators in technical analysis, today i propose a new trailing stop A2RTS based on my last published indicator A2RMA (1), this last indicator directly used an error measurement thus providing a way to create enveloppes, which provide a direct way to create trailing stops based on highest/lowest rules.
The Indicator
If you need a more detailed explanation of this indicator i encourage you to check the A2RMA indicator post i made, parameters does not differ from the supertrend, thus having a length parameter and a factor parameter who is here described as gamma , gamma control how far away are the bands from each others thus spotting longer terms trends when gamma is higher.
On BTCUSD
Something worth mentioning is that the indicator sometimes behave like my MTA trailing stop indicator (2) who is closer to the price when a trend persist thus providing early exit points, however A2RTS behave a bit better.
Price can sometimes break the trailing stop, this can be interpreted as a support/resistance or just as an exit point, the support resistance methodology on trailing stop is not the most recommended.
Sometimes it is recommended to have an higher length rather than an high gamma like in this case for INTEL CORP, below gamma = 3 and length = 20
The microprocessor market like to use higher length's instead of higher gamma's , A2RMA is a non-linear filter, this would explain such behaviour.
Conclusion
Trailing stops might not suffer as much from whipsaw trades than MA crossovers but they still remain inefficient when market is not trending, results of the proposed indicator on major forex pairs are more than disappointing, but i hope this will serve as basis for other trailing stops that might act a little bit better. I conclude this post by thanking everyone who support my work and i encourage you to modify this indicator and share it with the community.
Thanks for reading !
Cited Articles
nTrend ULTIMATEHello traders
With this fabulous script, you can color the candles based on the indicator and timeframe you want
You can only apply one indicator at a given time obviously
The list of indicators are the following:
- Price vs Moving Average : if price is above, bullish color, if price is below, bearish color
- Trend Signal : if the Trend signal is pointing upwards, bullish color, if the Trend signal is point downwards, bearish color
- Supertrend : if supertrend is below the price, bullish color, if supertrend is above the price, bearish color
- MACD : if MACD is positive, bullish color, if MACD is negative, bearish color
- MACD ZERO LAG : if MACD ZERO LAG is positive, bullish color, if MACD ZERO LAG is negative, bearish color
- MM Cross : if MM cross is bullish , bullish color, if MM cross is bearish , bearish color
- Ichimoku: if price is above the cloud, bullish color, if price is below the cloud, bearish color
Hope you'll like it
Please feel free to comment to ask me to add any other indicator you like or simply to say how much you love it.
Positive vibes are always appreciated and will encourage me to give you more free content.
Dave

Ultimate Algorithm Builder (Single Trend)Hello traders
This is a fantastic tool to detect convergence between the following indicators :
Overlay - meaning if the price close above/below the SMA 50
Trend Signal - to detect if the the DOW law is broken and predict a possible reversal - en.wikipedia.org/wiki/Dow_theory
In other words, it detects if the higher highs or lower lows sequence is broken
MACD or MACD Zero Lag
MM Cross - Cross of moving averages
Ichimoku - if the price closes below/above the cloud
Supertrend - used to detect polarity zones
TSI Shadow - propieraty indicator - URL :
It's ultra flexible as you check which indicator you need in your own strategy. That's why I called it the Ultimate Algorithm Builder
Enjoy
Dave

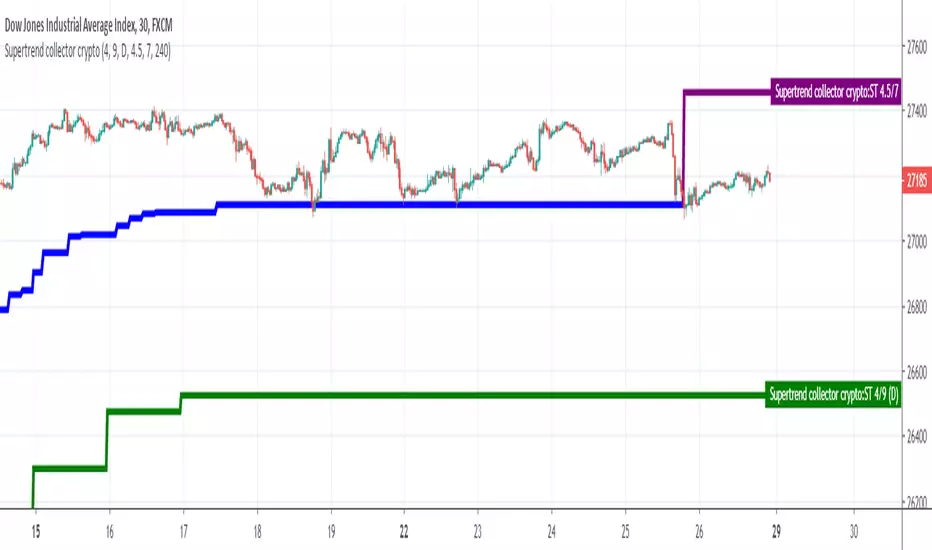
Supertrend collectorHello traders
This is an example of how you can add multiple indicators into a unique one
In this instance, I added two supertrend multitimeframes and draw them on a different timeframe chart
Enjoy
David
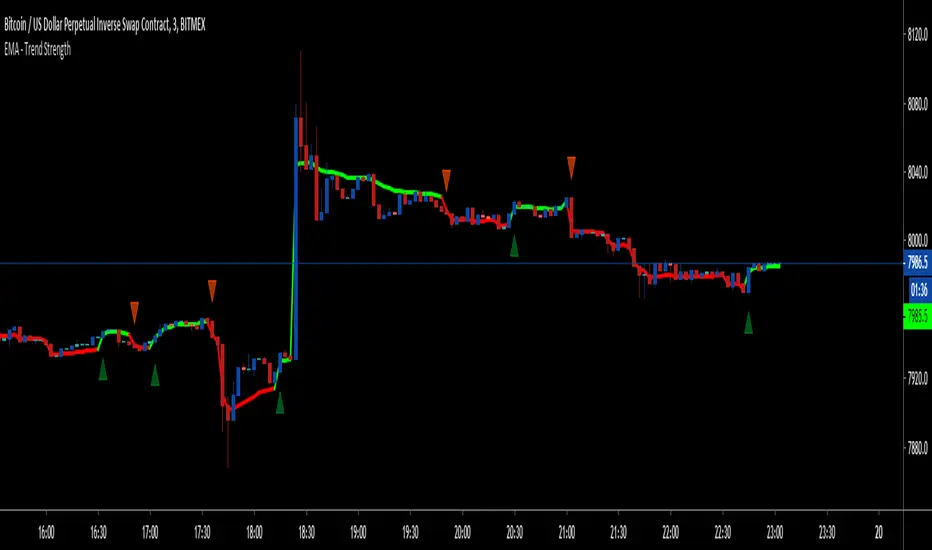
EMA - Trend Strength - 1m ScalperThis is a very special script based on volume, supertrend and ATR which works successfully on a 1m chart for bitmex.
ETH/USD
LTCM19
XRPM19
EOSM19
ADAM19
BCHM19
*private use only

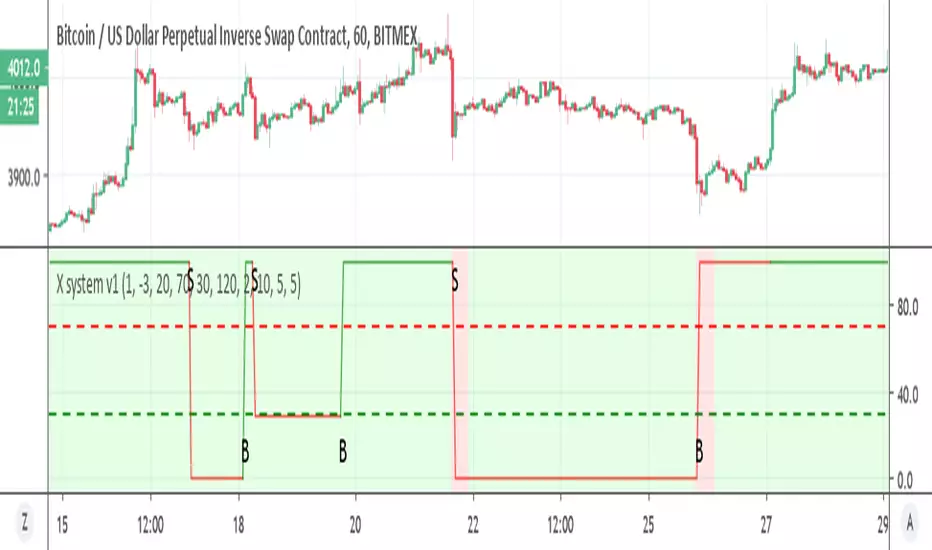
X system v1Similar to X system but here I use the super trend with MTF function
the sell option depend on the % channel sell seen in red as bearish rule (so both need to agree)
the buy option depend only on the MTF which is set on 2 hour on 1 hour candles. you can try to modify if you want shorter times to see if it better
if you want it sell more just remove the and bearish rule from t green for buy in the code
try to make it better and I hope it can help you :)
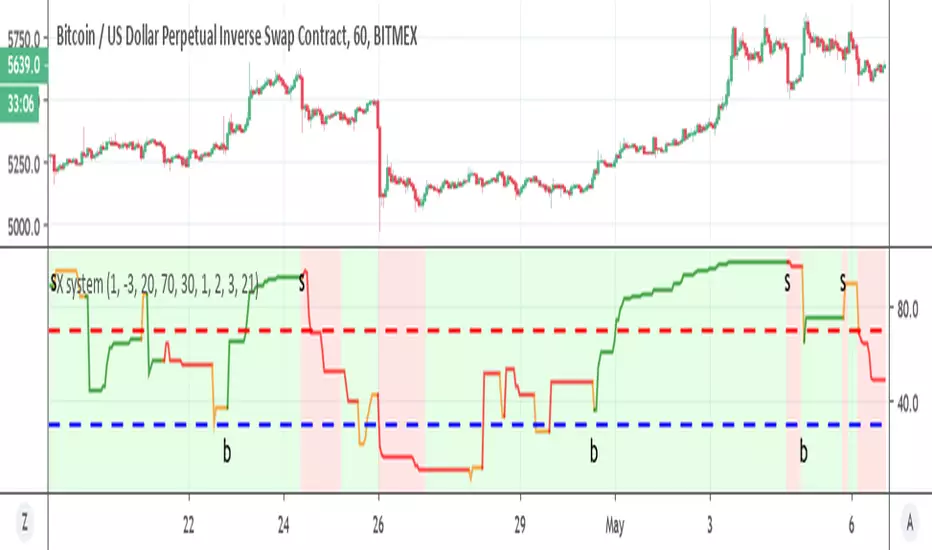
X systemSo how this system work ?
1. the bullish and bearish zones in lime and red are based on percent channel (you can modify it according to your needs) . this now is on 1 hour candles so I set it to 1% above and 3% bellow for BTC on bitmex.
2. we ha RSI super trend system which generate our buy and sell signals .
Since the Super trend is an RSI like it act like one as we can see when it go from high to low much more easy compare to regular super trend
One can optimize it to be full auto mode but it need more work to be much better and safe
This indicator aim is to help you in your decisions for buy and sell and I would not advise to use it as a bot but as a helper when you decide to buy and sell
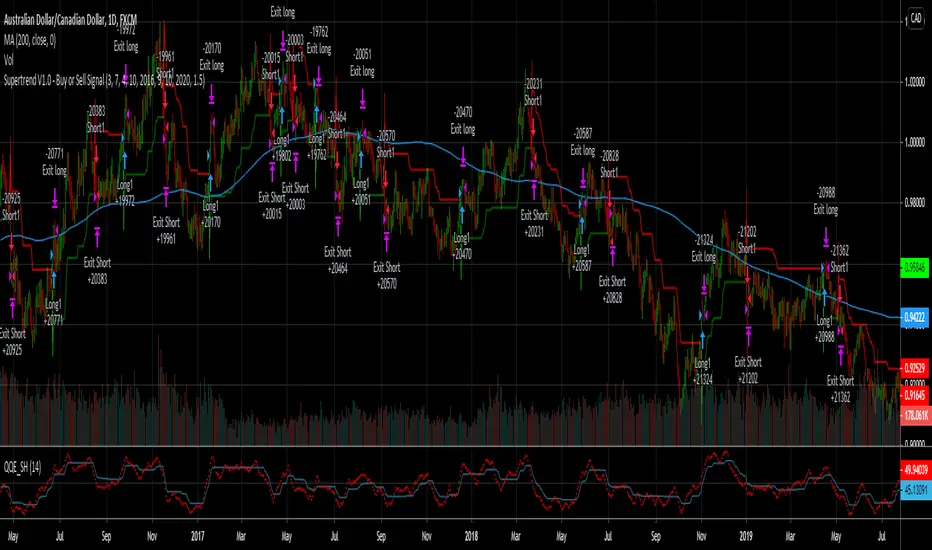
Supertrend V1.0 - Buy or Sell SignalA test of the Supertrend Indicator. If I have made any mischaracterizations and mistakes, please let me know in the comments.
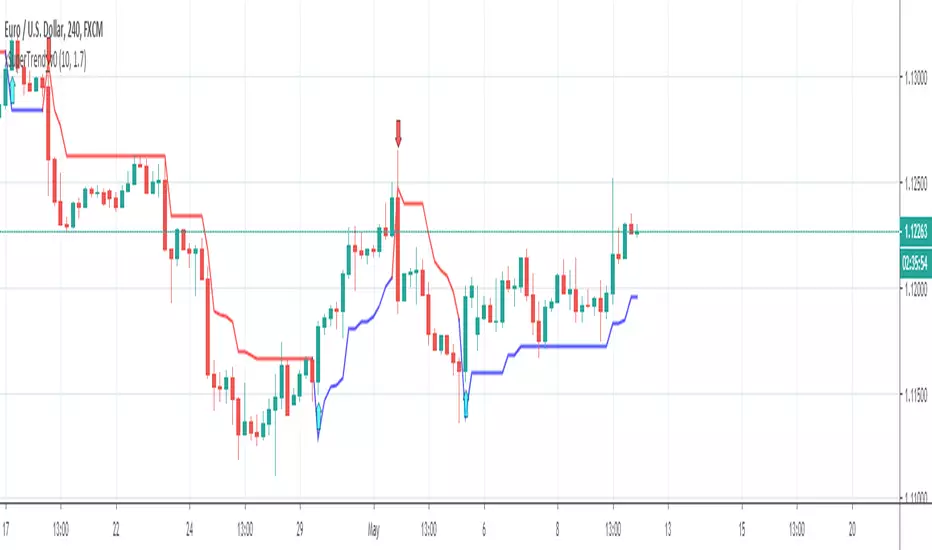
xSuperTrend_AGThis is only for education purpose.
Sell if the below line cross to above.
But if the above line cross to below.
💰 Bitmex Angel ALPHA (NO REPAINT)
Hello everyone,
We are all tired of 98% promises that repaint every half a candle. The solution? Use only past data xD
Remember to set the sell targets and stop losses beforehand
I wanted to create a strategy that emulates my decision making (so I could get the most important info at a glance instead of wasting so much time in front of the computer) trading Ethereum but without global variables it is impossible to factor in the Scalps, conditionals & all.
I use several other tools I couldn't implement in the strategy because it would repaint (PPO, moving averages, etc) , converting it to an indicator will allow me to get signal+confirmation
Will be working on that from now on.
Once finished will be invite-only

Improved Multi-Timeframe (MTF) TRL - plots same as live dataThese multi-timeframe True Range Levels use an improved calculation to accurately calculate the indicator's value with every new bar on the time frame your chart is set to. Previously the indicator only recalculated with every new update on the timeframe used in its security function. This means that this improved script plots the real, current value of your indicator across your chosen timeframes on your chart's resolution and no longer only plots only the indicator's monthly/weekly/daily/4 hour/ect closing value on the your chart.
This indicator was previously published as "True Range Bands" and uses a similar calculation the "SuperTrend" and "Volatility Stop" indicators.
Input values are fixed to their default (close,14,3) configuration to make this indicator's improved calculation possible.
When using "Plot Higher Timeframe?" the script will set the indicator to only plot its value in closest larger timeframe. This option overrides the two following options. For example, when using the daily resolution , only the weekly value will plot, or when using the one hour (60m) resolution, only the 4 hour (240m) value will plot.
The "Omit Higher Timeframes?" option will set the indicator to only plot starting from the 1/2/3/4/5/6/7th closest larger timeframe. For example, when using the daily resolution and this option set to 0, all values from the weekly resolution and up will plot, but if set to 1, all values from the monthly resolution and up will plot instead.
The "Plot Yearly/Quarterly/Monthly/Weekly/Daily/4 Hour/1 Hour/15 Minute/5 Minute?" options allow enabling/disabling a specific timeframe. All are enabled by default. For example, if you do not want the yearly value of the indicator to ever plot, you can disable the "Plot Yearly?" option.

SuperTrend StrategyA simple SuperTrend strategy on @version 3. tweaked to work good with ethereum.
Remember the feedback.
