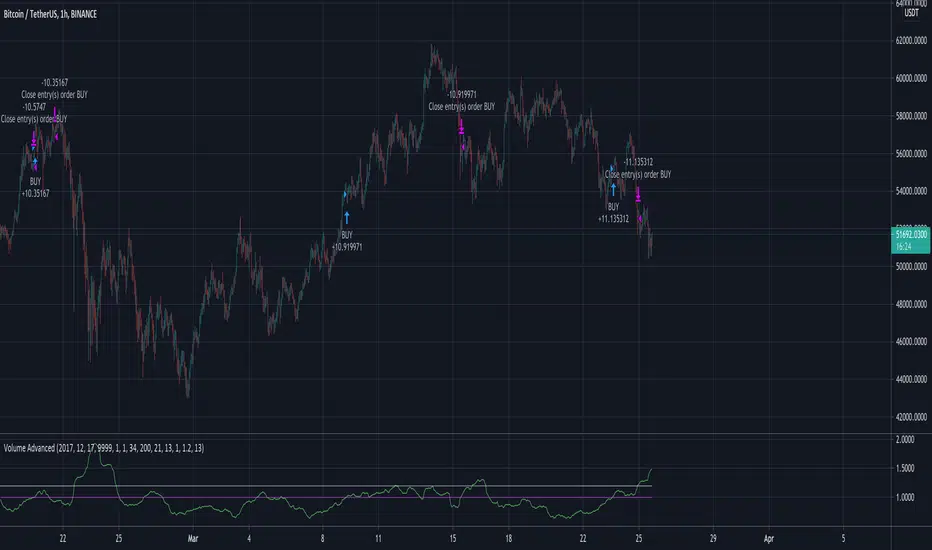
MACD BTC Long/Short Strategy v1.0This strategy will use only default MACD with Simple MA(Signal Line) mode 'ON' to determine when it's time to long/short using its histogram value.
Current version has 2 more entries added to increase more trades and profits along the way while maintaining low 'max drawdown' and high returns.
Entry will be opened when macd line(blue) crossed with signal line(red).
Entry will be closed when histogram increased/decreased opposite its previous histogram.
Re-enter will opened a position when histogram continues after X delay (Re-enter Delay setting).
Sculp will opened a position when histogram is still in light colors for X delay (Sculp Delay setting).
Strategy

Bollinger Bands Trending Reverse StrategyWelcome to yet another script. This script was a lot easier since I was stuck for so long on the Donchian Channels one and learned so much from that one that I could use in this one.
This code should be a lot cleaner compared to the Donchian Channels, but we'll leave that up to the pro's.
This strategy has two entry signals, long = when price hits lower band, while above EMA, previous candle was bearish and current candle is bullish.
Short = when price hits upper band, while below EMA, previous candle was bullish and current candle is bearish.
Take profits are the opposite side's band(lower band for long signals, upper band for short signals). This means our take profit price will change per bar.
Our stop loss doesn't change, it's the difference between entry price and the take profit target divided by the input risk reward.

Volume AdvancedI have found out this script some time ago. In fact it is not my code (just have modified a little) and I don't know the author (couldn't find). So now I would like to share with the community, maybe somebody would have some idea how to make it better. The script itself is modified volatility oscillator (like ATR) based on volume, making a deal at the moment of price change. To recognize the current trend I have add simple function just to compare the current price with the N bars before, because sometimes in moments of high volatility there may be wrong signals.
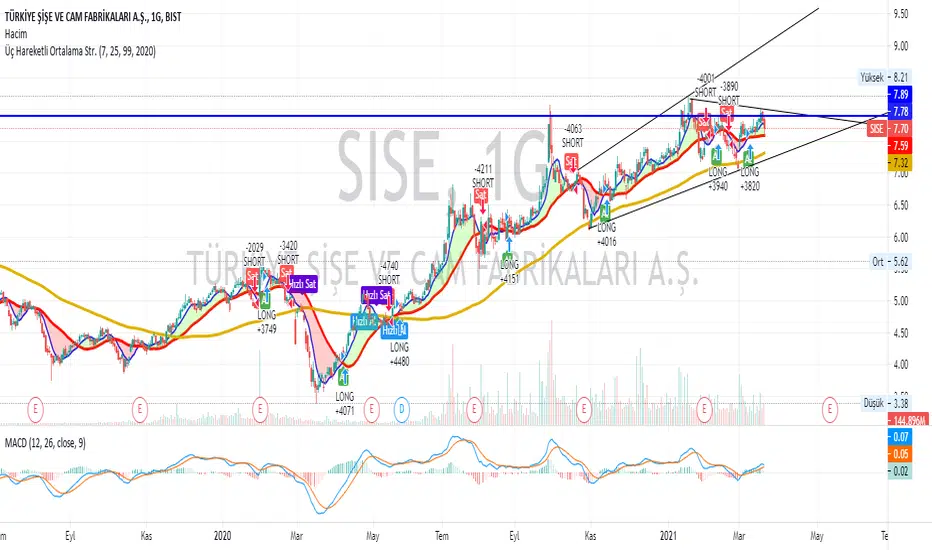
Three moving average strategies
If the short term (Default 7) moving average cuts the medium term (default 25) moving average, BUY. Conversely, it generates the SELL signal. If the long term (Default 99) moving average cuts its short term moving average, Quick SELL. Conversely, it can be interpreted as Fast SELL. You can change the moving average and the number of days as you wish, and you can trade in the short or long term. I hope it was useful.
Risk Reduction Ultimate TemplateThis is a template not actually meant for trading. I picked two random oscillators. This is a template meant to turn into a live trading strategy, however.
It's literally just a specialized take profit/stop loss system. It is to ensure your bot doesn't make any bad moves that you wouldn't have manually. The code should be pretty well annotated. Putting this into my scripts has made them much better. I will work on a Multiple Trigger template next.

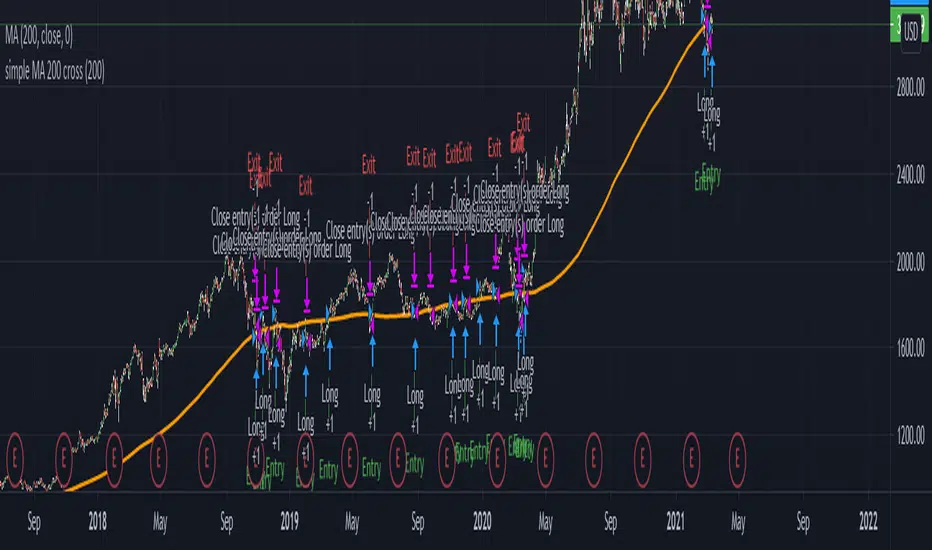
Basic SMA 200 StrategyThe SMA 200 basic strategy will be more than familiar to most traders.
This strategy is to stay with the programming language so to say the "Hello World" of trading.
The SMA 200 basic strategy is also one of the simplest strategies in trading. All that is required is the price and a 200 period moving average. Usually the strategy is used in the daily chart.
The rules are as follows:
Entry: A position is opened when the price crosses the moving average 200 from the bottom to the top.
Exit: The position is closed when the price crosses the moving average from top to bottom.
This is a trend following system and was originally used for trading stocks.
In my opinion, trading with the strategy is recommended to every beginner. There are strategies with better performance, but they are much more complicated to implement. And that's where the big advantage of the strategy can be seen.
Beginners are more than overwhelmed at the beginning of their trading career. Often beginners trade in the 5 min chart with 6 different indicators some signals that they have seen in a Youtube video.
Comparable to a beginner driver who immediately gets into a Porsche as his first car.
Beginners should follow simple rules and avoid intraday charts. Above all, you should do the actual work of a trader.A trader does not just press the mouse twenty times a day and then has easily earned 2000 $. A trader tests systems down to the smallest detail, optimizes and tests again, until he has found an almost " waterproof " trading system. The 200 SMA basic strategy is excellent for gaining experience, learning to follow the rules of a system and not to burn your money right away.
With this script you can test how successful the "simplest strategy in the world" would have been in the past.
Small tip: Do not trade Forex with it it will never work. The strategy is made for long trends and you can find them for example in the stock market.
Have fun with it! About a positive feedback I would be very happy of course.
Flawless Victory Strategy - 15min BTC Machine Learning StrategyHello everyone, I am a heavy Python programmer bringing machine learning to TradingView. This 15 minute Bitcoin Long strategy was created using a machine learning library and 1 year of historical data in Python. Every parameter is hyper optimized to bring you the most profitable buy and sell signals for Bitcoin on the 15min chart. The historical Bitcoin data was gathered from Binance API, in case you want to know the best exchange to use this long strategy. It is a simple Bollinger Band and RSI strategy with two versions included in the tradingview settings. The first version has a Sharpe Ratio of 7.5 which is amazing, and the second version includes the best stop loss and take profit positions with a Sharpe Ratio of 2.5 . Let me talk a little bit more about how the strategy works. The buy signal is triggered when close price is less than lower Bollinger Band at Std Dev 1, and the RSI is greater than a certain value. The sell signal is triggered when close price is greater than upper Bollinger Band at Std Dev 1, and the RSI is greater than a certain value. What makes this strategy interesting is the parameters the Machine Learning library found when backtesting for the best Sharpe Ratio. I left my computer on for about 28 hours to fully backtest 5000 EPOCHS and get the results. I was able to create a great strategy that might be one of TradingView's best strategies out on the website today. I will continue to apply machine learning to all my strategies from here on forward. Please Let me know if you have any questions or certain strategies you would like me to hyper optimize for you. I'm always willing to create profitable strategies!
P.S. You can always pyramid this strategy for more gains! I just don't add pyramiding when creating my strategies because I want to show you the true win/loss ratio based buying one time and one selling one time. I feel like when creating a strategy that includes pyramiding right off the bat falsifies the win rate. This is my way of being transparent with you all. Have fun trading!

RSI Mean Reversion Bot StrategyI started developing this strategy as a way to plug in and test values before defining them in the bots on 3Commas, Coinrule, and Quadency. None of those bots performed the same way my script did and I kept working on it until the strategy finally yielded the same simulated results when paired with the Tradingview bot on Quadency. I looked at all the different RSI strategies already published and saw what each was missing and changed it in mine to make it better:
1. Backtest an actual timeframe by date and time
2. Define the RSI price source
3. Fully manipulate the RSI length
4. Define a stop loss that works
5. Pick Long or Short, or both, based on market conditions. Or compare side by side to decide which you want.

Triple EMA StrategyThis is my first ever script so any suggestions, recommendations or improvement ideas welcome!
This strategy is an implementation of a standard three exponential moving averages strategy (defaults: EMA1=5, EMA2=20 and EMA3=50 candles). Trades are executed if EMA1 crosses above/below EMA2 and they are both above/below EMA3. In addition, the close of the current candle must be above/below the previous one by at least the number of ticks you specify in the "buffer" parameter (default 150 ticks). This additional check eliminates many bad trades.
There is also a trailing stoploss which comes into play once the price has gone above/below its initial value which it then follows the price with to ensure the trade closes at the highest possible price.
I find this strategy works best on a 15 minute chart but feel free to play around and fine tune the various parameters. If you find a good setup that returns decent profits, I'd be keen to hear it!

Moving Regression Band Breakout strategyFollowing the introduction of the Moving Regression Prediction Bands indicator (see link below), I'd like to propose how to utilize it in a simple band breakout strategy :
Go long after the candle closes above the upper band . The lower band (alternatively, the lower band minus the 14-period ATR or the central line ) will serve as a support line .
Exit as soon as the candle closes below the support line .
To manage the risk of false breakouts, a fixed stop loss is set to the value of the support line at the time of opening a position. When the support line moves above the position opening price, shift the stop loss to breakeven.
The same logic but in reverse applies to short positions.
As an option, it is possible to allow long entries only when the slope of the Moving Regression curve is positive (and short entries when the slope is negative).
Model parameters:
Length and Polynomial Order define the lag and smoothness of the model.
Multiplier specifies the width of the channel.
As the default model parameter values, I set those that I found to provide optimal risk / reward ratio on the daily timeframe (for both trending and range-bound market). However, the settings are very flexible and can be well-adjusted to particular market conditions. Feel free to play around and leave feedback in the comments!
Here's the original Moving Regression Prediction Bands script:

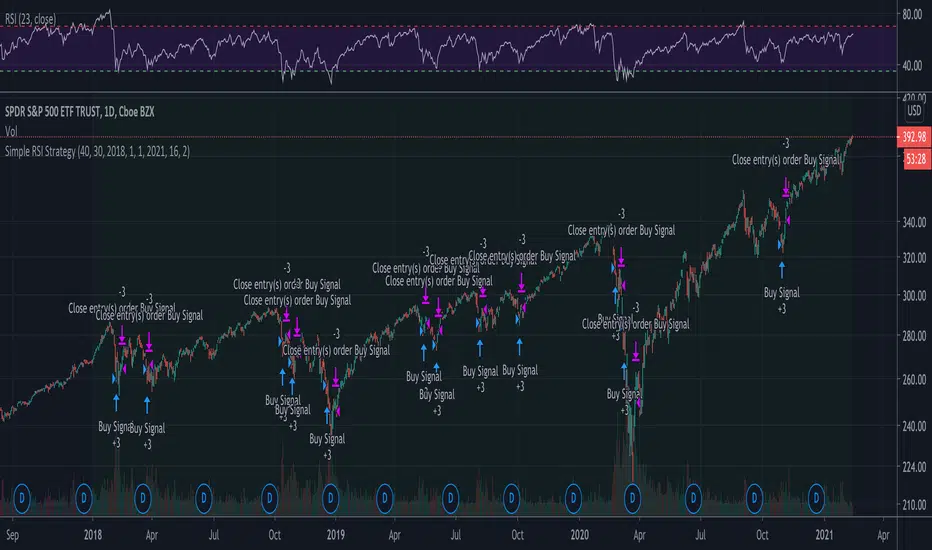
Example of Simple RSI Buy/Sell at a level and hold for 10 daysScript implements strategy:
1 Buy at RSI (10) < 30
2 Sell at RSI (10) > 40 or after 10 days
The strategy is not profitable for long term trading.
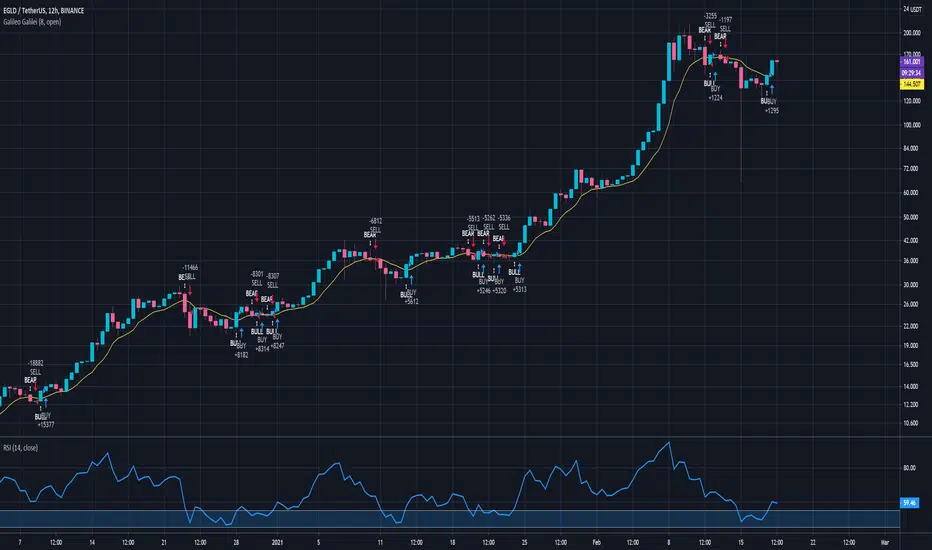
Galileo GalileiGalileo Galilei
Is the simplest of them all and easy to understand:
It has an Exponential Moving Average that you can modify to suit your pair on the chart with it's timeframe, looking at the strategy tester to compare results;
The prices for the EMA are taken from the OPEN of every candle (depending on your timeframe);
If the current candle's price closes above the Average and the new candle opens above the average, it will trigger a buying signal because of the bullish setup;
If the current candle's price closes below the Average and the new candle opens below the average, it will trigger a selling signal because of the bearish setup;
No strategy works on all charts and on all timeframes so you have to feel free to modify the parameters to suit your trading setup;
It is possible that the strategy won't give you any good results at all on some trading pairs and timeframes so be careful because it can lose money;
This strategy is called Galileo Galilei, it's free for you all to use and it was developed to be as simple as it can be and to work in bullish or bearish scenarios, but not in flat movements.
You can message me to ask questions, I respond to every message.
Green pips!
Equal-Length EMA/SMA Crossover Momentum StrategyOverview:
This momentum and trend-following strategy captures the majority of any trending move, and works well on high timeframes.
It uses an equal-period EMA and SMA crossover to detect trend acceleration/deceleration, since an EMA places a greater weight and significance on the most recent data.
This version is optimized for longs, and designed to cut your losses quickly and let your winners run.
To reduce noise and optimize entries, we combined this with an overall trend bias for further confluence.
How it works:
Signals are determined by the crossover of an EMA and SMA of the same length, e.g. EMA-50 and SMA-50.
The overall trend bias is determined using a slower SMA golden/death cross, e.g. SMA-50 and SMA-100.
The signal is stronger when it occurs in confluence with the overall trend bias, e.g. when EMA-50 crosses over SMA-50, while above the SMA-100. This is analogous to only opening long positions in a bull market.
Signal description:
Trend Buy: EMA crosses above SMA, and overall trend bias is bullish. Buying is in confluence with the overall trend bias.
Risky Buy: EMA crosses above SMA, and overall trend bias is bearish. Buying is early, more risky, and not in confluence with the overall trend bias.
Late Buy: SMA crosses above BIAS_SLOW. This gives further confirmation of bullish trend, but signal comes later.
Sell: EMA crosses under SMA.
Strategy entry and exit conditions:
This version enters a Long when "TREND BUY" is signalled.
This version has Sell/Shorts disabled because UP ONLY.
Long entry: Strategy enters Long when EMA is above SMA, while overall trend bias is bullish.
Long exit: Close long when EMA crosses under SMA.

Buy and Hold entry finder StrategyHello everyone!
I proudly present the backtest Strategy Script for my "Buy and Hold entry finder" Script.
It basically shows you the outcome, if you would use my indicator in the past.
The buy signals are limited to 1 order per month.
Order Size: Allows you to choose, how much money you want to invest per month. (Please consider, it will only invest an x amount per Order, but it will not stack the amount you did not invest in an previous month ) (Example in my indicator)
Pyramiding: Just regulates, how often you can open an position.
Commission: Here you can set how much it will cost to open an position at your broker.
I coded a feature that allows you to set a Start Date and an End Date for your backtest. In the end of the backtest the script closes all positions.
If you got any question, feel free to ask in the comments or send me a message.
Sincerely, RS Titan.

Ultimate Strategy TemplateHello Traders
As most of you know, I'm a member of the PineCoders community and I sometimes take freelance pine coding jobs for TradingView users.
Off the top of my head, users often want to:
- convert an indicator into a strategy, so as to get the backtesting statistics from TradingView
- add alerts to their indicator/strategy
- develop a generic strategy template which can be plugged into (almost) any indicator
My gift for the community today is my Ultimate Strategy Template
Step 1: Create your connector
Adapt your indicator with only 2 lines of code and then connect it to this strategy template.
For doing so:
1) Find in your indicator where are the conditions printing the long/buy and short/sell signals.
2) Create an additional plot as below
I'm giving an example with a Two moving averages cross.
Please replicate the same methodology for your indicator wether it's a MACD, ZigZag, Pivots, higher-highs, lower-lows or whatever indicator with clear buy and sell conditions
//@version=4
study(title='Moving Average Cross', shorttitle='Moving Average Cross', overlay=true, precision=6, max_labels_count=500, max_lines_count=500)
type_ma1 = input(title="MA1 type", defval="SMA", options= )
length_ma1 = input(10, title = " MA1 length", type=input.integer)
type_ma2 = input(title="MA2 type", defval="SMA", options= )
length_ma2 = input(100, title = " MA2 length", type=input.integer)
// MA
f_ma(smoothing, src, length) =>
iff(smoothing == "RMA", rma(src, length),
iff(smoothing == "SMA", sma(src, length),
iff(smoothing == "EMA", ema(src, length), src)))
MA1 = f_ma(type_ma1, close, length_ma1)
MA2 = f_ma(type_ma2, close, length_ma2)
// buy and sell conditions
buy = crossover(MA1, MA2)
sell = crossunder(MA1, MA2)
plot(MA1, color=color_ma1, title="Plot MA1", linewidth=3)
plot(MA2, color=color_ma2, title="Plot MA2", linewidth=3)
plotshape(buy, title='LONG SIGNAL', style=shape.circle, location=location.belowbar, color=color_ma1, size=size.normal)
plotshape(sell, title='SHORT SIGNAL', style=shape.circle, location=location.abovebar, color=color_ma2, size=size.normal)
/////////////////////////// SIGNAL FOR STRATEGY /////////////////////////
Signal = buy ? 1 : sell ? -1 : 0
plot(Signal, title="🔌Connector🔌", transp=100)
Basically, I identified my buy, sell conditions in the code and added this at the bottom of my indicator code
Signal = buy ? 1 : sell ? -1 : 0
plot(Signal, title="🔌Connector🔌", transp=100)
Important Notes
🔥 The Strategy Template expects the value to be exactly 1 for the bullish signal , and -1 for the bearish signal
Now you can connect your indicator to the Strategy Template using the method below or that one
Step 2: Connect the connector
1) Add your updated indicator to a TradingView chart
2) Add the Strategy Template as well to the SAME chart
3) Open the Strategy Template settings and in the Data Source field select your 🔌Connector🔌 (which comes from your indicator)
From then, you should start seeing the signals and plenty of other stuff on your chart
🔥 Note that whenever you'll update your indicator values, the strategy statistics and visual on your chart will update in real-time
Settings
- Color Candles : Color the candles based on the trade state (bullish, bearish, neutral)
- Close positions at market at the end of each session : useful for everything but cryptocurrencies
- Session time ranges : Take the signals from a starting time to an ending time
- Close Direction : Choose to close only the longs, shorts, or both
- Date Filter : Take the signals from a starting date to an ending date
- Set the maximum losing streak length with an input
- Set the maximum winning streak length with an input
- Set the maximum consecutive days with a loss
- Set the maximum drawdown (in % of strategy equity)
- Set the maximum intraday loss in percentage
- Limit the number of trades per day
- Limit the number of trades per week
- Stop-loss: None or Percentage or Trailing Stop Percentage or ATR
- Take-Profit: None or Percentage or ATR
- Risk-Reward based on ATR multiple for the Stop-Loss and Take-Profit
This script is open-source so feel free to use it, and optimize it as you want
Alerts
Maybe you didn't know it but alerts are available on strategy scripts.
I added them in this template - that's cool because:
- if you don't know how to code, now you can connect your indicator and get alerts
- you have now a cool template showing you how to create alerts for strategy scripts
Source: www.tradingview.com
I hope you'll like it, use it, optimize it and most importantly....make some optimizations to your indicators thanks to this Strategy template
Special Thanks
Special thanks to @JosKodify as I borrowed a few risk management snippets from his website: kodify.net
Additional features
I thought of plenty of extra filters that I'll add later on this week on this strategy template
Best
Dave

MACD 50x Leveraged Strategy Real Equity Simulation Hello, I wrote this script to merge the two scripts I shared before.
The aim here is to see the real value of the state of the capital as a result of leveraged transactions and to combine both long and short directions.
Scripts :
MACD Long 50x Leverage Strategy :
MACD Short 50x Leverage Strategy :
The parameters have not changed so they are the same as the previous two scripts:
Adding margin: Forbidden or not specified. (Add Margin : No)
Position Size : %1 (0.01) (For each trade)
Stop-Loss : %2 (For each trade)
Long : Crossover(delta,0) (Standard MACD)
Long Exit : Long Stop Level or Short Entry
(In the case of Long Stop, all trades are closed and no positions are opened in short direction.)
Short : Crossunder(delta,0) (Standard MACD)
Short Exit : Short Stop or Long Entry
(In the case of Short Stop, all trades are closed and no positions are opened in the long direction.)
NOTE :
This is a simulation made using standard parameters, showing the state of the balance in very simple rules with leveraged transactions only.
The nice thing here is the direct observation of the results by making modifications on the strategy parameters.
Regards.

Super Momentum StrategyThis is a strategy utilizing multiple of Evergets RMI (thanks to him for permission to publish) and a Chance Momentum.
It buys when 4 of the RMIs are below their thresholds and sells when they are above. There is a 5th one I added last night that works in Reverse - buy when its above and sell when below, which should work better for pyramiding strats by using it at the right rate to set the overall trend.
Very basic sample below, I could have set it up better as my example but just want to publish.

[DS]Entry_Exit_TRADE.V01-StrategyThe proposal of this script is to show the possible trading points of BUY and SELL based on the 15-minute chart of the Nasdaq Future Index. The start point of the strategy was schedule for 2021/01/01 and until the time of this publication (2021/01/31), for 1 index contract the results presented area a Gross Profit of 2.97% with a Net Profit of 1.35%.
█ FEATURES
The indicator shows on the graph the position of the MACD and TSI indicators that are the places of strength among Buyers and Sellers.
It's possible to observe a sharp fall or rise in the price of these positions.
On the current candle, a label is displayed containing the value of the William %R Mod indicator, which will display the OverBought position (dark red) and OverSold position (dark green). The other colors like light red and green are the regions where the price makes the decision of which direction to go.
There are also other indicators:
a) The positions of the BUY (light green) and SELL areas (light red);
b) The label with the position of BUY (dark green) and SELL (dark red) with the line that connects these points;
c) DEMA 72 (orange);
d) EmaOchl4 in the color green for BULL and red for BEAR market;
e) Pivots high and low
f) Maximum (purple light) and minimum areas (blue light)
█ FUNCTIONS AND SETTINGS
The indicator uses the following functions:
(1) DEMA - Double Exponential Moving Average (08,17,34, 72)
(2) ema () - Exponential Moving Averge (72, ohlc4)
(3) plot()
(4) barcolor()
(5) cross()
(6) pivots ()
(7) William R% Md (OverBought = -7, OverSold=-93)
(8) Maximum and Minimum Value
(9) fill()
(10) macd () - Moving Average Convergence Divergence (Fast Lengt=12, Slow Length=26, Source=close, Signal Smoothing=9)
(11) tsi() - Trading Strenght Indicator==> Índice de Força Real ( IFR ) (Long Length=72, Short Length=17, Signal Length=17)
(12) Buy and Sell TRADE Points
█ PERFORMANCE AND ERRORS
The positions of BUY and SELL points are defined through the crossing of the Dema 34 candles with the Ema Ohcl4. As it is an indicator, it can present different positions from de market direction. Thus there is a need to observe the direction of the market in order to verify whether the indicate decision is really acceptable. The decision to BUY or SELL an asset must be well studied to avoid financial losses. The indicator will only help you in this decision, is your responsibility the decision of entering or leaving an asset.
█ THANKS TO
PineCoders for all they do, all the tools and help they provide, and their involvement in making a better community. All the PineCoders, Pine Pros, and Pine Wizards, people who share their work and knowledge for the sake of it and helping others, I'm very happy and grate full indeed.
█ NOTE
If you have any suggestions for improving the script or need help using it, please send a message in the comments

Double EMA CROSS
Double EMA CROSS (DEC)
Useful for identifying and receiving alerts about uptrends and downtrends.
This script uses two Exponential Moving Averages (EMAs) to find price uptrends and downtrends.
An Exponential Moving Average ( EMA ) is a type of moving average that places a greater weight and significance on the most recent data points.
The script produces uptrend and downtrend signals based on crossovers and divergences between the two EMAs,
the user will be able to spot a trend change (when the EMAs crossover) and to determine the strength of the current trend (when the EMAs diverge).
It is also posible to get alerts for uptrends and downtrends on the web and mobile app with sound and pop-ups as well as via email.
The optimal time to enter and exit the market can be concluded from this trend changes.
The user can set their own EMAs, by default they are set to 25 and 75 periods for medium and long term respectively.
When the medium term EMA crosses below the long term EMA the asset is in a downtrend and the price will decline, and when the
medium term EMA crosses above the long term EMA the asset is in an uptrend and price will increase.
This scripts plots the following indicators and signals on the chart to help the user to identify trends:
1.- Medium and long term EMAs as lines overlaid on the price chart.
2.- Up green triangles above bars when the price is on an uptrend and down red triangles below bars when the price is on a downtrend.
3.- Arrows with text to indicate the start of an uptrend or downtrend.
The user can enable and disable the indicators and signals as well as set colors and shapes to their liking.
This script also lets the user create alerts for uptrends and downtrends. To create a new alert using this script follow this instructions:
1.- Once you added this script to your chart, go to the alerts panel (right on web or bottom tool bar on the mobile app) and add a new alert (alarm clock icon with a plus sign).
2.- A modal window will open. On the “Condition” dropdown menu select “DEC”.
3.- On the next dropdown menu (right below the “Condition” one) you can select.
4.- Lastly you can set all the normal alert options and create the alert.

Fancy Bollinger Bands Strategy [BigBitsIO]This script is for a Bollinger Band type indicator with built-in TradingView strategy including as many features as I can possibly fit into a Bollinger Band type indicator including a wide variety of options to create the most flexible Bollinger Bands strategy possible.
Features:
- A single custom moving average serving as the middle band.
- Standard MA inputs.
- MA type.
- MA period.
- MA price.
- MA resolution (time frame).
- Visibility toggle.
- MA Candle Type
- Fancy MA inputs.
- Toggle to show only candles included in the MA calculation ("Highlight inclusion") or display entire MA history.
- Toggle to show a ghost trail when Highlight inclusion is toggled on. Displays a shaded version of past MA history before the inclusion period (as seen on snapshot).
- Toggle to show forecast values for the MA.
- Other inputs related to forecasting:
- Forecast bias. (Neutral forecasts MA if the current price remains the same.)
- Forecast period.
- Forecast magnitude.
- Toggle showing details on the screen
- Toggle the visibility of the fill between the upper and lower bands.
- Toggle to use ATR instead of the standard deviation to calculate the location of the upper and lower bands.
- Custom input for the ATR period.
Strategy Features
-Strategy Window - only test during this window
-Take Profit and Stop Loss
-Open and Close conditions, including condition counts and any/all requirements
-Many conditions to choose from that can either be selected to open, close or open and close a position
-Conditions include:
-Price crossing above/below the Upper, Middle, or Lower bands
-Price being above/below the Upper, Middle, or Lower bands
-Bollinger Band width crossing or being above/below custom values
-Percent B crossing or being above/below custom values
This script may contain errors, or out of date code. Please be mindful of updates to the script.
*** DISCLAIMER: For educational and entertainment purposes only. Nothing in this content should be interpreted as financial advice or a recommendation to buy or sell any sort of security or investment including all types of crypto. DYOR, TYOB. ***

Strategy - Profit Maximizer by PMaxIt is a small modification to the "Profit Maximizer Max" script to make it a strategy by date range.

Momentum Strategy (BTC/USDT; 30m) - STOCH RSI (with source code)Here's a strategy for low time frames (30min suggested) for BTC , based on momentum Analysis using Stochastic RSI
By default the strategy will use the 50% of the specified capital for each trade; if "Gamble Sizing" is enabled, it will add the specified amount of capital (25% by default, until reaching the 100% limit or lower) for the next trade after having detected a loss in the previous trade; if the next trade is successful, the size for the next trade comes back to 50%
• Trend Filter LONG: If the fast exponential moving average is UNDER the slow exponential moving average , it won't open LONG positions
• Trend Filter SHORT: If the fast exponential moving average is ABOVE the slow exponential moving average , it won't open SHORT positions
• Bars delay: the strategy will wait the specified amount of bars before closing the current position; the counter is triggered as soon as the closing trade condition is verified
BY MAKING USE OF THIS STRATEGY, YOU ACKNOWLEDGE AND AGREE THAT: (1) YOU ARE AWARE OF THE RISKS ASSOCIATED WITH TRANSACTIONS OF DIGITAL CURRENCIES AND THEIR DERIVATIVES; (2) YOU SHALL ASSUME ALL RISKS RELATED TO THE USE OF THIS STRATEGY AND TRANSACTIONS OF DIGITAL CURRENCIES AND THEIR DERIVATIVES; AND (3) I SHALL NOT BE LIABLE FOR ANY SUCH RISKS OR ADVERSE OUTCOMES.
SOURCE CODE BELOW

Strategy Template[Benson]A strategy template with following user inputs:
1. backtest start date
2. tp% and stop loss%
3. trail stop price and trail stop offset
The long and short condition is ma crossover and corssunder by default.
You can change the logic with your own.
