Swing Trading Indicators (Improved)This "Swing Trading Indicators" script is a sophisticated trading tool designed for traders who wants to use technical analysis for identifying optimal entry points, safeguarding profits, and protect their capital. With foundations loosely based on the momentum burst strategy by Pradeep Bonde, Kristjan Kullamaggie's trading methodologies, and incorporating automatic stop-losses based on Average Daily Range (ADR) and Average True Range (ATR), this script offers a comprehensive solution if you want to capitalize on short-term market movements.
Key Features:
Indicators and Moving Averages: Includes EMA (5, 10, 20, 50 days), SMA (200 days), and the highest and lowest prices over 200 days to provide a multifaceted view of market trends and momentum.
Thrust Indicator: Central to the script, the thrust indicator signals a buy point when a candlestick bar closes above the highs of the last two days, indicating a momentum burst. This feature is particularly inspired by Pradeep Bonde's 4% breakout strategy, highlighting the script's capability to identify range expansion and upward thrusts as key entry moments.
Automatic Stop-Levels: Utilizes ADR and ATR to set dynamic stop-losses, helping traders to manage risk effectively by adapting to market volatility.
Comprehensive Market Analysis : Through volume analysis, RSI, closing range, and other parameters, the script offers a deep dive into market dynamics, aiding in decision-making.
Who Should Use It:
This tool is ideal for swing traders and momentum traders focused on short to medium-term gains. Its robust set of features makes it suitable for those who prefer a data-driven approach to identify buying opportunities and manage risk.
Trading Style Compatibility:
The thrust indicator shines in momentum trading strategies, providing clear signals for entering trades ahead of potential price jumps. The integration of moving averages and volume analysis supports a variety of trading styles, including day trading and swing trading, by offering insights into trend strength and potential reversals.
How the Thrust Indicator Works:
When you see a thrust indicator (green upwards arrow below a candle) when the price is moving out of a consolidation or low volatility price-range , that's the buy point.
The thrust indicator is NOT indended as an indicator for long term positions or trend reversals, but for entries at a good price while capturing the first day of a potential 5-20% move in the coming 3-5 days.
The thrust indicator pinpoints moments when a stock shows a strong upward momentum, characterized by a candlestick closing above the highs of the preceding two days. This identifies a momentum burst, signaling an optimal entry point for traders looking to profit from a short-term price movement, typically ranging from 5-20% over the following 3-5 days. Such precision in identifying entry points is invaluable for traders focusing on capturing quick gains from market volatility.
"Top / Watch out" Indicator:
In addition to the script's core functionality, the "WatchOut" indicator plays a crucial role in identifying potential reversals after significant price movements. By analyzing conditions such as recent price increases compared to the average daily range, RSI levels, and the opening price distance from the EMA, the "WatchOut" indicator alerts traders to exercise caution. This feature is pivotal for those looking to avoid entering trades that might be on the verge of a pullback or reversal, enhancing the script's utility in managing risk.
Stoploss

Trading TP SL Risk Commission Calculator🎉 Introducing Your Trading TP SL Risk Commission Calculator! 🎉
Hey there, savvy trader! 🚀 Are you looking to enhance your trading game? Meet the Trading TP SL Risk Commission Calculator! This handy tool is here to guide you through the complexities of trading, providing insights into your potential risks and rewards. Let's walk through how you can leverage it for smarter trading decisions!
Setting Up 🛠
Let's get your calculator ready for action:
Lines and Labels Visibility: Flip this switch on to see your Entry, Take Profit (TP), Stop Loss (SL), and Liquidation points displayed on your chart. It's a great way to get a visual summary of your strategy.
Input Your Trade Details: Enter your Entry Price, Take Profit Price, and Stop Loss Price. These figures are crucial for mapping out your trade.
Order Info: Specify your Order Size in USD, the amount of Leverage you're using, and your platform's Commission Rate. This customizes the calculator to fit your unique trading setup.
Customizing Your View 🎨
Table Placement & Size: Pick the location and size for your results table to appear on your screen. Tailor it to your liking, whether you prefer it out of the way or front and center.
Deciphering Your Results 📊
With your inputs in place, the calculator springs into action. Here's what you'll find:
Risk Assessment (with Emojis!): Quickly gauge your risk level with our intuitive emoji system, ranging from "⛔️⛔️⛔️" (very high risk) to "✅✅✅" (very low risk).
Profit and Loss Insights: Understand your potential take-profit gains and stop-loss implications, both as percentages and in USD. We also factor in fees to give you a clear picture.
Liquidation Alert: For those using leverage, the liquidation price calculation is crucial to avoid unpleasant surprises.
Expert Tips 💡
Stay Flexible: Market conditions evolve, so should your strategy. Revisit and adjust your inputs regularly to stay aligned with your trading goals.
Risk Emoji Check: Keep an eye on your risk level emojis. A sea of "⛔️" might signal it's time to reassess your approach.
Use Visual Guides: The on-chart lines and labels offer a quick visual reference to how your current trade measures up against your TP, SL, and liquidation thresholds.
Dive In and Trade Smart! 🚦
This calculator isn't just about making calculations; it's about empowering you to make informed trading decisions. With this tool in your arsenal, you're equipped to navigate the trading waters with confidence and clarity.

ATR Bands with Optional Risk/Reward Colors█ OVERVIEW
This indicator projects ATR bands and, optionally, colors them based on a risk/reward advantage for those who trade breakouts/breakdowns using moving averages as partial or full exit points.
█ DEFINITIONS
► True Range
The True Range is a measure of the volatility of a financial asset and is defined as the maximum difference among one of the following values:
- The high of the current period minus the low of the current period.
- The absolute value of the high of the current period minus the closing price of the previous period.
- The absolute value of the low of the current period minus the closing price of the previous period.
► Average True Range
The Average True Range was developed by J. Welles Wilder Jr. and was introduced in his 1978 book titled "New Concepts in Technical Trading Systems". It is calculated as an average of the true range values over a certain number of periods (usually 14) and is commonly used to measure volatility and set stop-loss and profit targets (1).
For example, if you are looking at a daily chart and you want to calculate the 14-day ATR, you would take the True Range of the previous 14 days, calculate their average, and this would be the ATR for that day. The process is then repeated every day to obtain a series of ATR values over time.
The ATR can be smoothed using different methods, such as the Simple Moving Average (SMA), the Exponential Moving Average (EMA), or others, depending on the user's preferences or analysis needs.
► ATR Bands
The ATR bands are created by adding or subtracting the ATR from a reference point (usually the closing price). This process generates bands around the central point that expand and contract based on market volatility, allowing traders to assess dynamic support and resistance levels and to adapt their trading strategies to current market conditions.
█ INDICATOR
► ATR Bands
The indicator provides all the essential parameters for calculating the ATR: period length, time frame, smoothing method, and multiplier.
It is then possible to choose the reference point from which to create the bands. The most commonly used reference points are Open, High, Low, and Close, but you can also choose the commonly used candle averages: HL2, HLC3, HLCC4, OHLC4. Among these, there is also a less common "OC2", which represents the average of the candle body. Additionally, two parameters have been specifically created for this indicator: Open/Close and High/Low.
With the "Open/Close" parameter, the upper band is calculated from the higher value between Open and Close, while the lower one is calculated from the lower value between Open and Close. In the case of bullish candles, therefore, the Close value is taken as the starting point for the upper band and the Open value for the lower one; conversely, in bearish candles, the Open value is used for the upper band and the Close value for the lower band. This setting can be useful for precautionally generating broader bands when trading with candlesticks like hammers or inverted hammers.
The "High/Low" parameter calculates the upper band starting from the High and the lower band starting from the Low. Among all the available options, this one allows drawing the widest bands.
Other possible options to improve the drawing of ATR bands, aligning them with the price action, are:
• Doji Smoothing: When the current candle is a doji (having the same Open and Close price), the bands assume the values they had on the previous candle. This can be useful to avoid steep fluctuations of the bands themselves.
• Extend to High/Low: Extends the bands to the High or Low values when they exceed the value of the band.
• Round Last Cent: Expands the upper band by one cent if the price ends with x.x9, and the lower band if the price ends with x.x1. This function only works when the asset's tick is 0.01.
► Risk/Reward Advantage
The indicator optionally colors the ATR bands after setting a breakpoint, one or two risk/reward ratios, and a series of moving averages. This function allows you to know in advance whether entering a trade can provide an advantage over the risk. The band is colored when the ratio between the distance from the break point to the band and the distance from the break point to the first available moving average reaches at least the set ratio value. It is possible to set two colorings, one for a minimum risk/reward ratio and one for an optimal risk/reward ratio.
The break point can be chosen between High/Low (High in case of breakout, Low in case of breakdown) or Open/Close (on breakouts, Close with bullish candles or Open with bearish candles; on breakdowns, Close with bearish candles or Open with bullish candles).
It is possible to choose up to 10 moving averages of various types, including the VWAP with the Anchor Period (2).
Depending on the "Price to MA" setting, the bands can be individually or simultaneously colored.
By selecting "Single Direction," the risk/reward calculation is performed only when all moving averages are above or below the break point, resulting in only one band being colored at a time. For this reason, when the break point is in between the moving averages, the calculation is not executed. This setting can be useful for strategies involving price movement from a level towards a series of specific moving averages (for example, in reversals starting from a certain level towards the VWAP with possible partial take profits on some previous moving averages, or simply in trend following towards one or more moving averages).
Choosing "Both Directions" the risk/reward ratio is calculated based on the first available moving averages both above and below the price. This setting is useful for those who operate in range bound markets or simply take advantage of movements between moving averages.
█ NOTE
This script may not be suitable for scalping strategies that require immediate entries due to the inability to know the ATR of a candle in advance until its closure. Once the candle is closed, you should have time to place a stop or stop-limit order, so your strategy should not anticipate an immediate start with the next candle. Even more conveniently, if your strategy involves an entry on a pullback, you can place a limit order at the breakout level.
(1) www.tradingview.com
(2) For convenience, the code for the Anchor Period has been entirely copied from the VWAP code provided by TradingView.

ATR Percentage ValuesThis indicator is created to give you the daily ATR 2% and 10% values for any product that you are looking at. The way the indicator is designed is to only show the most recent 2 and 10 percent values on any chart and will not show you any other number. If you are hovering over price that occurred in the past it will show zeros on the values. To get the right values, take your mouse off of the chart and it will show you the values.
The way this indicator is coded will give you the daily ATR numbers no matter what chart timeframe you are currently looking at. The idea is to save time and make sure you do not make a mistake getting the wrong value.
*** To make this show up on the status line, click on the settings, click on the style box and check the box "VALUES IN STATUS LINE" ****

Trailing Stop-Loss Indicator (FinnoVent)The Dynamic 9 EMA Trailing Stop-Loss Indicator is a specialized tool designed for the TradingView community to enhance risk management in trading. This script dynamically adjusts a trailing stop-loss level based on the position of the price relative to a 9-period Exponential Moving Average (EMA), offering traders a systematic approach to protect potential profits and limit downside risk.
Functionality:
Adaptive Trailing Stop: The indicator calculates a trailing stop-loss that adjusts with the 9 EMA, providing a responsive method to secure gains or prevent extensive losses.
EMA Trend Indicator: The 9-period EMA serves as a momentum indicator, with the script adjusting the trailing stop-loss accordingly — above the EMA for short positions and below for long positions.
Entry Signal Visualization: Entry signals are visualized on the chart, indicating potential long and short positions based on price crossovers with the EMA.
Application:
This indicator is ideal for traders who utilize technical analysis to make informed decisions. By automatically adjusting the stop-loss level to the evolving market conditions, it is particularly useful for:
Day traders looking to capitalize on short-term price movements.
Swing traders aiming to secure positions during more extended market waves.
Any trading strategy that benefits from dynamic stop-loss management.
Usage:
To use the indicator, simply add it to your TradingView chart, and it will automatically plot the trailing stop levels. The green and red lines represent the trailing stops for long and short positions, respectively, providing clear visual cues for potential exit points.
Compliance with TradingView House Rules:
This script is provided for educational purposes and does not constitute investment advice. It is a unique creation that has been developed to contribute to the TradingView community by offering a tool that helps traders manage their trades more effectively.

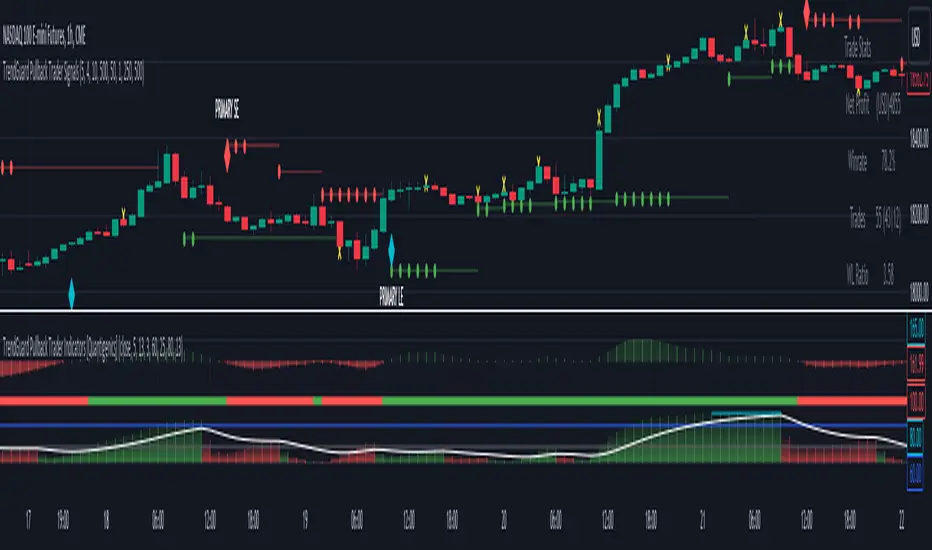
TrendGuard Pullback Trader Signals [Quantigenics]The "TrendGuard Pullback Trader Signals" script, integral to the "TrendGuard Pullback Trader" system, offers a sophisticated suite of trading tools for nearly any market or time frame. Designed to be used alongside the "TrendGuard Pullback Trader Indicators" script, this script is pivotal for identifying Buy/Sell Signals, Profit Target Signals, and Stop Loss Levels.
As with all of our scripts, the "TrendGuard Pullback Trader Signals" script, is designed to work on ANY symbol and time frame. The input parameters can be adjusted to fit your specific trading style.
Methodology and Application:
The script's core methodology lies in identifying primary signals at the onset of a trend and secondary signals during pullbacks or dips. It focuses on pinpointing optimal entry points during market pullbacks, enhancing the "TrendGuard Pullback Trader Indicators" script with well-timed signals for profit targets and stop loss levels.
Technical Composition:
The "TrendGuard Pullback Trader Signals" script combines various technical analysis tools to generate comprehensive trading signals. It calculates stop levels by assessing the highest and lowest bars over a chosen period, defining the market range. Primary signals are derived using a triple exponential moving average (EMA) of logarithmic closing prices, identifying trend changes with stop level plots and directional arrows. For secondary signals, the script uses a sequence of EMAs applied to the average price (HLC3) and an oscillator that measures the extremity of recent price movements, pinpointing potential entry points. The script also incorporates a sideways exit mechanism, comparing short-term and long-term EMAs of the average price to detect significant deviations, suggesting exit opportunities. This layered strategy offers a detailed perspective on market trends, momentum, and possible entry and exit points.
EMA-Based Trend Analysis Algorithm :
Utilizes an advanced algorithm that incorporates exponential moving averages (EMA) with specific length parameters. This algorithm analyzes the slope and direction of EMA lines to identify significant shifts in market trends.
Primary Signal Generation : Logarithmic and Triple EMA Function:
Primary signals are derived from a unique logarithmic function applied to price data, which is then processed through a series of three EMAs with distinct period settings. This combination targets potential trend initiation points by detecting shifts in the logarithmic trend curve.
Dynamic Stop Level Determination :
Employs a methodology involving the calculation of recent high and low price bars, adjusted by a factor that considers market volatility. This factor dynamically alters the sensitivity of the stop levels, aligning them with current market conditions.
Secondary Signal Identification During Pullbacks :
Secondary signals are identified through a complex comparison of the market's relative position to its moving averages. This involves calculating the divergence between price and moving averages, adjusted for the rate of change in the market, to flag strategic entry points during pullbacks.
Composite Market Trend Analysis for Signal Mechanism :
Signal generation integrates a composite of multiple technical indicators, each contributing unique mathematical calculations. This integration enhances the accuracy and reliability of entry and exit signals.
Practical Application in Trading :
> For trade initiation, primary signals are used to identify the start of potential trends, applying a specific mathematical threshold to confirm the trend change. Secondary signals focus on quantifying the pullback depth relative to recent market movements for additional entry opportunities.
> The script's dynamic stop loss adjustment incorporates a calculated moving average of recent highs and lows, providing a responsive and protective mechanism for open positions.
How to Use the Script:
Trade Initiation : Primary signals at trend onset can be used for potential entry points, or to simply establish a trend-bias, to watch for Strategic Entries signals.
Strategic Entries on Pullbacks : Secondary signals provide opportunities for additional entries or scaling into positions during pullbacks within the main trend.
Profit Targets and Exit Strategy : Profit target signals serve as potential exit points. For larger positions, consider partial exits at these targets while adjusting stop loss levels to secure profits, and hold the remaining position for further potential gains.
Dynamic Risk Management : Regularly adjust stop loss levels based on the script's dynamic stop level determination to protect against market reversals and lock in profits.
Integration with TrendGuard Pullback Trader Indicators:
The script is designed and intended to be used in conjunction with the "TrendGuard Pullback Trader Indicators ". This integration ensures a holistic approach to market analysis, combining the strengths of both scripts for a comprehensive understanding of market trends, momentum, and entry points.
Note: The lower indicators are from the 'TrendGuard Pullback Trader Indicators' script, complementing the 'TrendGuard Pullback Trader Signals' script seen here, which generates the 'cloud' and signals on the price chart.
The 'TrendGuard Pullback Traders Indicators” script can be found here :
Input Parameter Settings:
Important Usage Guidance: For seamless integration with its counterpart, the "TrendGuard Pullback Trader Indicators" script, it's crucial to align the input parameter settings across both scripts. When adjusting values from their defaults, ensure that corresponding parameters in both scripts are identically set. This synchronization is key to achieving a cohesive and accurate representation on your charts.
Intra-Bar Order Generation (IntraBar): Determines whether signals are generated within the current bar or only after it closes, enhancing flexibility in signal timing.
Stop Level Strength (StopLvlStr): Sets the strength for calculating stop levels, impacting the sensitivity of the script to market highs and lows for stop placement.
Primary Signal Display (PrimON_OFF): Toggles the visibility of primary signals on the chart, aiding in identifying trend initiation points.
Secondary Signal Display (SecON_OFF): Controls the display of secondary signals for opportunities during pullbacks, allowing traders to capitalize on additional entry points.
Stop Loss Level Display (StopLossLvls): Enables or disables the visualization of stop loss levels, crucial for risk management strategies.
Trend Length (TrendLen): Adjusts the length parameter for the EMA calculations, influencing how the script interprets trend duration and strength.
These parameters allow traders to customize the script’s functionality according to their trading style and preferences, ensuring a tailored approach to signal generation and risk management.
Trade Alerts:
The script includes an advanced alert system designed to notify traders of crucial trading signals. This can Especially be useful when using larger time frames where trade setups can take a longer period of time to develop:
Primary Buy/Sell Alerts: Alerts are triggered at primary signals, indicating potential trend initiation points for entering trades.
Secondary Buy/Sell Alerts: These alerts activate during secondary signals, highlighting opportunities within ongoing trends for strategic entries or exits.
Stop Loss Level Alerts: The script can alert traders when the price reaches or crosses the script-determined stop loss levels, aiding in timely decision-making for risk management.
Sideways Exit Alerts: Alerts for potential exits are generated in sideways market conditions, based on the script’s analysis of average price movements.
To set up these alerts, traders can use TradingView’s alert system to specify the conditions under which they receive notifications, such as when a certain shape (e.g., arrow up for buy, arrow down for sell) appears on the chart. This feature helps traders stay informed and react promptly to the dynamic market conditions.
The "TrendGuard Pullback Trader Signals " script is a meticulously crafted tool, essential for traders aiming to enhance their market analysis and decision-making across diverse trading environments. While the script offers advanced functionalities, it reaches its full potential when used alongside the "TrendGuard Pullback Trader Indicators" script. Traders are advised to familiarize themselves with both scripts for a well-rounded trading strategy.
As always, remember that trading involves risks and past performance is not indicative of future results.
You can see the “Author’s instructions" below to get immediate access to TrendGuard Pullback Trader Signals & the rest of the “Quantigenics Premium Indicator Suite”.
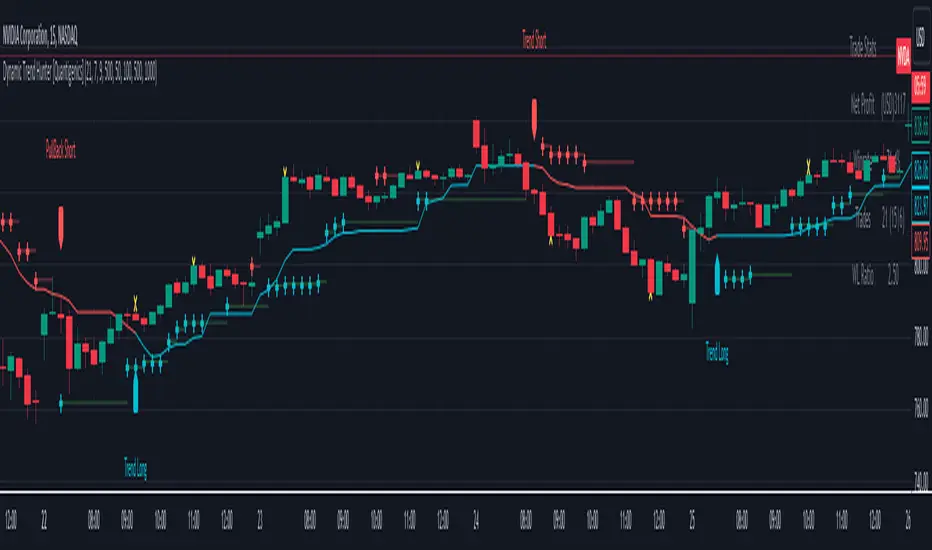
Dynamic Trend Hunter [Quantigenics]The "Dynamic Trend Hunter” script focuses on trend identification, dynamic entry and exit signals, and effective risk management. While a standalone trading script designed for versatile application across all markets, it can also be complemented by other indicators for enhanced analysis.
Core Features:
Dynamic Trend Indicator: Central to the script, this indicator discerns market trend direction using a color-coded system. Blue indicates an uptrend, red a downtrend, and a flat line signifies a sideways market.
Buy and Sell Signals: Provides clear, on-chart buy and sell signals to assist in identifying optimal entry points in alignment with the trend.
Profit Target Exits: A key feature designed to help traders lock in profits at strategic points. This feature uses a sophisticated mechanism (outlined in more detail below) to identify potential exit points, signaling the trader to close a position and secure gains before a potential market reversal.
Dynamic Stop Loss Levels: Essential for risk management, these levels adjust automatically, providing a mechanism for trailing stop losses and safeguarding against adverse market movements.
Technical Composition:
Dynamic Trend Indicator:
Calculation Method: Utilizes a blend of the highest and lowest prices over a specified length, averaged to create a trend line. This line is helpful in identifying the overall market trend.
Color Coding: The trend line changes color based on its relation to price action. A blue line indicates an uptrend when prices are consistently above this average line, while a red line signifies a downtrend when prices stay below it.
Signal-Based Trading:
Trend Entry Signals: Generated when there's a shift in the color of the trend line, indicating a potential change in market direction.
Pullback Entries: Identified when the closing price crosses the previous high (for long entries) or low (for short entries), while also considering the current trend line position.
Dynamic Stop Loss Levels:
Calculation: Stop loss levels are dynamically determined using the highest and lowest closing prices over the 'Length' period. These levels adjust with market movements, providing a trailing stop loss mechanism.
Visualization: Depicted as colored dots on the chart, changing in response to the market's movement relative to the trend line.
Oscillator for Dynamic Exits:
Mechanism: The script employs an oscillator to identify potential exit points, signaled by yellow dots. This oscillator is based on the relative extremity of the current price action compared to recent price movements.
Alerts: Dynamic exits trigger alerts when the oscillator reaches specified threshold levels, signaling potential market reversals or exhaustion points.
Customization and Flexibility:
Length Adjustment: The primary 'Length' input parameter allows traders to modify the sensitivity of the trend line and stop levels, catering to different trading styles and market conditions.
Alert Customization: Traders can set alerts for trend line changes and dynamic exits, ensuring timely responses to market movements.
Input Parameter Settings:
Intra-Bar Order Generation (IntraBar): Enables real-time signal generation within the current bar or after its closure.
Dynamic Exits (DynamicExits): Toggles the visibility of dynamic exit signals for profit-taking.
Dynamic Trend Length: Defines the lookback period for calculating the trend line. This length, which is adjustable and set by default to 21, specifies the number of bars over which the highest and lowest prices are analyzed to determine the trend line.
Dynamic Stop Loss Levels Length: This parameter defines the lookback period for calculating stop loss levels. It sets the number of bars used to determine the highest and lowest values for stop loss positioning. Adjusting this length allows traders to customize the sensitivity and placement of stop loss levels in accordance with their trading strategy and risk tolerance. This feature is crucial for tailoring stop loss settings to different market conditions and volatility levels, ensuring more effective risk management. Note: that initial stop loss levels, and tighter stop losses, can be set behind the Dynamic Trend Line itself.
Show Trend/Pullback Entries: Controls the display of specific entry signals based on trend continuation or market pullbacks.
Alert Settings: Options for setting alerts on trend line changes and dynamic exits, enhancing trade management.
Customizable Colors: Allows personalization of stop level and trend line colors for better chart visualization.
How to Trade with the Dynamic Trend Hunter:
Trend Following: Enter trades in the direction of the trend indicated by the color-coded trend line.
Pullback Entries: Look for pullback entry signals during established trends for additional entry points.
Dynamic Exits: Use yellow dot signals and dynamic stop loss levels for determining exit points or to adjust stop losses.
Risk Management: Employ the dynamic stop loss levels to manage risk effectively and protect against significant losses.
Alerts and Notifications:
Traders can set up alerts for trend line changes and dynamic exits, ensuring they are promptly informed about critical market movements and can react accordingly.
Conclusion:
The "Dynamic Trend Hunter " is a comprehensive and adaptable trading tool, suitable for various market conditions and trading styles. Its ability to provide clear trend indications, along with dynamic entry and exit signals, makes it an invaluable asset for traders aiming to enhance their market analysis and decision-making process. While it is a standalone system, it can be used in conjunction with other indicators to further refine trading strategies.
While we believe this tool may enhances your trading strategy, we encourage thorough familiarization before live trading. Remember, trading involves risk, and past performance is not indicative of future results.
You can see the “Author’s instructions" below to get immediate access to Dynamic Trend Hunter & the rest of the “Quantigenics Premium Indicator Suite”.
Targets For Many Indicators [LuxAlgo]The Targets For Many Indicators is a useful utility tool able to display targets for many built-in indicators as well as external indicators. Targets can be set for specific user-set conditions between two series of values, with the script being able to display targets for two different user-set conditions.
Alerts are included for the occurrence of a new target as well as for reached targets.
🔶 USAGE
Targets can help users determine the price limit where the price might start deviating from an indication given by one or multiple indicators. In the context of trading, targets can help secure profits/reduce losses of a trade, as such this tool can be useful to evaluate/determine user take profits/stop losses.
Due to these essentially being horizontal levels, they can also serve as potential support/resistances, with breakouts potentially confirming new trends.
In the above example, we set targets 3 ATR's away from the closing price when the price crosses over the script built-in SuperTrend indicator using ATR period 10 and factor 3. Using "Long Position Target" allows setting a target above the price, disabling this setting will place targets below the price.
Users might be interested in obtaining new targets once one is reached, this can be done by enabling "New Target When Reached" in the target logic setting section, resulting in more frequent targets.
Lastly, users can restrict new target creation until current ones are reached. This can result in fewer and longer-term targets, with a higher reach rate.
🔹 Dashboard
A dashboard is displayed on the top right of the chart, displaying the amount, reach rate of targets 1/2, and total amount.
This dashboard can be useful to evaluate the selected target distances relative to the selected conditions, with a higher reach rate suggesting the distance of the targets from the price allows them to be reached.
🔶 DETAILS
🔹 Indicators
Besides 'External' sources, each source can be set at 1 of the following Build-In Indicators :
ACCDIST : Accumulation/distribution index
ATR : Average True Range
BB (Middle, Upper or Lower): Bollinger Bands
CCI : Commodity Channel Index
CMO : Chande Momentum Oscillator
COG : Center Of Gravity
DC (High, Mid or Low): Donchian Channels
DEMA : Double Exponential Moving Average
EMA : Exponentially weighted Moving Average
HMA : Hull Moving Average
III : Intraday Intensity Index
KC (Middle, Upper or Lower): Keltner Channels
LINREG : Linear regression curve
MACD (macd, signal or histogram): Moving Average Convergence/Divergence
MEDIAN : median of the series
MFI : Money Flow Index
MODE : the mode of the series
MOM : Momentum
NVI : Negative Volume Index
OBV : On Balance Volume
PVI : Positive Volume Index
PVT : Price-Volume Trend
RMA : Relative Moving Average
ROC : Rate Of Change
RSI : Relative Strength Index
SMA : Simple Moving Average
STOCH : Stochastic
Supertrend
TEMA : Triple EMA or Triple Exponential Moving Average
VWAP : Volume Weighted Average Price
VWMA : Volume-Weighted Moving Average
WAD : Williams Accumulation/Distribution
WMA : Weighted Moving Average
WVAD : Williams Variable Accumulation/Distribution
%R : Williams %R
Each indicator is provided with a link to the Reference Manual or to the Build-In Indicators page.
The latter contains more information about each indicator.
Note that when "Show Source Values" is enabled, only values that can be logically found around the price will be shown. For example, Supertrend , SMA , EMA , BB , ... will be made visible. Values like RSI , OBV , %R , ... will not be visible since they will deviate too much from the price.
🔹 Interaction with settings
This publication contains input fields, where you can enter the necessary inputs per indicator.
Some indicators need only 1 value, others 2 or 3.
When several input values are needed, you need to separate them with a comma.
You can use 0 to 4 spaces between without a problem. Even an extra comma doesn't give issues.
The red colored help text will guide you further along (Only when Target is enabled)
Some examples that work without issues:
Some examples that work with issues:
As mentioned, the errors won't be visible when the concerning target is disabled
🔶 SETTINGS
Show Target Labels: Display target labels on the chart.
Candle Coloring: Apply candle coloring based on the most recent active target.
Target 1 and Target 2 use the same settings below:
Enable Target: Display the targets on the chart.
Long Position Target: Display targets above the price a user selected condition is true. If disabled will display the targets below the price.
New Target Condition: Conditional operator used to compare "Source A" and "Source B", options include CrossOver, CrossUnder, Cross, and Equal.
🔹 Sources
Source A: Source A input series, can be an indicator or external source.
External: External source if 'External" is selected in "Source A".
Settings: Settings of the selected indicator in "Source A", entered settings of indicators requiring multiple ones must be comma separated, for example, "10, 3".
Source B: Source B input series, can be an indicator or external source.
External: External source if 'External" is selected in "Source B".
Settings: Settings of the selected indicator in "Source B", entered settings of indicators requiring multiple ones must be comma separated, for example, "10, 3".
Source B Value: User-defined numerical value if "value" is selected in "Source B".
Show Source Values: Display "Source A" and "Source B" on the chart.
🔹 Logic
Wait Until Reached: When enabled will not create a new target until an existing one is reached.
New Target When Reached: Will create a new target when an existing one is reached.
Evaluate Wicks: Will use high/low prices to determine if a target is reached. Unselecting this setting will use the closing price.
Target Distance From Price: Controls the distance of a target from the price. Can be determined in currencies/points, percentages, ATR multiples, ticks, or using multiple of external values.
External Distance Value: External distance value when "External Value" is selected in "Target Distance From Price".

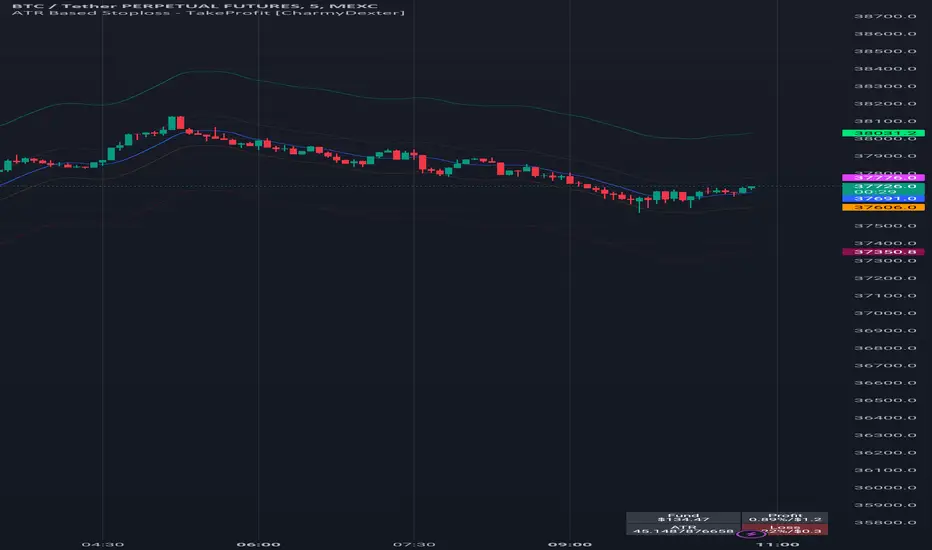
ATR Based Stoploss - TakeProfit [CharmyDexter]
This script combines the power of Average True Range (ATR) and a Moving Average (MA) to dynamically set stop-loss and take-profit levels. It introduces a volatility surge condition and includes a risk management table for comprehensive trade insights.
1) **Originality:**
- This script is original in its approach to combining Average True Range (ATR) with a Moving Average (MA) to create a dynamic stop-loss and take-profit strategy. The addition of a volatility surge condition and the inclusion of a risk management table further contribute to its uniqueness.
2) **Functionality:**
- The script aims to provide traders with a dynamic stop-loss and take-profit strategy based on ATR, incorporating a volatility surge condition and a moving average. The risk management table displays crucial information, including the fund size, potential profit/loss, ATR values, and risk.
3) **Operation:**
- The script uses ATR to calculate volatility, identifying surges in volatility. It adjusts the stop-loss and take-profit levels based on the average of ATR during these surge periods. The moving average acts as a trend indicator, and the script dynamically adjusts stop-loss and take-profit levels accordingly.
4) **Usage:**
- Traders can use this script by applying it to their preferred financial instrument's chart. The script automatically plots the moving average and dynamically adjusts stop-loss and take-profit levels based on ATR and volatility surges. Users can observe the levels on the chart for potential trade management.
5) **Concepts:**
- The script employs concepts of ATR for volatility, moving average for trend identification, and a dynamic adjustment mechanism during volatility surges. Risk management is incorporated by calculating potential profit/loss percentages based on user-defined risk.
6) **Mashup Explanation:**
- The script combines ATR, moving average, and volatility conditions to create a comprehensive strategy. ATR determines the market's volatility, the moving average serves as a trend indicator, and volatility surges trigger dynamic adjustments to stop-loss and take-profit levels. The risk management table enhances the script's utility.
7) **Line Descriptions:**
- Blue Line (Moving Average): Indicates the trend direction.
- Lime Line (Long Take Profit): Represents the level for taking profit in a long position.
- Maroon Line (Short Take Profit): Represents the level for taking profit in a short position.
- Fuchsia Line (Short Stop Loss): Represents the level for setting a stop loss in a short position.
- Orange Line (Long Stop Loss): Represents the level for setting a stop loss in a long position.
8) **Line Usage:**
- Use the blue line for trend identification.
- When taking long positions, the close should be above the blue line.
- For long positions, the lime line is a potential take-profit level, and the orange line is a potential stop-loss level.
- For short positions, the maroon line is a potential take-profit level, and the fuchsia line is a potential stop-loss level.
- The risk management table provides insights into fund size, potential profit/loss, ATR values, and risk.
Note: The profit/loss calculations in this script may not be entirely accurate due to factors like market execution. Market execution may not always occur at the exact levels specified by the script due to slippage or delays in order processing. This can impact the realized profit or loss compared to the calculated levels.
It is crucial to note that this ATR Based Stop-loss - Take-Profit indicator is merely one tool among many that traders can employ to establish trading targets. Additional technical indicators are essential for taking trades and making informed decisions.
Commented-out sections for alerts and shape plotting are provided, allowing for visual and auditory notifications if desired.
It's crucial for traders to be aware of these factors and use the script as a tool within a broader trading strategy. Additionally, regular monitoring and adjustments based on real-time market conditions are recommended to enhance the accuracy of profit/loss assessments.
Targets For Overlay Indicators [LuxAlgo]The Targets For Overlay Indicators is a useful utility tool able to display targets during crossings made between the price and external indicators on the user chart. Users can display a series of two targets, one for crossover events and another one for crossunder event.
Alerts are included for the occurrence of a new target as well as for reached targets.
🔶 USAGE
In order for targets to be displayed users need to select an appropriate input source from the "Source" drop-down input setting. In the example above we apply the indicator to a volatility stop.
This can also easily be done by adding the "Targets For Overlay Indicators" script on the VStop indicator directly.
Targets can help users determine the price limit where the price might start deviating from an indication given by one or multiple indicators. In the context of trading, targets can help secure profits/reduce losses of a trade, as such this tool can be useful to evaluate/determine user take profits/stop losses.
Due to these essentially being horizontal levels, they can also serve as potential support/resistances, with breakouts potentially confirming new trends.
Users might be interested in obtaining new targets once one is reached, this can be done by enabling "New Target When Reached" in the target logic setting section, resulting in more frequent targets.
Lastly, users can restrict new target creation until current ones are reached. This can result in fewer and longer-term targets, with a higher reach rate.
🔹 Examples
The indicator can be applied to many overlay indicators that naturally produce crosses with the price, such as moving average, trailing stops, bands...etc.
Users can use trailing stops such as the SuperTrend or VStop to more easily create clean targets. Do note that certain SuperTrend scripts separate the upper and lower extremities of the SuperTrend into two different plot, which cannot be used with this tool, you may use the provided SuperTrend script below to have a compatible version with our tool:
//@version=5
indicator("SuperTrend", overlay = true)
factor = input.float(3, 'Factor', minval = 0)
atrLen = input.int(10, 'ATR Length', minval = 1)
= ta.supertrend(factor, atrLen)
plot(spt, 'SuperTrend', dir != dir ? na : dir < 0 ? #089981 : #f23645, 2)
plot(spt, 'Circles', dir > dir ? #f23645 : dir < dir ? #089981 : na, 3, plot.style_circles)
Using moving averages can produce more targets than other overlay indicators.
Users can apply the tool twice when using bands or any overlay indicator returning two outputs, using crossover targets for obtaining targets using the upper band as source and crossunder targets for targets using the lower band. We can also use the Trendlines with breaks indicator as example:
🔹 Dashboard
A dashboard is displayed on the top right of the chart, displaying the amount, reach rate of targets 1/2, and total amount.
This dashboard can be useful to evaluate the selected target distances relative to the selected conditions, with a higher reach rate suggesting the distance of the targets from the price allows them to be reached.
🔶 SETTINGS
Source: Indicator source used to create targets. Targets are created when the closing price crosses the specified source.
Show Target Labels: Display target labels on the chart.
Candle Coloring: Apply candle coloring based on the most recent active target.
🔹 Target
Crossover and Crossunder targets use the same settings below:
Show Target: Determines if the target is displayed or not.
Above Price Target: If selected, will create targets above the closing price.
Wait Until Reached: When enabled will not create a new target until an existing one is reached.
New Target When Reached: Will create a new target when an existing one is reached.
Evaluate Wicks: Will use high/low prices to determine if a target is reached. Unselecting this setting will use the closing price.
Target Distance From Price: Controls the distance of a target from the price. Can be determined in currencies/points, percentages, ATR multiples, or ticks.

Confluence Buy-Sell Indicator with Fibonacci The script is a "Confluence Indicator with Fibonacci" designed to work on the TradingView platform. This indicator combines multiple technical analysis strategies to generate buy and sell signals based on user-defined confluence criteria. Here's a breakdown of its features:
Confluence Criteria: Users can enable or disable various strategies like MACD, RSI, Bollinger Bands, Divergence, Fibonacci, and Moving Average. The number of strategies that need to align for a signal to be generated can be set by the user.
Strategies Included:
MACD Strategy: Uses the Moving Average Convergence Divergence method to identify buy/sell opportunities.
RSI Strategy: Utilizes the Relative Strength Index to detect overbought or oversold conditions.
Bollinger Bands Strategy: Incorporates Bollinger Bands to identify volatility and potential buy/sell signals.
Divergence Strategy: A basic implementation that detects bullish and bearish divergences using the RSI.
Fibonacci Strategy: Uses Fibonacci retracement levels to determine potential support and resistance levels.
Moving Average Strategy: Employs a crossover system between the 50-period and 200-period simple moving averages.
Additional Features:
Support & Resistance: Identifies major support and resistance levels from the last 50 bars.
Pivot Points: Calculates pivot points to determine potential turning points.
Stop Loss Levels: Automatically calculates and plots stop-loss levels for buy and sell signals.
NYC Midnight Level: Option to display the New York City midnight price level.
Visualization: Plots buy and sell signals on the chart with green and red markers respectively.
Adequate Category:
"Technical Analysis Indicators & Overlays" or "Strategy & Scripting Tools".

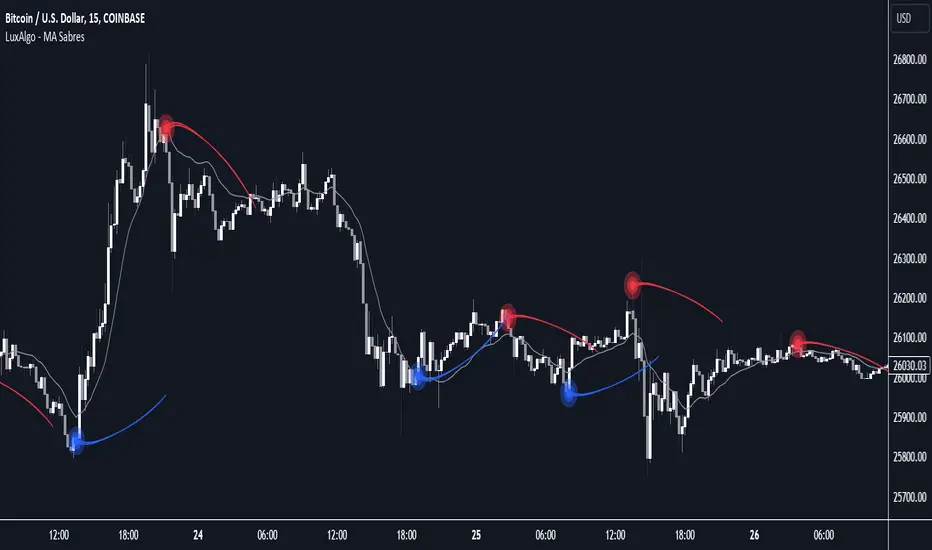
MA Sabres [LuxAlgo]The "MA Sabres" indicator highlights potential trend reversals based on a moving average direction. Detected reversals are accompanied by an extrapolated "Sabre" looking shape that can be used as support/resistance and as a source of breakouts.
🔶 USAGE
If a selected moving average (MA) continues in the same direction for a certain time, a change in that direction could signify a potential reversal.
In this publication, when a trend change occurs, a sabre-shaped figure is drawn which can be used as support/resistance:
A sabre can be indicative of a direction, however, it can also act as a stop-loss when the price should go in the opposite direction:
Or show potential areas of interest:
🔶 DETAILS
This publication will look for a change in direction after the MA went in the same direction during x consecutive bars (settings: " Reversal after x bars in the same direction ").
Then a circle-shaped drawing will be drawn 1 bar back, at the previous high/low, dependable of the previous direction.
From there originates a sabre-shaped figure where the tip lies as far as the user-set MA length.
The angle of the "sabre" relies on the ATR of the previous 14 bars.
Less volatility will create a flatter sabre while the opposite is true when there is more volatility in the previous 14 bars.
The sabre is created by the latest feature, polylines , which enables us to connect several 'points', resulting in a polyline.new() object.
Do note that sabres are offset by one bar to the past to align their locations.
🔶 SETTINGS
MA Type: SMA, EMA, SMMA (RMA), HullMA, WMA, VWMA, DEMA, TEMA, NONE (off)
Length: this sets the length of MA, and the length of the sabre shape
Previous Trend Duration: After the MA direction is the same for x consecutive bars, the first time the direction changes, a sabre is drawn
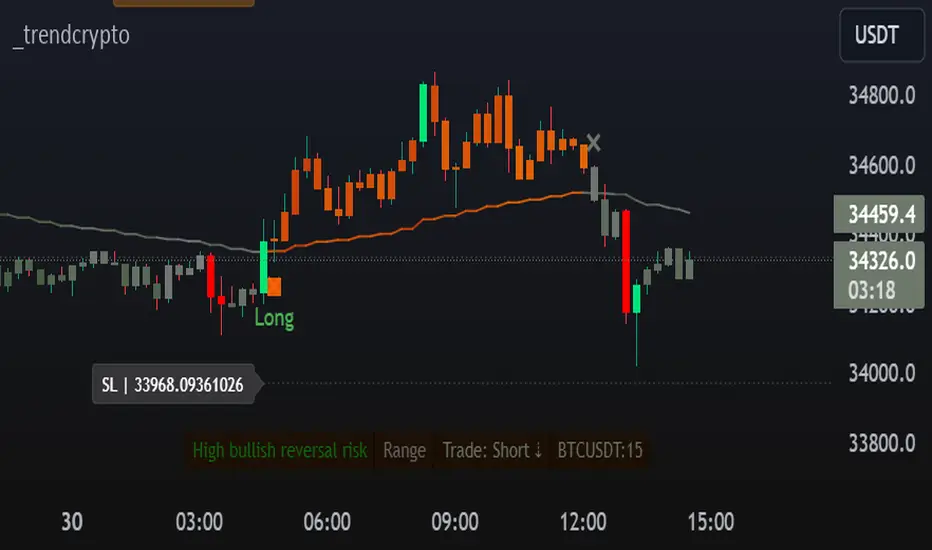
TrendCryptoThe _trendcrypto script is a trading strategy that uses a variety of indicators to identify potential trading opportunities, including the Parabolic SAR, ADX, and RSI.
The script first calculates the RMA, SMA, and trend direction. The RMA is a moving average that is weighted more heavily towards recent prices. The SMA is a simple moving average that gives equal weight to all prices in the period. The trend direction is calculated by comparing the current price to the price a certain number of periods ago.
The script then uses the RMA, SMA, and trend direction to identify potential trading opportunities. If the current price is above the RMA and the trend direction is up, the script will generate a buy signal. If the current price is below the RMA and the trend direction is down, the script will generate a sell signal.
The script also calculates the Parabolic SAR, which is a technical indicator that helps traders identify potential trend reversals. The Parabolic SAR is calculated using a formula that takes into account the high and low prices of a security over a specified period of time.
The script also calculates the ADX, which is a trend strength indicator. The ADX is calculated using a formula that takes into account the difference between the high and low prices of a security, as well as the difference between the closing price and the previous close.
The script also calculates the RSI, which is a momentum indicator that measures the magnitude of recent price changes to evaluate overbought or oversold conditions in the price of a stock or other asset. The RSI is calculated over a specified period of time, and the default value in the code is 14.
The script also allows users to specify a stop loss and take profit level for each trade. The default stop loss level is 4% and the default take profit level is 7%.
Machine Learning: SuperTrend Strategy TP/SL [YinYangAlgorithms]The SuperTrend is a very useful Indicator to display when trends have shifted based on the Average True Range (ATR). Its underlying ideology is to calculate the ATR using a fixed length and then multiply it by a factor to calculate the SuperTrend +/-. When the close crosses the SuperTrend it changes direction.
This Strategy features the Traditional SuperTrend Calculations with Machine Learning (ML) and Take Profit / Stop Loss applied to it. Using ML on the SuperTrend allows for the ability to sort data from previous SuperTrend calculations. We can filter the data so only previous SuperTrends that follow the same direction and are within the distance bounds of our k-Nearest Neighbour (KNN) will be added and then averaged. This average can either be achieved using a Mean or with an Exponential calculation which puts added weight on the initial source. Take Profits and Stop Losses are then added to the ML SuperTrend so it may capitalize on Momentum changes meanwhile remaining in the Trend during consolidation.
By applying Machine Learning logic and adding a Take Profit and Stop Loss to the Traditional SuperTrend, we may enhance its underlying calculations with potential to withhold the trend better. The main purpose of this Strategy is to minimize losses and false trend changes while maximizing gains. This may be achieved by quick reversals of trends where strategic small losses are taken before a large trend occurs with hopes of potentially occurring large gain. Due to this logic, the Win/Loss ratio of this Strategy may be quite poor as it may take many small marginal losses where there is consolidation. However, it may also take large gains and capitalize on strong momentum movements.
Tutorial:
In this example above, we can get an idea of what the default settings may achieve when there is momentum. It focuses on attempting to hit the Trailing Take Profit which moves in accord with the SuperTrend just with a multiplier added. When momentum occurs it helps push the SuperTrend within it, which on its own may act as a smaller Trailing Take Profit of its own accord.
We’ve highlighted some key points from the last example to better emphasize how it works. As you can see, the White Circle is where profit was taken from the ML SuperTrend simply from it attempting to switch to a Bullish (Buy) Trend. However, that was rejected almost immediately and we went back to our Bearish (Sell) Trend that ended up resulting in our Take Profit being hit (Yellow Circle). This Strategy aims to not only capitalize on the small profits from SuperTrend to SuperTrend but to also capitalize when the Momentum is so strong that the price moves X% away from the SuperTrend and is able to hit the Take Profit location. This Take Profit addition to this Strategy is crucial as momentum may change state shortly after such drastic price movements; and if we were to simply wait for it to come back to the SuperTrend, we may lose out on lots of potential profit.
If you refer to the Yellow Circle in this example, you’ll notice what was talked about in the Summary/Overview above. During periods of consolidation when there is little momentum and price movement and we don’t have any Stop Loss activated, you may see ‘Signal Flashing’. Signal Flashing is when there are Buy and Sell signals that keep switching back and forth. During this time you may be taking small losses. This is a normal part of this Strategy. When a signal has finally been confirmed by Momentum, is when this Strategy shines and may produce the profit you desire.
You may be wondering, what causes these jagged like patterns in the SuperTrend? It's due to the ML logic, and it may be a little confusing, but essentially what is happening is the Fast Moving SuperTrend and the Slow Moving SuperTrend are creating KNN Min and Max distances that are extreme due to (usually) parabolic movement. This causes fewer values to be added to and averaged within the ML and causes less smooth and more exponential drastic movements. This is completely normal, and one of the perks of using k-Nearest Neighbor for ML calculations. If you don’t know, the Min and Max Distance allowed is derived from the most recent(0 index of data array) to KNN Length. So only SuperTrend values that exhibit distances within these Min/Max will be allowed into the average.
Since the KNN ML logic can cause these exponential movements in the SuperTrend, they likewise affect its Take Profit. The Take Profit may benefit from this movement like displayed in the example above which helped it claim profit before then exhibiting upwards movement.
By default our Stop Loss Multiplier is kept quite low at 0.0000025. Keeping it low may help to reduce some Signal Flashing while not taking extra losses more so than not using it at all. However, if we increase it even more to say 0.005 like is shown in the example above. It can really help the trend keep momentum. Please note, although previous results don’t imply future results, at 0.0000025 Stop Loss we are currently exhibiting 69.27% profit while at 0.005 Stop Loss we are exhibiting 33.54% profit. This just goes to show that although there may be less Signal Flashing, it may not result in more profit.
We will conclude our Tutorial here. Hopefully this has given you some insight as to how Machine Learning, combined with Trailing Take Profit and Stop Loss may have positive effects on the SuperTrend when turned into a Strategy.
Settings:
SuperTrend:
ATR Length: ATR Length used to create the Original Supertrend.
Factor: Multiplier used to create the Original Supertrend.
Stop Loss Multiplier: 0 = Don't use Stop Loss. Stop loss can be useful for helping to prevent false signals but also may result in more loss when hit and less profit when switching trends.
Take Profit Multiplier: Take Profits can be useful within the Supertrend Strategy to stop the price reverting all the way to the Stop Loss once it's been profitable.
Machine Learning:
Only Factor Same Trend Direction: Very useful for ensuring that data used in KNN is not manipulated by different SuperTrend Directional data. Please note, it doesn't affect KNN Exponential.
Rationalized Source Type: Should we Rationalize only a specific source, All or None?
Machine Learning Type: Are we using a Simple ML Average, KNN Mean Average, KNN Exponential Average or None?
Machine Learning Smoothing Type: How should we smooth our Fast and Slow ML Datas to be used in our KNN Distance calculation? SMA, EMA or VWMA?
KNN Distance Type: We need to check if distance is within the KNN Min/Max distance, which distance checks are we using.
Machine Learning Length: How far back is our Machine Learning going to keep data for.
k-Nearest Neighbour (KNN) Length: How many k-Nearest Neighbours will we account for?
Fast ML Data Length: What is our Fast ML Length?? This is used with our Slow Length to create our KNN Distance.
Slow ML Data Length: What is our Slow ML Length?? This is used with our Fast Length to create our KNN Distance.
If you have any questions, comments, ideas or concerns please don't hesitate to contact us.
HAPPY TRADING!

Auto Trailing stoploss By InvestYourAsset💥The Auto Trailing Stop-Loss indicator is a technical indicator that uses the ATR (Average True Range) to calculate a trailing stop-loss for both long and short positions.
💥The signals according to the indicator allows traders to exit from the position before its too late! The indicator can be used to determine when to enter and exit trades.
💥To use the indicator, you simply need to set the input parameters to suit your trading style and risk tolerance. The default values for the parameters are:
p: The ATR period (14)
q: The stop period (20)
x: The multiplier used to calculate the initial high and initial low (1.5)
Calculations:
📈Calculates the ATR using the specified period you can modify ATR period according to your trading style.
📈Calculates the initial high and low stop levels based on the highest high and lowest low over the user defined ATR period.
📈Calculates short and long stoploss levels using the initial high and low stops.
💥Once you have set the input parameters according to your trading style whether you are a day trader or a swing trader, the indicator will plot the short stoploss, long stoploss, and stoploss hit signals on your chart.
💥You can use the indicator to enter and exit trades in a various ways.
For example,
🚀 you could enter a long trade when the price crosses above both red and green lines plotted on the chart. (or when price crosses over both short stoploss and long stoploss.) You could also use the indicator to secure your profits by moving your stop-loss up as the price moves in your favor.
Here is an example of how you could use the indicator to enter and exit trades:
🚀Enter a long trade when the price crosses above the red line or short stoploss.
✅keep Moving your stop-loss upward with the long stoploss or green line.
✅Exit the trade when the price crosses below the long stoploss or green line.
💥You can also use the indicator to protect your existing trades. For example, if you are already in a long trade, you could move your stop-loss up to the short stop when the price moves up 10%. This will help you to protect your profits in case the price starts to move against you.
💥💥some additional tips for using the Auto Trailing Stop-Loss indicator:
✅Use the indicator in conjunction with other technical indicators or your own trading strategy to generate entry and exit signals.
✅Backtest your trading strategy before using it live to make sure that it is profitable.
✅Use the indicator to protect your profits by moving your stop-loss up as the price moves in your favor.
✅ Always follow risk management rules and manage your position sizing according to your risk appetite.
✅ Be aware of the overall trend direction. If the trend is up, you should be looking for bullish reversals or continuations. If the trend is down, you should be looking for bearish reversals or continuations.
This script essentially provides a visual representation of a trading strategy that automatically adjusts stop-loss levels based on market volatility (ATR). It also includes signals for entering long or short positions and visually highlights these signals on the chart.
📣📣Follow us for timely updates regarding future indicators and give it a like if you appreciate the work.📣📣

Curved Management (Zeiierman)█ Overview
The Curved Management (Zeiierman) is a trade management indicator tailored for traders looking to visualize their entry, stop loss, and take profit levels. Unique in its design, this indicator doesn't just display lines; it offers rounded or curved visualizations, setting it apart from conventional tools.
█ How It Works
At its core, this indicator leverages the power of the Average True Range (ATR), a metric for volatility, to establish logical stop-loss levels based on recent price action. By incorporating the ATR, the tool dynamically adapts to the market's changing volatility. What sets it apart is the unique curved visualization. Instead of the usual straight lines representing entry/sl levels, users can choose between rounded and straight edges for their take profit and stop loss levels. This aesthetic tweak gives the chart a cleaner look and offers a more intuitive understanding of risk management.
█ How to Apply the Indicator
Upon initially loading the indicator, a label appears that reads, "Set the 'xy' time and price for 'Curved Management (Zeiierman).'" This prompts you to click on the chart at your entry point. After selecting your entry point on the chart, the indicator will load. Ensure you adjust the trend direction in the settings panel based on whether you took a long or short position.
█ How to Use
Use the tool to manage your active position.
Long Entry
Short Entry
█ Settings
The indicator comes packed with various settings allowing customization:
Trade Direction
Decide the direction of the trade (long/short).
Reward multiplier
Sets the ratio for take profit relative to stop loss. Increasing this value will set your take profit further from the entry, and decreasing it will bring it closer.
Risk multiplier
Multiplier for calculating stop loss based on the ATR value. Increasing this makes your stop loss further from the entry, while decreasing brings it closer.
█ Related Free Scripts
Trade & Risk Management Tool
-----------------
Disclaimer
The information contained in my Scripts/Indicators/Ideas/Algos/Systems does not constitute financial advice or a solicitation to buy or sell any securities of any type. I will not accept liability for any loss or damage, including without limitation any loss of profit, which may arise directly or indirectly from the use of or reliance on such information.
All investments involve risk, and the past performance of a security, industry, sector, market, financial product, trading strategy, backtest, or individual's trading does not guarantee future results or returns. Investors are fully responsible for any investment decisions they make. Such decisions should be based solely on an evaluation of their financial circumstances, investment objectives, risk tolerance, and liquidity needs.
My Scripts/Indicators/Ideas/Algos/Systems are only for educational purposes!

Interactive MA Stop Loss [TANHEF]This indicator is "Interactive." Once added to the chart, you need to click the start point for the moving average stoploss. Dragging it afterward will modify its position.
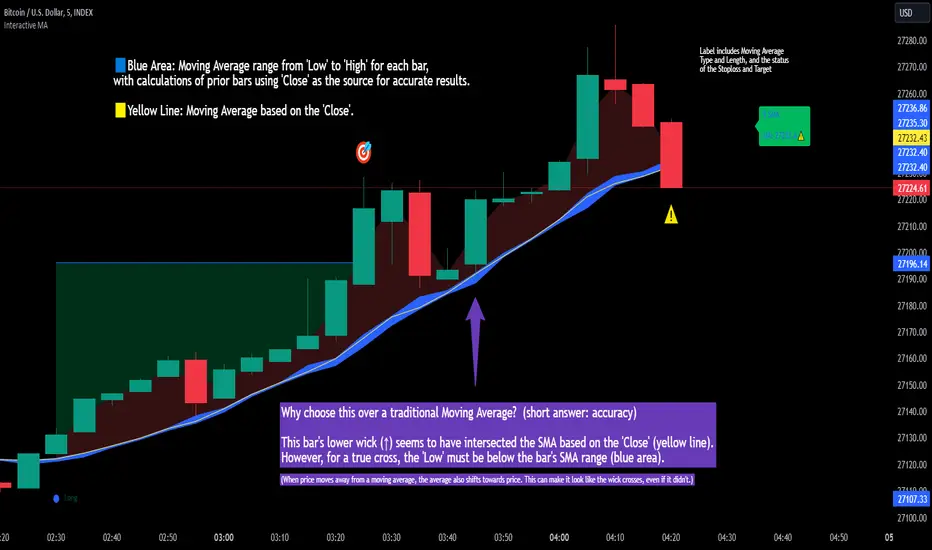
Why choose this indicator over a traditional Moving Average?
To accurately determine that a wick has crossed a moving average, you must examine the moving average's range on that bar (blue area on this indicator) and ensure the wick fully traverses this area.
When the price moves away from a moving average, the average also shifts towards the price. This can make it look like the wick crossed the average, even if it didn't.
How is the moving average area calculated?
For each bar, the moving average calculation is standard, but when the current bar is involved, its high or low is used instead of the close. For precise results, simply setting the source in a typical moving average calculation to 'Low' or 'High' is not sufficient in calculating the moving average area on a current bar.
Moving Average Options:
Simple Moving Average
Exponential Moving Average
Relative Moving Average
Weighted Moving Average
Indicator Explanation
After adding indicator to chart, you must click on a location to begin an entry.
The moving average type can be set and length modified to adjust the stoploss. An optional profit target may be added.
A symbol is display when the stoploss and profit target are hit. If a position is create that is not valid, "Overlapping MA and Bar" is displayed.
Alerts
'Check' alerts to use within indicator settings (stop hit and/or profit target hit).
Select 'Create Alert'
Set the condition to 'Interactive MA''
Select create.
Alert messages can have additional details using these words in between two Curly (Brace) Brackets:
{{stop}} = MA stop-loss (price)
{{upper}} = Upper MA band (price)
{{lower}} = Lower MA band (price)
{{band}} = Lower or Upper stoploss (word)
{{type}} = Long or Short stop-loss (word)
{{stopdistance}} = Stoploss Distance (%)
{{targetdistance}} = Target Distance (%)
{{starttime}} = Start time of stoploss (day:hour:minute)
{{maLength}} = MA Length (input)
{{maType}} = MA Type (input)
{{target}} = Price target (price)
{{trigger}} = Wick or Close Trigger input (input)
{{ticker}} = Ticker of chart (word)
{{exchange}} = Exchange of chart (word)
{{description}} = Description of ticker (words)
{{close}} = Bar close (price)
{{open}} = Bar open (price)
{{high}} = Bar high (price)
{{low}} = Bar low (price)
{{hl2}} = Bar HL2 (price)
{{volume}} = Bar volume (value)
{{time}} = Current time (day:hour:minute)
{{interval}} = Chart timeframe
{{newline}} = New line for text
I will add further moving averages types in the future. If you suggestions post them below.
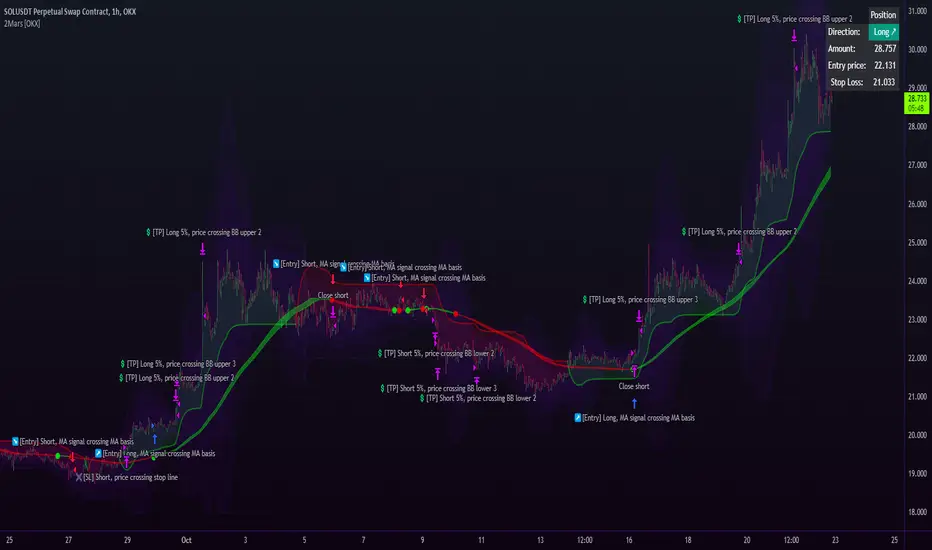
2Mars strategy [OKX]The strategy is based on the intersection of two moving averages, which requires adjusting the parameters (ratio and multiplier) for the moving average.
Basis MA length: multiplier * ratio
Signal MA length: multiplier
The SuperTrend indicator is used for additional confirmation of entry into a position.
Bollinger Bands and position reversal are used for take-profit.
About stop loss:
If activated, the stop loss price will be updated on every entry.
Basic setup:
Additional:
Alerts for OKX:
Triple Ehlers Market StateClear trend identification is an important aspect of finding the right side to trade, another is getting the best buying/selling price on a pullback, retracement or reversal. Triple Ehlers Market State can do both.
Three is always better
Ehlers’ original formulation produces bullish, bearish and trendless signals. The indicator presented here gate stages three correlation cycles of adjustable lengths and degree thresholds, displaying a more refined view of bullish, bearish and trendless markets, in a compact and novel way.
Stick with the default settings, or experiment with the cycle period and threshold angle of each cycle, then choose whether ‘Recent trend weighting’ is included in candle colouring.
John Ehlers is a highly respected trading maths head who may need no introduction here. His idea for Market State was published in TASC June 2020 Traders Tips. The awesome interpretation of Ehlers’ work on which Triple Ehlers Market State’s correlation cycle calculations are based can be found at:
DISCLAIMER: None of this is financial advice.

RSI + FIB HH LL StopLoss Finder/Contrarian TradesThis indicator is a multi-timeframe indicator that works in any timeframe.
It takes a price reading of the highest or lowest bar in the past based on Fibonacci numbers and plots it.
In addition, the RSI smoothed by a 5-day moving average can be used to detect signs that previous highs or lows will be reached in advance.
This gives insight into determining stop-loss values or entering the market in a contrarian manner.
This is an example of BTCUSDT 4Hour Chart
Here is BTCUSDT 1Hour Chart
For scalpers BTCUSDT 15min Chart Example
Fibonacci Number is 1, 1, 2, 3, 5, 8, 13, 21, 34, 55, 89, 144, 233, 377, 610, 987, 1597, ...
FIbonacci Ratio is 0.236, 0.382, 0.5, 0.618, 1, 1.618, 2.618, 4.236, ...

Long-Only Opening Range Breakout (ORB) with Pivot PointsIntraday Trading Strategy: Long-Only Opening Range Breakout (ORB) with Pivot Points
Background:
Opening Range Breakout (ORB) is a popular long-only trading strategy that capitalizes on the early morning volatility in financial markets. It's based on the idea that the initial price movements during the first few minutes or hours of the trading day can set the tone for the rest of the session. The strategy involves identifying a price range within which the asset trades during the opening period and then taking long positions when the price breaks out to the upside of this range.
Pivot Points are a widely used technical indicator in trading. They represent potential support and resistance levels based on the previous day's price action. Pivot points are calculated using the previous day's high, low, and close prices and can help traders identify key price levels for making trading decisions.
How to Use the Script:
Initialization: This script is written in Pine Script, a domain-specific language for trading strategies on the TradingView platform. To use this script, you need to have access to TradingView.
Apply the Script: You can do this by adding it to your favorites, then selecting the script in the indicators list under favorites or by searching for it by name under community scripts.
Customize Settings: The script allows you to customize various settings through the TradingView interface. These settings include:
Opening Session: You can set the time frame for the opening session.
Max Trades per Day: Specify the maximum number of long trades allowed per trading day.
Initial Stop Loss Type: Choose between using a percentage-based stop loss or the previous candles low for stop loss calculations.
Stop Loss Percentage: If you select the percentage-based stop loss, specify the percentage of the entry price for the stop loss.
Backtesting Start and End Time: Set the time frame for backtesting the strategy.
Strategy Signals:
The script will display pivot points in blue (R1, R2, R3, R4, R5) and half-pivot points in gray (R0.5, R1.5, R2.5, R3.5, R4.5) on your chart.
The green line represents the opening range.
The script generates long (buy) signals based on specific conditions:
---The open price is below the opening range high (h).
---The current high price is above the opening range high.
---Pivot point R1 is above the opening range high.
---It's a long-only strategy designed to capture upside breakouts.
---It also respects the maximum number of long trades per day.
The script manages long positions, calculates stop losses, and adjusts long positions according to the defined rules.
Trailing Stop Mechanism
The script incorporates a dynamic trailing stop mechanism designed to protect and maximize profits for long positions. Here's how it works:
1. Initialization:
The script allows you to choose between two types of initial stop loss:
---Percentage-based: This option sets the initial stop loss as a percentage of the entry price.
---Previous day's low: This option sets the initial stop loss at the previous day's low.
2. Setting the Initial Stop Loss (`sl_long0`):
The initial stop loss (`sl_long0`) is calculated based on the chosen method:
---If "Percentage" is selected, it calculates the stop loss as a percentage of the entry price.
---If "Previous Low" is selected, it sets the stop loss at the previous day's low.
3. Dynamic Trailing Stop (`trail_long`):
The script then monitors price movements and uses a dynamic trailing stop mechanism (`trail_long`) to adjust the stop loss level for long positions.
If the current high price rises above certain pivot point levels, the trailing stop is adjusted upwards to lock in profits.
The trailing stop levels are calculated based on pivot points (`r1`, `r2`, `r3`, etc.) and half-pivot points (`r0.5`, `r1.5`, `r2.5`, etc.).
The script checks if the high price surpasses these levels and, if so, updates the trailing stop accordingly.
This dynamic trailing stop allows traders to secure profits while giving the position room to potentially capture additional gains.
4. Final Stop Loss (`sl_long`):
The script calculates the final stop loss level (`sl_long`) based on the following logic:
---If no position is open (`pos == 0`), the stop loss is set to zero, indicating there is no active stop loss.
---If a position is open (`pos == 1`), the script calculates the maximum of the initial stop loss (`sl_long0`) and the dynamic trailing stop (`trail_long`).
---This ensures that the stop loss is always set to the more conservative of the two values to protect profits.
5. Plotting the Stop Loss:
The script plots the stop loss level on the chart using the `plot` function.
It will only display the stop loss level if there is an open position (`pos == 1`) and it's not a new trading day (`not newday`).
The stop loss level is shown in red on the chart.
By combining an initial stop loss with a dynamic trailing stop based on pivot points and half-pivot points, the script aims to provide a comprehensive risk management mechanism for long positions. This allows traders to lock in profits as the price moves in their favor while maintaining a safeguard against adverse price movements.
End of Day (EOD) Exit:
The script includes an "End of Day" (EOD) exit mechanism to automatically close any open positions at the end of the trading day. This feature is designed to manage and control positions when the trading day comes to a close. Here's how it works:
1. Initialization:
At the beginning of each trading day, the script identifies a new trading day using the `is_newbar('D')` condition.
When a new trading day begins, the `newday` variable becomes `true`, indicating the start of a new trading session.
2. Plotting the "End of Day" Signal:
The script includes a plot on the chart to visually represent the "End of Day" signal. This is done using the `plot` function.
The plot is labeled "DayEnd" and is displayed as a comment on the chart. It signifies the EOD point.
3. EOD Exit Condition:
When the script detects that a new trading day has started (`newday == true`), it triggers the EOD exit condition.
At this point, the script proceeds to close all open positions that may have been active during the trading day.
4. Closing Open Positions:
The `strategy.close_all` function is used to close all open positions when the EOD exit condition is met.
This function ensures that any remaining long positions are exited, regardless of their current profit or loss.
The function also includes an `alert_message`, which can be customized to send an alert or notification when positions are closed at EOD.
Purpose of EOD Exit
The "End of Day" exit mechanism serves several essential purposes in the trading strategy:
Risk Management: It helps manage risk by ensuring that positions are not left open overnight when markets can experience increased volatility.
Capital Preservation: Closing positions at EOD can help preserve trading capital by avoiding potential adverse overnight price movements.
Rule-Based Exit: The EOD exit is rule-based and automatic, ensuring that it is consistently applied without emotions or manual intervention.
Scalability: It allows the strategy to be applied to various markets and timeframes where EOD exits may be appropriate.
By incorporating an EOD exit mechanism, the script provides a comprehensive approach to managing positions, taking profits, and minimizing risk as each trading day concludes. This can be especially important in volatile markets like cryptocurrencies, where overnight price swings can be significant.
Backtesting: The script includes a backtesting feature that allows you to test the strategy's performance over historical data. Set the start and end times for backtesting to see how the long-only strategy would have performed in the past.
Trade Execution: If you choose to use this script for live trading, make sure you understand the risks involved. It's essential to set up proper risk management, including position sizing and stop loss orders.
Monitoring: Monitor the long-only strategy's performance over time and be prepared to make adjustments as market conditions change.
Disclaimer: Trading carries a risk of capital loss. This script is provided for educational purposes and as a starting point for your own long-only strategy development. Always do your own research and consider seeking advice from a qualified financial professional before making trading decisions.

Tribute to David PaulI made this indicator as a tribute to the late David Paul .
He mentioned quite a lot about 89 periods moving average (especially on 4h), also the 21 and 55.
I put up some entries when three ma are crossed by price in the same direction, bull/bear backgrounds and a color code for candles because who doesn't love the feeling of a lasting trend.
To be more specific :
The indicator plots sma21, sma55, sma89 and AMA = (sma21+sma55+sma89)/3
When the closing price crosses the highest of the 3 sma, it is considered a bullish confirmation.
At this moment two lines appear, one on the bottom of the candle that crossed, one on the crossing point.
The lowest line can be used as the stop loss value of a long.
The highest line can be used as an entry point for a long.
When the closing price crosses the lowest of the 3 sma, it is considered a bearish confirmation.
At this moment two lines appear, one on the top of the candle that crossed, one on the crossing point.
The highest line can be used as the stop loss value of a short.
The lowest line can be used as an entry point for shorts.
When the closing price is above AMA, it is considered a bullish confirmation.
At this time a blue background appears at the crossing point.
The highest line can be used as the stop loss value for a long.
The starting point of the background can be used as the entry point for a long.
When the closing price is below AMA, it is considered a bearish confirmation.
At this time a red background appears at the crossing point.
The highest line can be used as the stop loss value for a short.
The starting point of the background can be used as the entry point for a short.
When the price is above 3 sma the candles turn blue. Signifying an upward trend.
When the price is below 3 sma the candles turn red. Signifying a bearish trend.
When the price is neither simultaneously above nor below the 3 sma, the candles are gray and the background linked to AMA becomes less vivid. Meaning a loss of vitality of the current trend or an absence of a clear trend.
Ideally, you should take a position towards "Real Long/Short Entry", set your stop loss towards "Ideal Long/Short Entry", and close the trade either when the background ends (riskier but more potential), or when the candles become gray (more conservative but noisier).
In the inputs, you can modify the display rules (explained in the tooltips), by default everything is displayed.

Liquidity Concepts [BigBeluga]The Liquidity Concepts indicator is designed to represent the liquidity on the chart using pivot points as potential stop-losses / liquidity grabs.
The indicator is facilitated by a market structure detector and pivot points to identify resting liquidity / stop-loss levels.
A liquidity grab or a stop-loss hunt is when retail traders place their stop-loss orders at recent highs / most recent highs or lows. This is a spot where big players attempt to push the market to trigger all the stop-loss orders and gain a better entry in their favor.
🔶 CALCULATION
The indicator uses the Higher Lower script made by @LonesomeTheBlue to determine these pivot points. When a pivot point is formed, it is displayed on the chart with the corresponding symbol (HH - HL - LH - LL). When one of these points is broken, a line is drawn between the pivot point and the candle that broke it.
A liquidity grab is only recognized after it has occurred, and it is represented with a box showing all the candles that were involved in the sweep / stop-loss hunt.
A pivot point is established only after the selected lookback period and cannot be printed beforehand in any manner. This ensures that it captures the highest point within the lookback period following the candle formation.
An HL (Higher Low) point is established when it is lower than an HH (Higher High) point, whereas an LH (Lower High) point is established when it is higher than an LL (Lower Low) point.
Boxes are formed in two different types: Major and Minor.
- Major boxes occur when LH or HL points are breached, with their high or low point crossing above or below in the specific lookback period.
- Minor boxes occur when HH or LL points are breached, with their high or low point crossing above or below in the specific lookback period.
Minor points are less efficient since they represent key highs and lows, and before taking out those liquidity levels, the HL and LH points should be cleared.
Representation of Pivot Point Formation:
Liquidity wicks are a minor representation of a stop-loss hunt during the retracement of a pivot point. This means that a pivot point is broken only by the wick and not by the entire body.
Bigger wick = more liquidity
Lower wick = less liquidity
Liquidity wicks can be used as trade confirmation or targets for your entry to enhance accuracy.
Users have the option to display candle coloring based on the currently detected trend.
🔶 VERIFICATION
Users have the option to specify the verification length for when the liquidity should occur. This means that if the length is set to 7, the indicator will search for the liquidity formation within the last 7 candles; otherwise, it will be considered invalid.
🔶 CONCEPTS
The whole idea is to help find possible zone of stop loss hunting helping having a better entry in our trading, we can utilize a lot more tools, and this shoud be used as confluence only
🔶 OPTIONS
Users have complete control over the settings, allowing them to:
- Disable pivot points.
- Disable the display of boxes.
- Disable liquidity wicks.
- Customize colors to their preferences.
- Adjust lookback settings for historical data analysis.
- Modify candle coloring settings.
- Adjust the text size of labels for better readability and customization.
🔶 RECAP
Box => Represents liquidity formation / stop-loss hunt
- Minor Box HH / LL point
- Major Box LH / HL point
Liquidity Wicks => Formed when a pivot point is broken only by the wick
BOS / CHoCH => Calculated using the pivot points from the @LonesomeTheBlue script
🔶 RELATED SCRIPTS
Price Action Concepts =>
