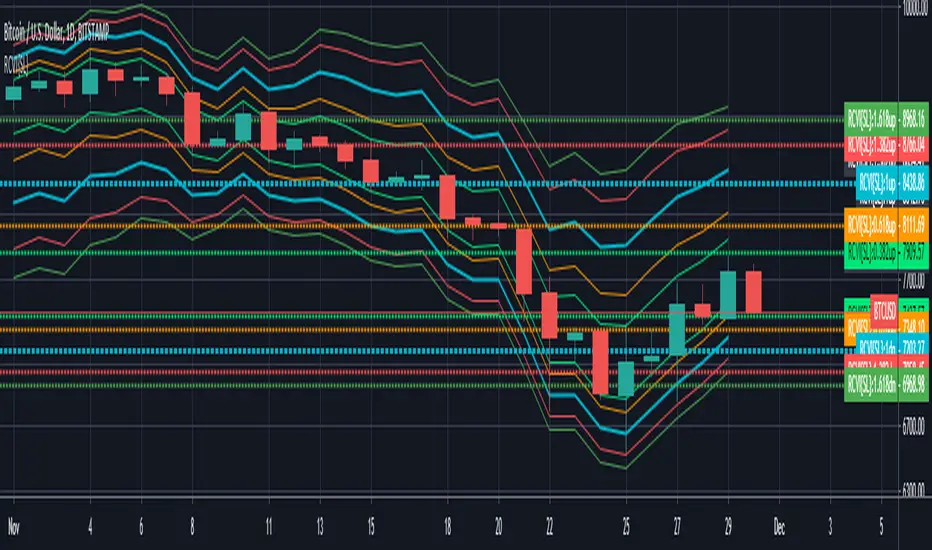
Volatility {RCVI} Stop-Limit SelectorA Stop-Limit Selector powered by the Relative Candle Volatility & Directionality Index (RCVI and RCDI) to help suggest the latest suitable Stop-Limit prices @ multiple levels of risk-control "tightness" depending on what is desired.
Stop-Limit Levels can be Enabled/Disabled in the settings.
Note: In no way is this intended as a financial/investment/trading advice. You are responsible for your own investment/trade decisions.
Please PM me for access information.
Stoploss
Market Adaptive Stop-LossI realized that the zone changes in the stoploss remained slow, so I couldn't make enough use of the characteristics of technical indicators when opening positions.
This pushed me to keep stop-loss under the influence of a dependent variable.
This script helped me a lot (everget) :
I've redesigned the stop-loss to be affected by intersections.
Therefore, this script is also suitable for adaptive moving averages, fractional periods.
Script features:
1.You can select calculation methods created by using various technical analysis methods from the scripts' settings:
-Moving Average Convergence Divergence ( Macd )
-Stochastic Oscillator ( Stoch )
-Stochastic Relative Strength Index (StochRSI)
-Stochastic Money Flow Index (StochMFI ) (More info : )
-Know Sure Thing ( KST )
-OBV ( On Balance Volume )
-SMA ( Simple Moving Average )
-EMA ( Exponential Moving Average )
-FISHERTRANSFORM ( Fisher Transform )
-AWESOMEOSCILLATOR( Awesome Oscillator )
-PSAR ( Parabolic Stop and Reverse - Parabolic SAR )
-HULLMA( Hull Moving Average )
-VWMA ( Volume Weighted Moving Average )
-RMA (Moving Average using in Relative Strength Index calculations.)
-COG (Center of Gravity )
-ACC-DIST ( Accumulation / Distribution Index )
2 - The region is determined according to the above calculation methods and if it is larger or smaller than the previous stop loss level.
And if the price in the negative zone is lower than the stoploss, it is the exact signal and is shown with more highlighted colors.
And, in the positive zone, where the price is greater than the stoploss, the trade zones are certain.
Shown with more highlighted colors.
If the zones are correct but stop-loss is not suitable for opening positions:
In other words, if the stop-loss is above/under the highest-lowest levels in the positive zone or if the stop loss is located in the lower zone in the negative zone, these zones are shown to be darker and dimmed so that they do not cause false movements.
*** SUMMARY : As a result, you can use this script with support and resistances,and trend lines to get good results.
I hope it helps in your analyzes. Best regards.

Experimental Entry Interface (Buy Arrows with TP & SL)This script provides high probability entry points and includes Take Profit and Stop Loss targets.
It attempts to predict when the market conditions are set to move up, and prints long positions.
In addition to Long Entry Arrows, it will print Take Profit / Stop Loss targets.
This indicator is highly adjustable. Hence the name 'Experimental' in the title. Experiment with it to find the results you want.
Designed for use on the 1H timeframe in Forex, but could possibly be useful elsewhere. Do your own testing.
This indicator can repaint. It is best used with alerts set for once per bar close, so that your alerts do not repaint and your trades are solid.
Not ever signal is a winner. Backtest thoroughly. Adjust accordingly.
Arrows
Four sets of colored arrows are included.
💵 💶 Green and Blue Entry Arrows are formed when the market is in an uptrend, and has a momentary pullback.
💴 💷 Yellow and Purple Entry Arrows are formed when the market is just starting to recover from being severely oversold.
Backtest Mode
Turn on Backtest Mode to easily see if an entry ended up as a winner or loser. A Take Profit and Stop Loss line will be drawn to show results.
Take Profit & Stop Loss Targets
You have two options for this.
Price will show you where your TP/SL exits should be placed. These values will show up under the arrow, based on your Risk/Reward ratio.
Pips are much more simple, and will only show you the market entry point and how many pips up/down to place your SL/TP. Warning: This is fixed at a 1:1 RRR .
Risk/Reward Adjustment
Each entry arrow color allows custom risk/reward ratio adjustment.
Dollar Amounts Displayed
Change your account value and leverage to see how much you would have won on each trade.
How to trade with it?
(Forex, 1H) Open the settings, and turn on all the arrow entries. Turn on Backtest mode to see how past trades would have played out. Turn on TakeProfit/StopLoss Targets to see where to set your targets, for each arrow. Set an alert to notify you once per candle close when there is an Entry. Trade happy!
Bill Williams Alligators are also included, if you want. Not necessary though. Some of the calculations depend on them for trend direction analysis.

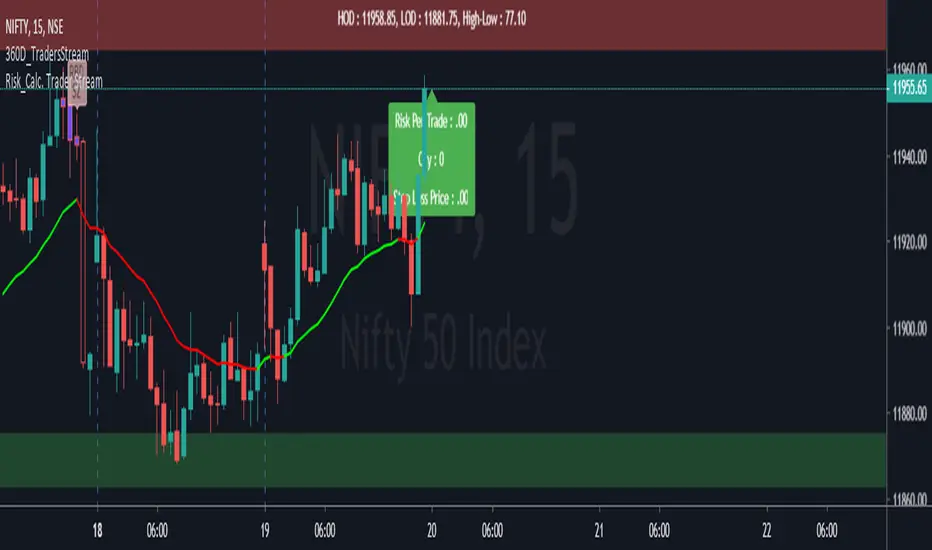
Risk Calculator_Traders StreamHello Guys here we introducing another important tool, in that you can calculate how much Risk you want to take for that trade and what is the wiggle room for Stop Loss from your Distal line. Not only that now you can get how much qty you have to buy as per risk calculation. Please comment below for any information.......
Scripting Tutorial A - TManyMA - StopsThis script is for a triple moving average strategy where the user can select from different types of moving averages, price sources, lookback periods and resolutions.
Features:
- 3 Moving Averages with variable MA types, periods, price sources, resolutions and the ability to disable each individually.
- Crossovers are plotted on the chart with detailed information regarding the crossover (Ex: 50 SMA crossed over 200 SMA )
- Forecasting available for all three MAs. MA values are forecasted 5 values out and plotted as if a continuation to the MA.
- Forecast bias also applies to all forecasting. Bias means we can forecast based on an anticipated bullish, bearish or neutral direction in the market.
- To understand bias, please read the source code, or if you can't read the code just send me a message on here or Twitter. Twitter should be linked to my profile.
- Ribbons added and on by default. Optional setting to disable the ribbons. 5 ribbons between MA1 and MA2 and another 5 between MA2 and MA3.
- Ribbons are alpha-color coded based on their relation to their default MAs.
- Ribbons are only visible between MAs if the MAs being compared share the same Type, Resolution, and Source because there is no way to consolidate those three in a simple manner.
- Ribbon values are calculated based on calculated MA Periods between the MAs.
- Converted the existing study into a strategy.
- Strategy only enters long positions with a market order when MA crossovers occur.
- Strategy exits positions when crossunders occur.
- Trades 100% of the equity with one order/position by default.
- Ability to disable trading certain crosses with input checks.
- Ability to exit trades with a take profit or stop loss.
- User input to allow quick changes to the take profit or stop loss percentages.
This script is meant as an educational script with well-formatted styling, and references for specific functions.
*** PLEASE NOTE - THIS STRATEGY IS MEANT FOR LEARNING PURPOSES. DEPENDING ON IT'S CONFIGURATION IT MAY OR MAY NOT BE USEFUL FOR ACTUAL TRADING. THE STRATEGY IS NOT FINANCIAL ADVICE ***

Ori Double-sided MOST MTFInspired by Anıl ÖZEKŞİ's Moving Stop Loss. This script using similar double sided trailing stoploss logic but i think MOST is not a truly double-sided since you can only select one value for percentage and it uses this value for calculating both sides. In this Double-sided MOST you can set each percentage seperately for uptrends and downtrends.
Toggle for Multi Time Frame
Hide/Show EMA
Toggle for candle colors
Toggle for filling between lines
Toggle for source
Can be applied to other indicators

Average True Range Multiplied (Volatility Stop)Plots crosses above and below the current price giving you the ability to quickly set your stop loss (or the 1st profit target) depending on a custom variable by which the average true range is multiplied with the option to specify the length as well as the type of the moving average (RMA, SMA, EMA or WMA) that are taking into account.
Optionally, you can disable showing of the crosses on the chart and just let the indicator display the calculated value by itself.

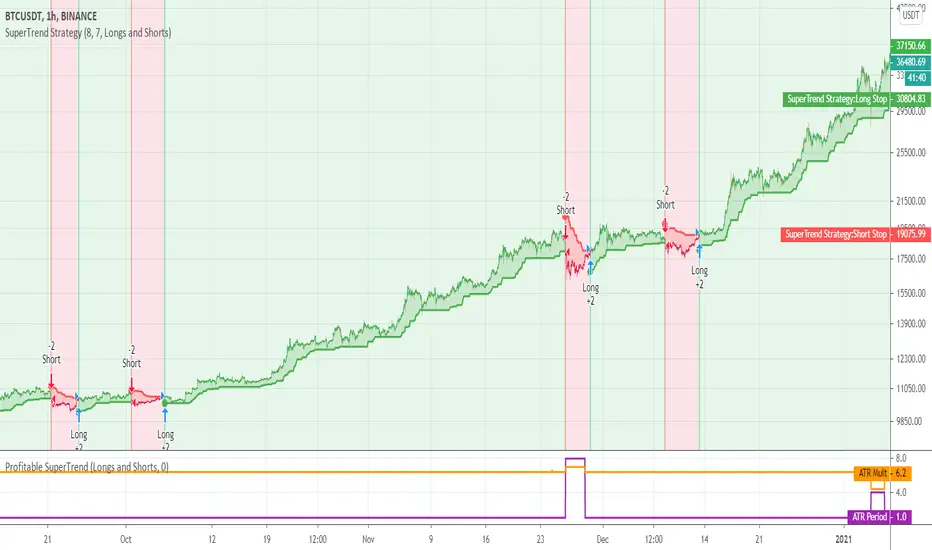
[STRATEGY] SuperTrendA private strategy from the Profitable SuperTrend preview for backtesting purposes.
Trade Manager/Pnl and Risk-Reward Panel (Plug&Play)Hello traders
The Trade Manager Standalone is finally back and with many more built-in features.
I. 💎 SCRIPTS ACCESS AND TRIALS 💎
1. No TRIAL is available for that script. Available only with one-time payment on my website .
2. My website URL is in this script signature at the very bottom (you'll have to scroll down a bit and going past the long description) and in my profile status available here : Daveatt
Due to the new scripts publishing house rules, I won't mention the URL here directly. As I value my partnership with TradingView very much, I prefer showing you the way for finding them :)
3. Many video tutorials explaining clearly how all our indicators work are available on your website > guides section.
4. You may also contact me directly for more information
II. 🔎 What is a Trade Manager?🔎
2.1 Concept
Standalone Trade Manager compatible with any indicator.
Once connected, whenever you'll update your Algorithm Builders or your indicator, the Trade Manager Stop-loss, take-profit levels, and analytics get updated automatically. #bold #statement #but #actually #true
2.2 How hard is it to update your indicator?
We'll send to our customers, a comprehensive and easy tutorial, to make any indicator compatible.
I guarantee you, it should take no more than 2 minutes per indicator. We made it easy, fun, and awesome. #bolder #statement
III. The amazing benefits of our🔌&🕹️ (Plug&Play) system
Hope you're ready to be impressed. Because, what I'm about to introduce, is my best-seller feature - and available across many of my indicators.
In TradingView, there is a feature called "Indicator on Indicator" meaning you can use an external indicator as a data source for another indicator.
I'm using that feature to connect any external indicator to our Trade Manager (Plug & Play) - hence the plug and play name. Please don't make it a plug and pray :) it's supposed to help you out, not to stress you even more
Let's assume you want to connect your RSI divergence to your Trade Manager.
I mentioned an RSI divergence but you may connect any oscillator (MACD, On balance volume, stochastic RSI, True Strenght index, and many more..) or non-oscillator (divergence, trendline break, higher highs/lower lows, candlesticks pattern, price action, harmonic patterns, ...) indicators.
THE SKY IS (or more likely your imagination) is the limit :)
Fear no more. The Plug&Play technology allows you to connect it and use it the backtest calculations.
This is not magic ✨, neither is sorcery, but certainly is way beyond the most awesome thing I've ever developed on TradingView (even across all brokers I know). #bold #statement #level #9000
TradingView is the best trading platform by far and I'm very grateful to offer my indicators on their website.
To connect your external indicator to ours, we're using a native TradingView feature, which is not available for all users.
It depends on your TradingView subscription plan ( More info here )
If you intend to use our Algorithm Plug&Play indicator, and/or our Backtest Plug&Play suites, then you must upgrade your TradingView account to enjoy those features.
We value our relationship with our customers seriously, and that's why we're warning you that a compatible TradingView account type is required - at least PRO+ or PREMIUM to add more than 1 Plug&Play indicator per account.
We go in-depth on our website why the Plug&Play is an untapped opportunity for many traders out there - URL available on my profile status and signature
IV. 🧰 Features 🧰
4.1 Stop-Loss Management
For what's following, let's assume that 2 is the stop-loss value you inserted in the indicator, and the Algorithm Builder gives a BUY signal.
This is NOT a recommendation at all, only an example to explain how this feature works.
- %Trailing: The Stop-Loss starts 2% away from the entry price - and will move up (because we're on a BUY trade as per our example) every time your trade will gain 2% profit
- Percentage: The Stop-Loss stays static 2% away from the entry price. There is no trailing here
- TP Trailing: This is a very awesome feature. The stop-loss is set 2% away when the trades start.
When the TP1 is hit, the stop-loss will be moved to the Entry price (also called breakeven).
When the TP2 is hit, the SL is moved to the previous TP1 position
- Fixed: Set the Stop-Loss at a fixed position (value should be in currency/units)
4.2 Take Profits Management
You can manage up to 2 take profit levels defined as a percentage or price value.
The expected input is in percentage value (for instance, setting the % target of TP1 to 2% will set the TP1 level 2% away from the entry price
4.3 Built-in Trade Manager
This is very likely the most loved utility script that we shared on TradingView.
It's included in your Algorithm Builder - Single Trend+, and will certainly help you immensely to analyze your charts and your trades.
We made sure that all the graphical elements on the chart will be updated in real-time whenever our user change anything on the indicator configuration.
You'll also be able to change the Trade Manager labels positions as you wish :)
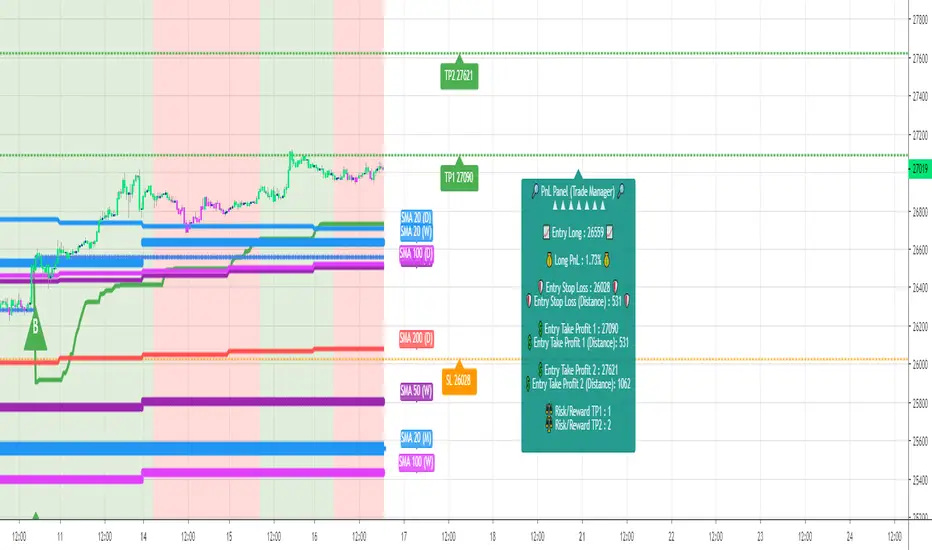
4.4 Built-in Risk-to-Reward Panel
The good stuff doesn't stop here.
You'll notice that this sometimes green (when in a LONG), sometimes red (when in a SHORT) panel at the right of your chart.
It displays for the selected trading algorithmic (see 2.3.2 above), a ton of useful real-time analytics.
- Entry Price: the price when the Algorithm Builder will give a signal.
- The Trade PnL in percentage.
- Entry Stop Loss: Distance (in currency/units) between the selected stop-loss algorithm (percent, trailing, TP trailing, etc.) and the entry price.
- Entry TP1: Distance (in currency/units) between the entry price and the first take profit
- Entry TP2: Distance (in currency/units) between the entry price and the second take profit
- Risk/Reward TP1: Using the Stop-loss distance at entry, and Take Profit 1 at entry to compute the risk-to-reward ratio.
- Risk/Reward TP2: Using the Stop-loss distance at entry, and Take Profit 2 at entry to compute the risk-to-reward ratio.
For more details, please check the guides section of my website. Links are in my signature and profile status.
4.5 Built-in PnL real-time calculations
YES!!!! you read it correctly
The panel displays the risk-to-reward ratios but also the PnL (Profit and Loss in percentage value) of the current and last trade
V. 🔔 Alerts 🔔
We enabled the alerts on the:
1. Stop-Loss
2. Take Profit 1
3. Take Profit 2
VI. 🤖 Compatible with trading bots? 🤖
I'm very aware of all existing solutions out there allowing us to capture the TradingView alerts (Instabot, ProfitView, ...) and forwarding them to the brokers to automatize your trading.
You'll find a more detailed answer on our website.
If you have any doubt or question, please hit me up directly or ask in the comments section of this script.
I'll never claim I have the best trading methodology or the best indicators.
You only will judge and I'll appreciate all the questions and feedback you're sending my way.
They help me a ton to develop indicators based on all the requests I received.
Kind regards,
Dave

Algorithm Builder - Single Trend+Hello traders
I. SCRIPTS ACCESS AND TRIALS
1. For the trial request access, they have to be done through my website .
2. My website URL is in this script signature at the very bottom (you'll have to scroll down a bit and going past the long description) and in my profile status available here : Daveatt
Due to the new scripts publishing house rules, I won't mention the URL here directly. As I value my partnership with TradingView very much, I prefer showing you the way for finding them :)
3. You may also contact me directly for more information
II. Algorithm Builder - Single Trend+
2.1 Concept
That script is an upgrade of the Single Trend:
The Algorithm Builder - Single Trend+ was made to detect the convergence (also called confluence) of many unrelated indicators, giving a BUY or SELL signal whenever all the selected sub-indicators are converging in the same direction.
The Single Trend gives one single entry per identified trend - unlike the Multiple Trends editions (also available on my scripts page) which may give more than 1 entry per trend.
The traders select the sub-indicators they want, and see in real-time the BUY and SELL triangles being updated.
2.2 Why the Algorithm Builder Single Trend may help you
I worked with many traders during my career, and their feedback about trading is often pretty similar.
They all tried a lot of complicated indicators, losing their capital, and finally getting back to the basics (even to the basic indicators if I might say)
The art is finding a good combination of indicators and setting strict money/risk management rules.
Easy in concept, but more than 90+% of traders lose money on the markets... which teach us that trading is not only about drawing trendlines, or using cool indicators but finding ways to ease our psychology while trading.
2.3 The Algorithm Builder trading framework
The sub-indicators (full list on our website) weren't chosen randomly. They're based on a trading method we've developed over the last 6 years - while working with traders and other trading quants.
The Algo Builders are made to detect a convergence - and as such, will give a signal once a trend has been identified.
They're not made to detect reversal but have been designed to give a signal when all sub-indicators are either ALL bullish (green) or ALL bearish (red).
We provide a framework based on indicators we selected because they:
1. make sense to be used altogether
2. work on asset classes like INDEX, CRYPTO, STOCK OPTIONS, FOREX, COMMODITIES
3. it may expand your knowledge about what detecting a convergence with pre-selected indicator really means
2.3.1 Supports and Resistances
The indicator displays the main algorithmic supports and resistances according to our trading method.
I think they're relevant for all asset classes, but you're absolutely free to use any different supports/resistances logic if you want to.
I'm not against it because I know that pivots, Fibonacci levels, etc. may work very well also.
2.3.2 Choose your favorite risk management algorithm
1/ Pre-defined Algo S/R method using:
- a supertrend of the stop-loss
- the nearest algorithmic resistances for the take profit levels.
2/ Define your own Stop-loss and Take-profits level in real-time
Stop-Loss Management
For what's following, let's assume that 2 is the stop-loss value you inserted in the indicator, and the Algorithm Builder gives a BUY signal.
This is NOT a recommendation at all, only an example to explain how this feature works.
- %Trailing: The Stop-Loss starts 2% away from the entry price - and will move up (because we're on a BUY trade as per our example) every time your trade will gain 2% profit
- Percentage: The Stop-Loss stays static 2% away from the entry price. There is no trailing here
- TP Trailing: This is a very awesome feature. The stop-loss is set 2% away when the trades start.
When the TP1 is hit, the stop-loss will be moved to the Entry price (also called breakeven).
When the TP2 is hit, the SL is moved to the previous TP1 position
- Fixed: Set the Stop-Loss at a fixed position (value should be in currency/units)
Take Profits Management
You can manage up to 2 take profit levels defined as a percentage or price value.
The expected input is in percentage value (for instance, setting the % target of TP1 to 2% will set the TP1 level 2% away from the entry price
2.3.3 Built-in Trade Manager
This is very likely the most loved utility script that we shared on TradingView.
It's included in your Algorithm Builder - Single Trend+, and will certainly help you immensely to analyze your charts and your trades.
We made sure that all the graphical elements on the chart will be updated in real-time whenever our user change anything on the indicator configuration.
You'll also be able to change the Trade Manager labels positions as you wish :)
2.3.5 Built-in Risk-to-Reward Panel
The good stuff doesn't stop here.
You'll notice that this sometimes green (when in a LONG), sometimes red (when in a SHORT) panel at the right of your chart.
It displays for the selected trading algorithmic (see 2.3.2 above), a ton of useful real-time analytics.
- Entry Price: the price when the Algorithm Builder will give a signal.
- The Trade PnL in percentage.
- Entry Stop Loss: Distance (in currency/units) between the selected stop-loss algorithm (percent, trailing, TP trailing, etc.) and the entry price.
- Entry TP1: Distance (in currency/units) between the entry price and the first take profit
- Entry TP2: Distance (in currency/units) between the entry price and the second take profit
- Risk/Reward TP1: Using the Stop-loss distance at entry, and Take Profit 1 at entry to compute the risk-to-reward ratio.
- Risk/Reward TP2: Using the Stop-loss distance at entry, and Take Profit 2 at entry to compute the risk-to-reward ratio.
For more details, please check the guides section of my website. Links are in my signature and profile status.
2.3.6 Hard Exits
Our trading method is known for the hard exits, also called invalidation.
The Single Trend+ includes a hard exit based on a MACD - settings are flexible and you may update them.
Having a stop-loss protecting your trade is a best practice - Protecting your stop-loss also from getting hit is incredible.
We prefer invalidate a few positions, even if sometimes we don't want to. Rather than the market hard exiting on us, and leaving with our hard-working money.
2.3.7 Alerts
Alerts are enabled for:
- BUY/SELL triangles signals
- Trade Manager (SL, TP1, TP2)
- Hard Exits
III. Pain points that we're trying to solve with our Algorithm Builders
Issue #1 There are many informations / indicators / strategies / backtests / noise. Finding the right ones is not a simple task.
Solution #1 A reliable system that removes the external noise is much needed in trading to stay "in the game".
Issue #2 Trading could be quite stressful - The majority doesn't lose in trading because technical analysis is hard, but because managing our psychology is one of the hardest things a human can do.
Solution #2 Some ways to reduce the "trading stress" could be: getting better quality signals and trading like a "machine". Forgetting about Twitter and trusting the system you designed.
Issue #3 Trading without strict rules and only based on what we feel, or what we think the market should do is the fastest way to kiss our money goodbye.
Only 1 indicator generally is not enough. Traders generally use a combination of several indicators but they're monitoring them individually.
It's normal then to feel exhausted at the end of the day ^^ (to say the least)... and exhaustion leads to mistakes which leads to..... (I'm sure you got it) ... capital loss.
Solution #3 As a trader, I needed a trading framework and a method. I offer our trading method but they're plenty others out there. We cannot claim obviously it's the best ever ....but let's say we're using those exact same
scripts ourselves for our trading. And this what we've been recommending our clients to trade with for the past years. Also, having a tool detecting the convergence of several indicators and giving 1 unique signal
for BUY/SELL position will save you a lot of time/energy, and perhaps might help you out getting better trading performance.
IV. Resolving a complex puzzle and having fun in the process
Trading has to stay a passion and not (only be) a source of intense stress.
The most successful traders I know are "trading geeks" - literally always looking for optimizing, searching for the best possible entries, setups, indicators, tools, etc.
For them, it's not even about the money anymore, but only about beating their previous performance.
Why are they doing this? Because it's fun
Might appears as a bold statement, but I guarantee that looking for setups is fun.
One of our users even told us, that it's like playing with "Legos" and we couldn't possibly agree more.
V. Designing a system that "makes sense"
Another bold statement now. Brace yourselves ladies and gentlemen
The Algorithm Builders allow to design trading systems quickly. What could takes days/weeks/months to find out... might be now within your reach in less than a few hours.
With a bit of practice, less than an hour might be enough per asset/timeframe to find a system that makes sense to you and adapted to your trading capital and psychology.
Assuming our users read our guides and are fully committed to learning a new way of trading - then we do guarantee you'll be able to design kick-ass trading systems that make sense.
"Making sense" doesn't mean at all it's guaranteed to win, it means you're the one defining the convergence of indicators, using your Algorithm Builder, and observe that most of the time - whenever there is a BUY signal, the candlesticks are going upwards - whenever there is a SELL signal, it's going downwards.
This is a necessary step to make real progress from a trading analyst perspective - and hopefully could lead to profits.
VI. Algorithm Builder versus the main trader enemy(=psychology)
This indicator has the goal to help solving one of the MAIN issues encountered by traders.
Most of traders realize, they can't perform with only 1 indicator (or 1 price pattern or 1 price action) and need a combination of multiple indicators before getting in a trade.
Far from being a magic pill, if it could at least reduce the stress you have while trading, then we'll consider we made a great job - it's a technical "useless noise remover", and needs to be followed strictly.
Such trust in a trading system can only be built by testing your Algorithm Builder configuration on either:
1. a demo account
2. or a live account with small bids. And then, increasing progressively the bids if your capital increases progressively.
Though, you should still use your common sense. (for instance: if we get a BUY signal right on a big timeframe resistance we're hitting for the first time).
I'm aware this is a new way of trading but for many, and while we cannot foresee the future, neither predict performance, we believe it might save you a lot of time to find good signals.
My maximum level of happiness will be reached the day when our users will contact me and showing me setups being mine.
I'm sure that even I can learn from my users and, we can all learn from each other Algorithm Builder configuration
VII. What is a wrong or bad configuration?
Simply put. If you see that most of your signals react such as described below:
1. a buy triangle predicts, most of the time an upwards move
2. a sell triangle predicts, most of the time a downwards move
3. you estimated yourself the stop-loss needed to give enough room for your trades.
4. take profits based on algorithmic support and resistances or your own take profit method.
So what's a good Algorithm Builder configuration? A configuration you're happy with and makes sense.
A better Algorithm Builder setup is one used in demo or a live account w/ small bids for a few weeks, and you're consistent in your trading performance.
If you have any doubt or question, please hit me up directly or ask in the comments section of this script.
I'll never claim I have the best trading methodology or the best indicators. You only will be the judge, and I'll appreciate all the questions and feedback you're sending my way.
They help me a ton to develop indicators based on all the requests I received.
Kind regards,
Dave
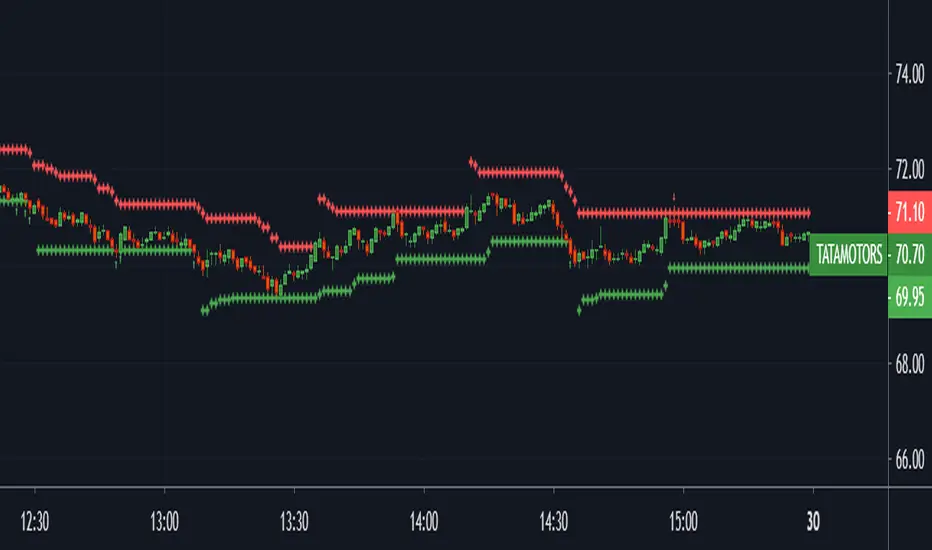
Trend ProTrend Pro
- Trend Indicator for Long and Short entries
- It can be used as a trend indicator or as a trailing stop loss
- Long and Short Labels and Alerts
- Configurable in volatility values and periods

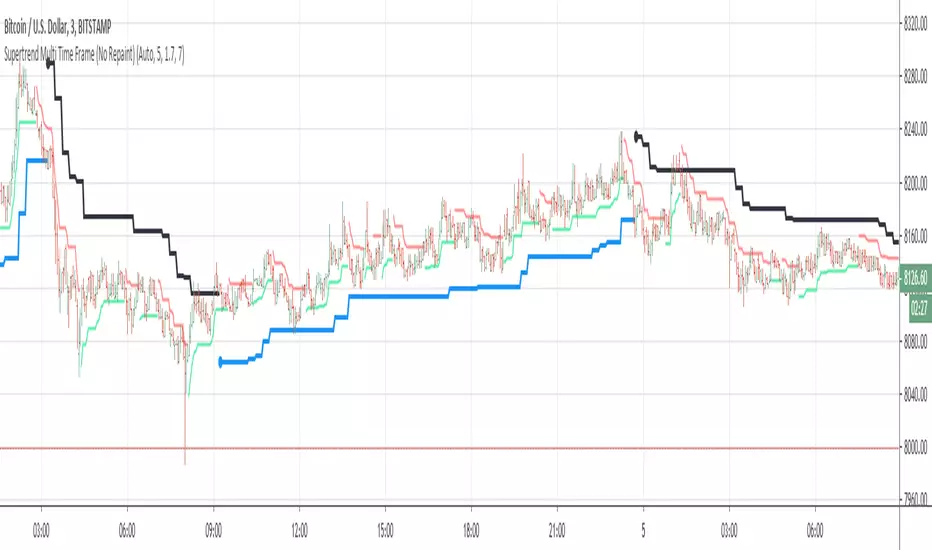
Supertrend Multi Time Frame (No Repaint)This is non repaiting Supertrend Multi Time Frame script.
There is an option for Higher Tİme Frame Period. if you choose "Auto" then Higher Time Frame calculation would be made by script. Or you can choose "User Defined" and then you must choose the period for Higher Time Frame.
You better use this script with some indicators, RSI , Momentum etc.
_ LonesomeTheBlue _
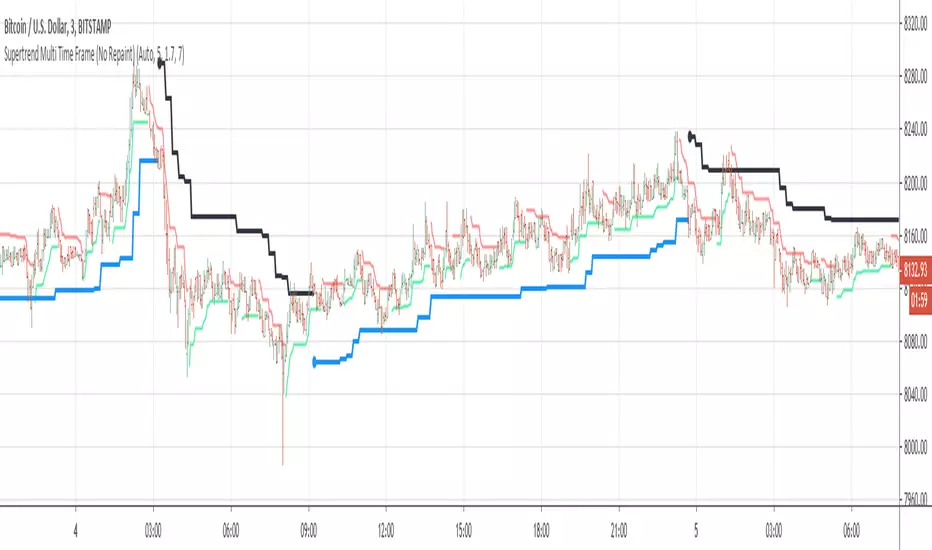
Supertrend Multi Time Frame (No Repaint)This is non repaiting Supertrend Multi Time Frame script.
There is an option for Higher Tİme Frame Period. if you choose "Auto" then Higher Time Frame calculation made by script. Or you can choose "User Defined" and then you must choose the period for Higher Time Frame.
You better use this script with some indicators, RSI, Momentum etc.
If you find my works useful, please consider a donation
BTC: 19qDW9AShZhBZsGuXcgRzam5Fbpc3EU8EV
ETH: 0x39c8552371b9b7f4e324197af460ba8bc8e18ef9
Breakout Notifier LONG NEW with wicksBreakout script with few changes that considers wick to close trades instead of using candle body like in the previous version

Trailing Sl Both Side How To Work? (long Side Stoploss)
This Indicator Calculate Every New Candle Open Price
For Example, Candle Open Price 50 And You Set 1 Point Stoploss Then Your Stoploss Automatically Add
49 Then Next Candle Open Price 52 Your Stoploss Automatically Trail 51 Then Next Candle Price 51.5 But
Your Stoploss 51 Fix Because Price Down But Stop Loss Not Down Without Trigger
Alerts Condition
Long Side Stoploss
1 Click Alerts and By Default Select Symbol
2 Crossing
3 Select indicator
4 select first plot
Short Side Stoploss
1 Click Alerts and By Default Select Symbol
2 Crossing
3 Select indicator
4 select second plot
Trailing SL or TP with Alerts (MV)Hey
Trailing SL or TP with Alerts (MV)
if you want trailing Stoploss Alerts
Alert condition
select by default Symbol
Less Than
Select Trailing SL or TP with Alerts (MV)
Second Plot
if you want trailing Takeprofit Alerts
Alert condition
Select by default Symbol
Greater Than
Select Trailing SL or TP with Alerts (MV)
First plot

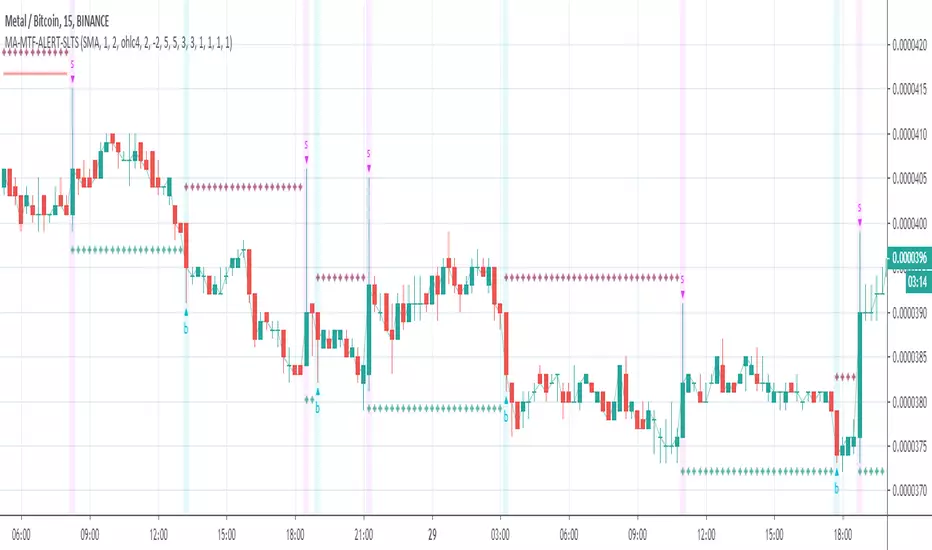
MA-MTF-ALERT-SLTS=== This is an updated version of the MA-MTF Alerts===
+ Take profit
+ Stop Loss
+ Traling Stop
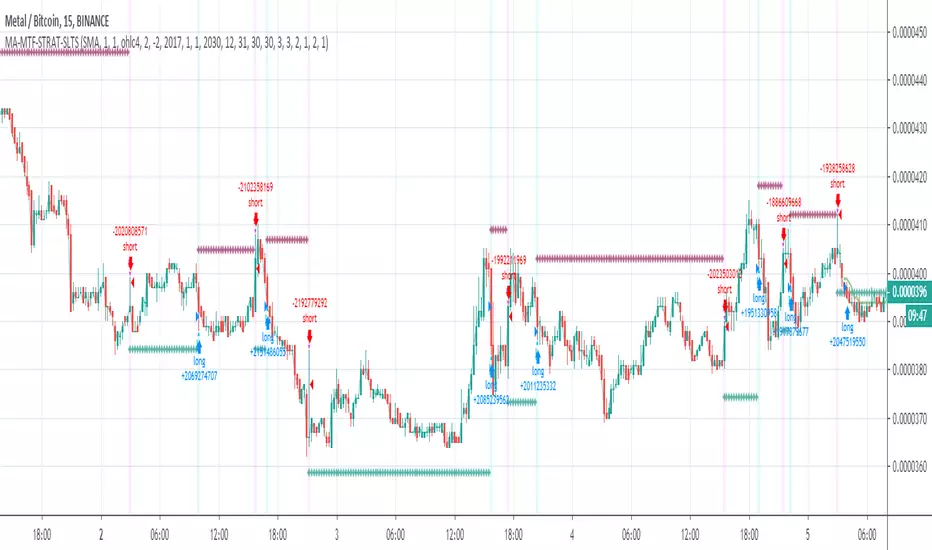
MA-MTF-STRAT-SLTS=== This is an updated version of the MA-MTF strategy ===
+ Take profit
+ Stop Loss
+ Traling Stop
Long Short Double strategyLong Short Double strategy
Long short strategy with stoploss and take profit.
I use this script for 5min btcusd on Bitmex. (The strategy also works on other exchanges, with some small adjustments in RSI)
Leverage 10x 375% profit in 2 weeks. NO REPAINT.
U can Adjust the RSI for long and shorts entry`s.
Study is Autoview ready. send me a PM for Paid access.
If you like this strategy buy me a Pizza, Dinner, or lambo:)
BITCOIN: 3BMEXTEMinsUUqUwr9GEjNA6ZBsVXB1g6u
LITECOIN: LdG82pyEMMji9Bynw3hvWgUshbMKfiFdJw

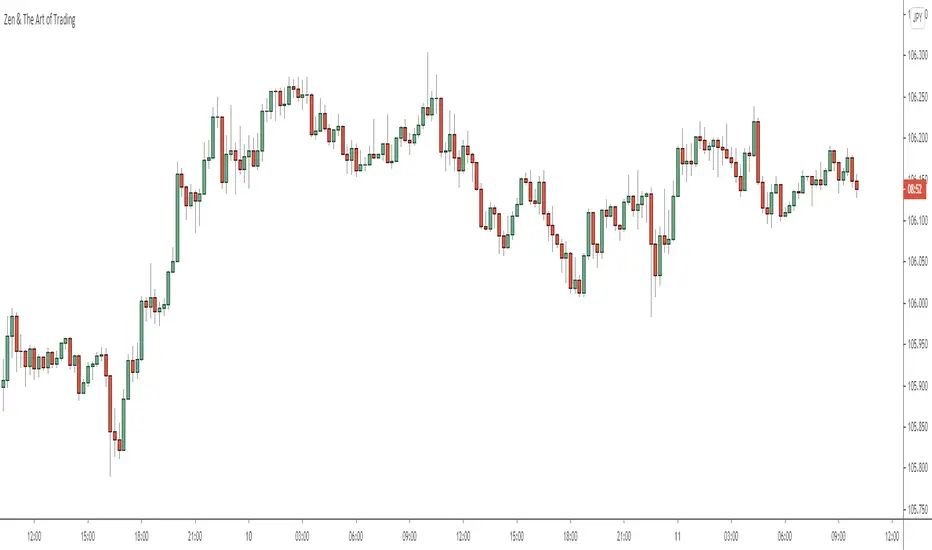
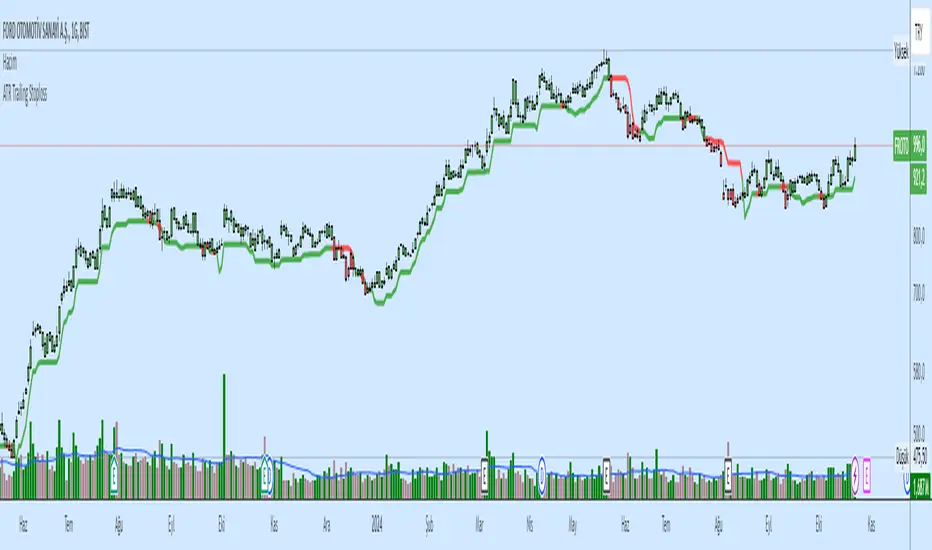
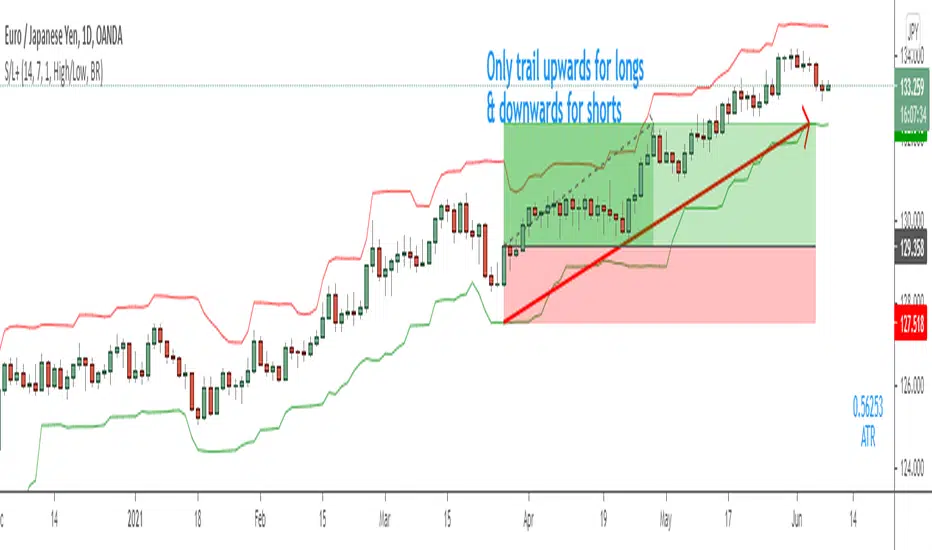
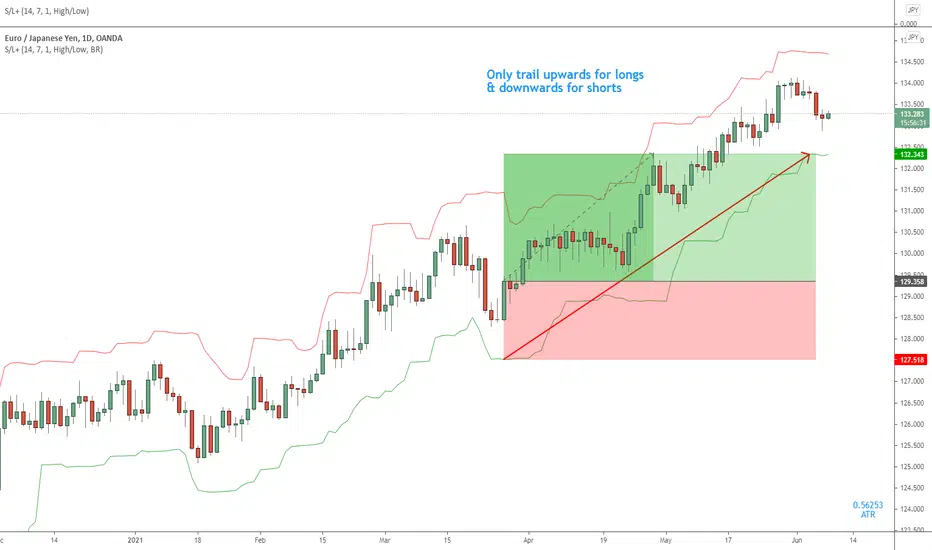
ATR Trailing Stop Indicator [Chart]I rely on this script for both my live trading and my backtesting process. I couldn’t live without it. It’s extremely simple – all it does is calculate your trailing stop price.
How It Works
The first number in blue is the current ATR (pips). The second number in green is your trailing stop loss price for Long trades, and the third number in red is your trailing stop loss price for Short trades.
For short trades, the stop loss price is calculated by adding the current ATR value to the highest-high of the given lookback period.
For long trades, the stop loss price is calculated by subtracting the current ATR value from the lowest-low of the given lookback period.
Settings
ATR Length:
ATR period (how many candles to include in the calculation).
Use Structure?
If set to true, the script will use swing lows and highs in its calculation. If set to false, the script will ignore swing lows and highs and give you the distance of the ATR from the current candle close instead.
How Far To Look Back For High/Lows:
Candle lookback period for swing high/lows.
ATR X ?:
This controls your ATR multiplier. For example, if you want to use a 2x ATR stop, set this to 2.
Tool Companion:
Here is the tool companion script for this indicator:
Source Code:
Go to zenandtheartoftrading.com for the source code – it’s free!
ATR Trailing Stop Loss IndicatorI rely on this script for both my live trading and my backtesting process. I couldn’t live without it. It’s extremely simple – all it does is calculate your trailing stop price.
How It Works
The first number in blue is the current ATR (pips). The second number in green is your trailing stop loss price for Long trades, and the third number in red is your trailing stop loss price for Short trades.
For short trades, the stop loss price is calculated by adding the current ATR value to the highest-high of the given lookback period.
For long trades, the stop loss price is calculated by subtracting the current ATR value from the lowest-low of the given lookback period.
Settings
ATR Length:
ATR period (how many candles to include in the calculation).
Use Structure?
If set to true, the script will use swing lows and highs in its calculation. If set to false, the script will ignore swing lows and highs and give you the distance of the ATR from the current candle close instead.
How Far To Look Back For High/Lows:
Candle lookback period for swing high/lows.
ATR X ?:
This controls your ATR multiplier. For example, if you want to use a 2x ATR stop, set this to 2.
Chart Companion:
Here is the chart companion script for this indicator:
Source Code:
Go to zenandtheartoftrading.com for the source code – it’s free!
ATR (Average True Range) By TimeWhat is ATR By Time?
This premium indicator was inspired by my RVOL By Time indicator . It works on Stocks, Forex, Crypto and most Futures markets. Instead of calculating the ATR by recent price data, it calculates an ATR value for each candle based on that candle’s time of day.
For example, if you set the Lookback setting on this indicator to 14, then instead of calculating the ATR based on the past 14 candles, it will calculate an ATR value based on the past 14 trading sessions for each candle.
This is extremely useful for day traders in particular as it allows you to gauge the average range of candles during certain times of day instead of only by the most recent price action.
It also draws a regular ATR (optional) – so this is essentially an enhanced ATR script that gives you multiple readings on price volatility.
If you are interested, you can purchase access to the script or register for a free trial on my website: ATR By Time Feature Page .
Why Does It Cost Money?
The reason why this is a premium script that requires payment to access is because it took a lot of time, research and development in order to create. The other advantage of charging for it is that it retains exclusivity to only a select few dedicated traders.
By paying the yearly fee you get access to ALL of my premium indicators including lifetime updates and technical support.
If you don’t want to pay for this script then I completely understand and I have plenty of other free indicators and scripts that you might be interested in!
Free Trial
I am a trader myself and so I know how skeptical you might be that this indicator is worth your time and money. That is why I am offering a free trial of this indicator.
All you need to do to initiate your trial is Join My Mailing List/ on my website: zenandtheartoftrading.com
How It Works
This script uses a complex formula to calculate ATR values across distant historical bars.
Depending on the timeframe you select it will skip through historical bars to find previous bars from the same time of day. It collects these values then applies the traditional ATR formula to them.
The ATR value is determined by the maximum result of the following three calculations:
- Current high minus the current low
- The absolute value of the current high minus the previous close
- The absolute value of the current low minus the previous close
- Whichever of these three calculations comes out highest, that is your ATR for the given candle.
Once this value is calculated for historical bars the ATR indicator’s reading is typically determined by a 14-period moving average of these individual ATR values. So the ATR reading you see on your screen is an average of the past 14 ATR values.
This means that as markets expand and contract this volatility reading will adapt to the change in candle price ranges.
The difference with the ATR By Time indicator’s calculation formula is that rather than referencing recent bars it references bars based on their time of day.
For example, if you are on the 1-Hour chart and you check the ATR By Time value at 9:00AM with a Lookback period of 14, then the value you see will be the result of the ATR calculation of every 9:00AM 1-Hour candle over the past 14 trading sessions.
You can also choose to enable the ATR moving average in the settings menu if you wish. This will give you a smoothed ATR reading by averaging the current session’s ATR value with previous sessions.
This versatility gives you a sophisticated reading on price volatility which is particularly helpful for day trade setups based around market opens or market closes when volatility tends to spike.
The regular ATR indicator will not account for this on the lower timeframes, but this indicator will!
Examples
Stocks - Heatmap Scheme with regular ATR
Stocks - Price Scheme - No ATR
Stocks - Traffic Scheme - Session Average Line RMA
Stocks - Trigger Scheme - 10 sessions
Forex - RMA
Forex - No RMA
Forex - Normal ATR Stop
Forex - Session ATR Stop