SampleInvitePublish - V1
This strategy is designed for trading stocks and crypto currencies on the long side.
It uses three different timeframes to determine the most profitable entry prices (Day, 4 hour and chart interval).
The strategy employs ten different setups to accommodate both range trading and trend following markets.
The system contains sophisticated algorithms that scale to varies chart intervals.
Tailored to perform best between 4 hours to as low as 10 minutes.
The entire system consists of three tools: HullbusterScope, HullbusterBacktest and HullbusterSignal.
Hullbuster scope is used to obtain configuration information about the market instrument which will be applied to the HullbusterBacktest.
Commit an iterative approach to the backtest tool until the simulated results match your entry and exit expectations .
Apply the HullbusterSignal to the chart and use the same backtest configuration to setup actual trading alerts.
Aktien

Lazy Trend System 2019latest, more powerful and applicable on FX, indices, stocks and cryptocurrencies!

NAVI'S PERFECT TSIThe NAVI'S PERFECT TSI Indicator is the same as the True Strength Index (TSI) developed by
NAVI, except the SMI includes a signal line. The SMI uses double moving averages
of price minus previous price over 2 time frames. The signal line, which is an EMA of the
SMI, is plotted to help trigger trading signals. Adjustable guides are also given to fine
tune these signals. The user may change the input (close), method (EMA), period lengths
and guide values.
You can use in the xPrice any series: Open, High, Low, Close, HL2, HLC3, OHLC4 and ect...

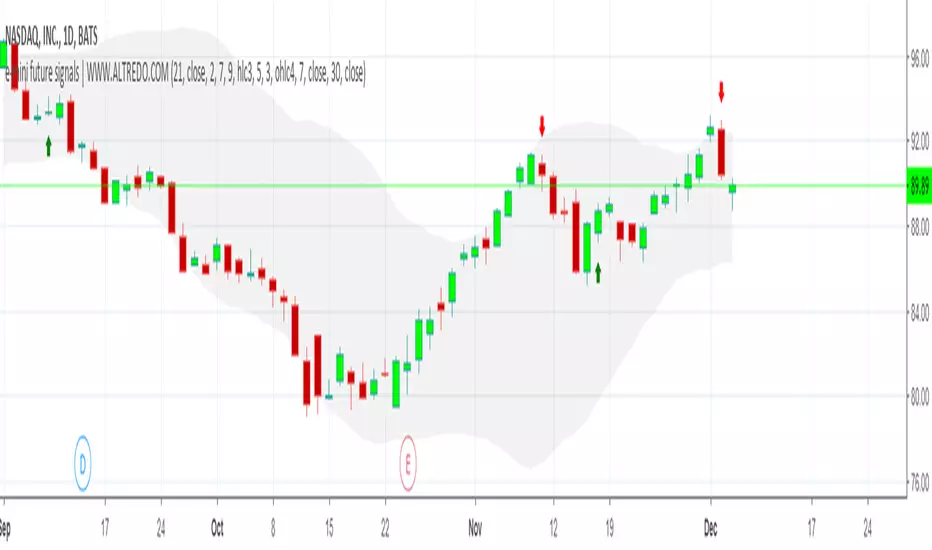
NASDAQ 1D TRADING SIGNALS | DAY TRADING SIGNALSNASDAQ 1D TRADING SIGNALS FOR SHORT-TERM AND MEDIUM-TERM TRADING!
✅ Based on trend analysis, includes Moving Average, Volatility indicators.
✅ This strategy can be used alone or alongside other strategies for better success.
✅ Real-time NASDAQ trading signals
The indicator provides an easy and fast way to determine the trend direction and possible reversals.
Green : Uptrend. Long trading
Red : Downtrend. Short trading
Stock Market Indices Correlations HeatmapHello friends,
I'm excited to share one of my insightful tools. This indicator visualizes how major global stock indices move relative to your selected instrument, helping you instantly spot market-wide strength, weakness, or divergence.
🛠 How It Works
The indicator calculates Pearson correlation coefficients between your selected symbol and 28 major stock indices , including S&P 500, NASDAQ, DAX, NIKKEI, and many more. Each color is selected according to the correlation value:
Green hues show positive correlations (instruments moving together).
Red hues show negative correlations (instruments moving in opposite directions).
Lighter or transparent colors indicate weak or no correlation.
You can customize the correlation lookback period (default 14 bars ), select your preferred data source (close, open, etc.), and choose from multiple professional color palettes to best match your charting style.
🔥 Key Features
Comprehensive Global Coverage — Correlations across 28 major indices from North America, Europe, and Asia.
Multiple Palettes — Choose from 8 professional color palettes (Blue/Red, Spectral, Viridis, etc.) for better visual clarity.
Adjustable Lookback — Set correlation calculation period from 1 to any number of bars.
Dynamic Data Requests — Real-time updates for all tracked indices using TradingView's request.security.
Smart Alerts — Receive alerts when all indices align positively or negatively — a sign of broad market sentiment extremes.
Performance Optimized — Efficient data handling ensures smooth operation even with multiple requests per bar.
Enhanced UI — Streamlined settings panel for fast palette and source adjustments.
Non-Repainting — Uses only historical data, ensuring stable readings.
If you'd like access or have any questions, feel free to reach out to me directly via DM.
👋 Good luck and happy trading!
Bezahltes Script

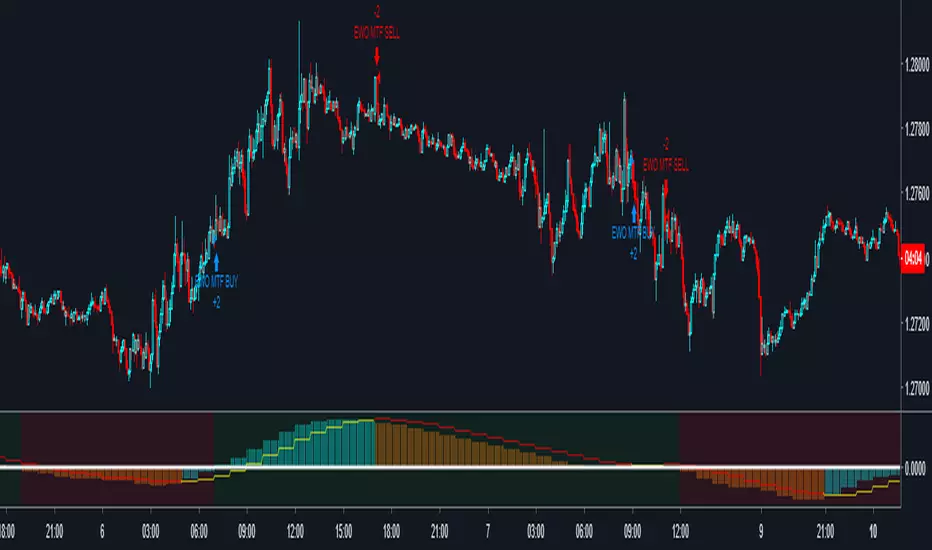
PpSignal EWO LBR MTFEwo mtf strategy.
(tf) superior time frame configuration in input window
Configuration
Forex and crypto :
For time 1 min use tf 30 min
for time 5 min use tf 60 min
for 15, 30 and 60 min use tf 240
Stock:
For time 1 min use tf 30 min
for time 5 min use tf 60 min
for 15 and 30 min tf 240.
For 60 tf D.
For D tf W
For W tf M
UVTrader StratejiIf you see "AL", you can buy.
If you see "SAT", you can sell.
You can use all charts, but 4H and 1D charts are very well.

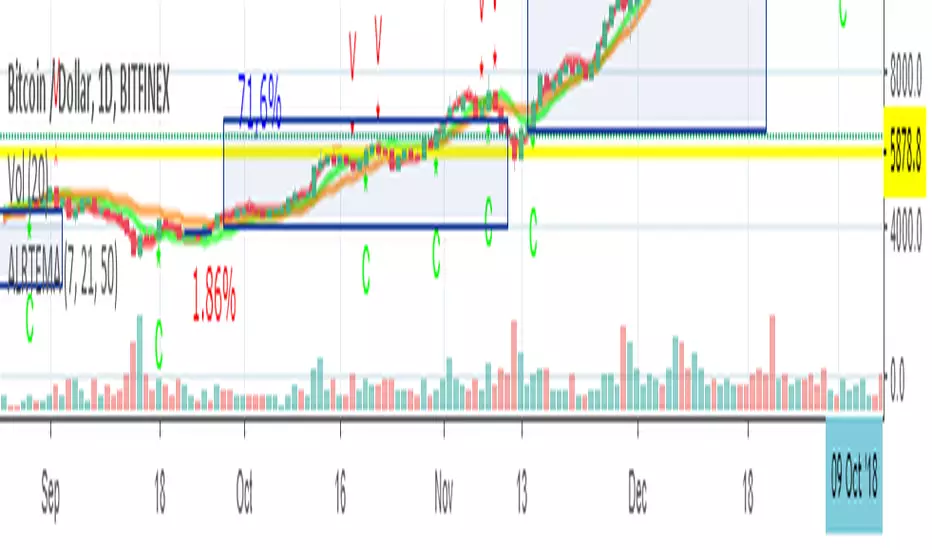
U.S. Stocks & Options CVI to Bitcoin Correlation [NeoButane]Conceptual indicator based on trying to find an inverse correlation between bitcoin and traditional markets due to bitcoin's usefulness as a hedge against economic downturns.
How to use this script: you look at it and see if there is a correlation or not between bitcoin/Ethereum price and either U.S. stock CVi, buy volume, sell volume, calls, puts, or the call/put ratio.

Bollinger Band Oscillator Filtered Long/Short Entries This script calculates entries using Bollinger Bands paired with a series of oscillators. Simply set the Bollinger Band length, as well as the length of the oscillators, and you're good to go. Filtered entries as well as unfiltered entries are plotted by default. Excellent results on longer timeframes (1 hour and higher), although scalping can be done on lower timeframes as well. Filtered entries give safer long/short entries, but plenty of good signals are generated by the unfiltered data as well. Has been tested and found to be effective on several stocks and cryptocurrencies.
Message me to try this script out, thanks!

CLY 4.20 OscillatorWhen the indicator value is above 4.20 the trend is up, below the trend is down. Watch out for ranging markets.

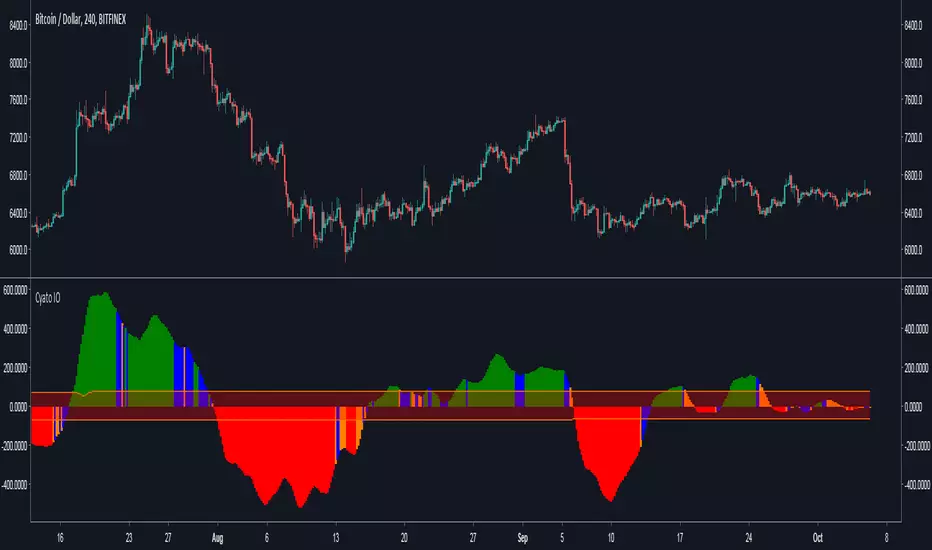
Cyatophilum Ichimoku Oscillator [ALERT SETUP]Hello, I built an oscillator based on Ichimoku trading rules. I wanted something simple to use, but powerful, with automated alerts that would help us trade breakouts and trend reversals.
The indicator can be used on all timeframes and everywhere : Crypto, Forex, Index, Stocks, Futures, CFD.
Basically, green bars equals bull market and red bars equals bear market.
Blue and Orange bars show potential breakouts and you can setup automatic alerts for receiving an email or SMS when it happens.
You can also setup alerts for new highs and new lows indicating a potential trend reversal.
The narrow channel in the middle indicates consolidating periods and unsignificant trades, because we know Ichimoku performs badly in range markets.
For more information on how to use it, I made a description page at the link below.
Sample Use Cases :
BTCUSD 4H
BTCUSD 2H with New Highs/Lows on chart (blue and red circles correspond to alert conditions)
BTCUSD 1H
ETHUSD 2H
Use divergences with price action to trade breakouts.
More information on my website
blockchainfiesta.com
Purchase this indicator today and get access to my other Cyatophilum Indicators that will help you in your trading
blockchainfiesta.com
Happy trading!
QTi65 FORMULAFind low risk entry points with this momentum Indicator formula.
Swing Trading using momentum and breakout idea.

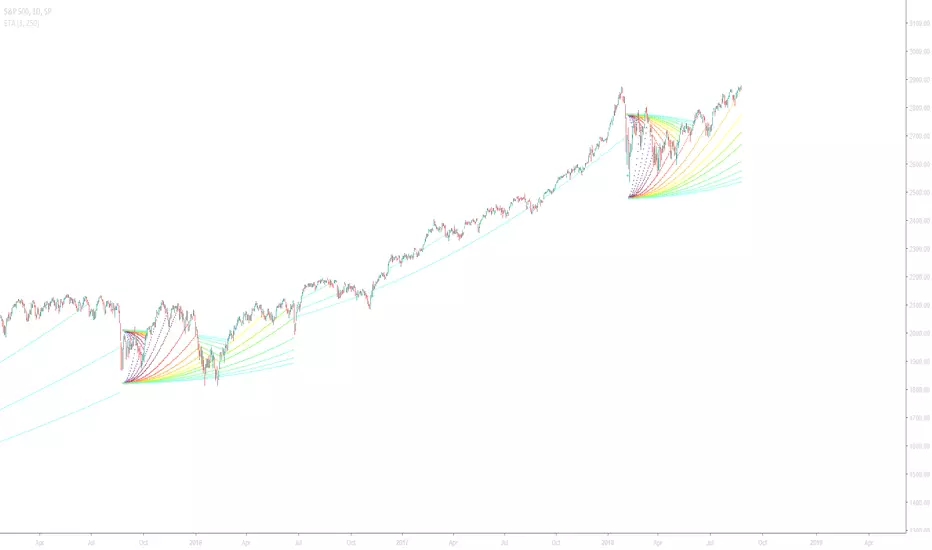
Extreme Trend Amplifier (ETA)Introduction
This indicator was created in V3 Pinescript and all projections will be displayed in real-time for active trading use.
This indicator has been designed so that it can be used across a range of securities such as equities, bonds, FX and cryptocurrencies.
All time-stamps are supported.
Comment and Like to try it out!
Understanding the Extreme Trend Amplifier
Extreme price changes are often result in a change of trend. This indicator not only allows you to identify the breakout, but to follow the direction of the change. Below is an example of the indicator using normal input values and the Dark TradingView Theme.
The Extreme Trend Amplifier is an indicator that measures the rate of change within a bar of the time stamp and plots a function when the user-defined threshold has been breached. The plot projects parabolic lines that squeeze towards the market price at an ever-increasing rate. The acceleration can also be defined in the indicator settings panel.
Indicator Utility
The first example below is the forex pair, AUD/USD using a rate threshold of 1% and an acceleration factor of three and the second using a rate threshold of 0.8% and an acceleration factor of nine.
We can observe that an increased rate threshold results in fewer instances and that a higher acceleration factor results in the instance projecting farther.
Notice that the acceleration factor is inversely related.
Input Values
Select the “ Format ”, button located next to the indicator label to adjust the input values and the style.
Rate of change (ROC) is the percentage rise/fall of the security within the time stamp. If ROC is set to 1, this is directly proportionate to 1%.
Securities such as cryptocurrencies are very volatile and will require an increased threshold.
Forex pairs will require a reduced threshold in order to produce an output as volatility is far less.
The line color, thickness and style can also be personalised to customise the strategy even further.
In this example, I have adjusted the projected instance that appears below the bars blue and above the bars red, indicating an uptrend or downtrend.
It is also possible to change specific bars in order to identify the extent to which a trend has continued as seen below.
If you would to find out more about this indicator, visit www.kenzing.com
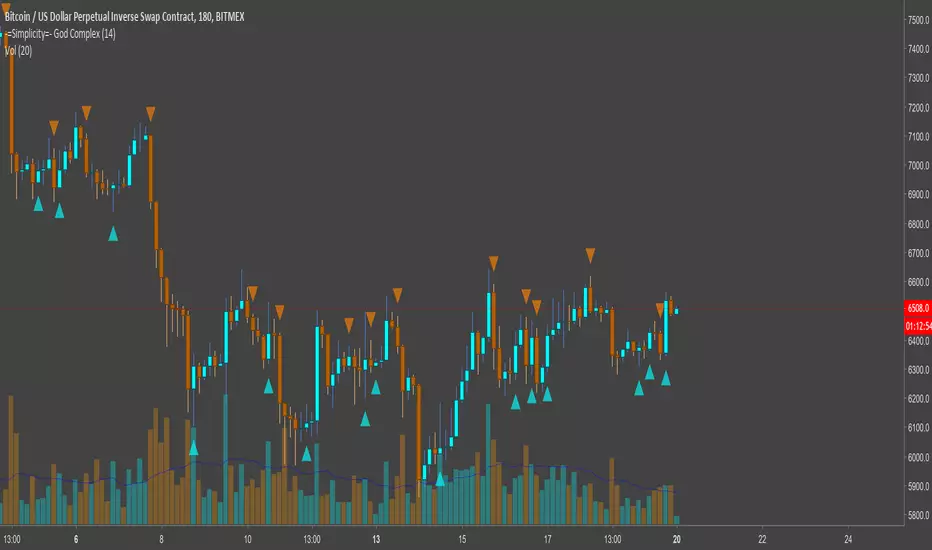
-=Simplicity=- God ComplexMaking money is simple when you wield untold power
-=Simplicity=- God Complex is a non-repaint, set-and-forget indicator for identifying optimum times to enter and exit the market, with both longs and shorts.
Applicable to any asset-type, market, candle type and timeframe, God Complex is a quintessential tool for both new and veteran traders.
With only one variable to change it will take a minimal amount of time to find a value that suits you. As a rule of thumb, the higher the value the less it will fire signals, but the safer those signals will be.
You can also opt to only enable 'Long' or 'Short' signals on the chart. This is meaningful when trading leverage or margin along trend that you are able to identify.
This can be used as a guide for manual trading, but is best utilized as a tool for automating trades so that you don't miss out on any market activity.
This is a link to a document elucidating a little more on the script: docs.google.com
---------------------
Here are a few charts showing how the script performs against them. Enjoy.
Below is a chart depicting XBTUSD (BitMEX) on a 30M timeframe. Both longs and shorts are enabled and the variable is set to a value of 144.
Below here we have a chart for BNBBTC (Binance) on a 1HR timeframe with variable set to a value of 14 on Heikin Ashi candles. Large orange arrows are shorts and smaller blue arrows are closing shorts. There's a clear downtrend, hence we're only shorting.
This is EOSBTC (Bitfinex) on a 2HR timeframe with a variable set to 7 on Renko charts. Small orange arrows are exiting a long position and large blue arrows are entering a long position. The uptrend is obvious to see, so that's why we're mainly displaying longs here.
Not that I reccommend anyone to trade such a small timeframe, but this is for all you scalpers out there. XBTUSD (BitMEX) on a 1M timeframe with a variable value of 233. Both longs and shorts are enabled for this chart. Normal bar candles apply.
Finally, this is ARKBTC (BitTrex) on a 2HR timeframe against a 500R chart with a variable of 377. Only shorts are enabled, as we're in a downtrend.
---------------------
Please contact @overttherainbow on Telegram if you'd like to discuss anything, alternatively reach out to me here (although Telegram is better for a quick response; I'll be around 9AM-11PM GMT)
Random Walk SimulationUnderstanding the Random Walk Simulation
This indicator randomly generates alternative price outcomes derived from the price movements of the underlying security. Monte Carlo methods rely on repeated random sampling to create a data set that has the same characteristics as the sample source, representing examples of alternate outcomes. The data set created using random sampling is called a “random walk”.
First, every bar in the time stamp is measured and put into a logarithmic population. Then, a sample is drawn at random from the population and is used to determine the next price movement of the random walk. This process is repeated fifteen times to visualise whether the alternative outcomes lie above or beneath the current market price of the security.
Random Walk Utility
The random walk generator allows users of the Monte Carlo to further understand how the Monte Carlo projection is generated by creating a visual representation of individual random walks. Trends that occur on the random walks may correlate to the historical price action of the underlying security.
You can find the Monte Carlo Simulator here:
Input Values
Select the “ Format ”, button located next to the indicator label to adjust the input values and the style.
The Random Walk indicator only has one user-defined input value that can be changed.
The Random_Variable randomises a set of random walks. If this variable is changed, it will run a fresh set of 15 random walks which will result in a slightly different outcome.
Adding the indicator to your chart multiple times using many different random variables will allow you to achieve a more accurate reading. Ideally, the Monte Carlo Simulator takes an average of these to be interpreted.
For more information on this indicator, the full PDF can be found here: www.kenzing.com

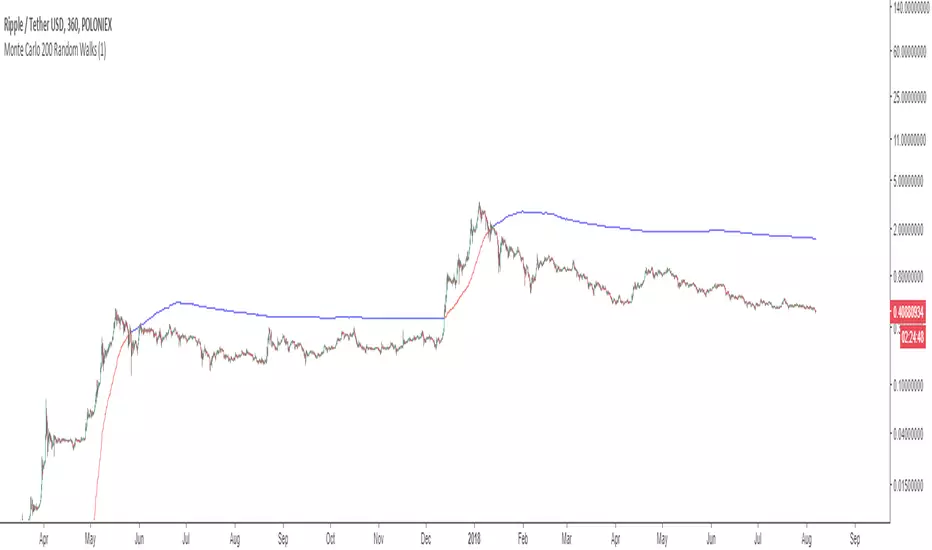
Monte Carlo Simulation (200 Random Walks)Understanding the Monte Carlo Simulation
This indicator uses Monte Carlo methods to predict the future price of a security using 200 random walks.
Monte Carlo methods rely on repeated random sampling to create a data set that has the same characteristics as the sample source, representing examples of alternate possible outcomes. The data set created using random sampling is called a “random walk”. Obtaining a mean from 200 random walks allows us to benchmark the performance of the source against the random walks obtained from the source.
Monte Carlo Utility
This Monte Carlo simulator plots a single line that represents 200 random walks across any security and time stamp. The line is red if most of the random walks are lower than the price of the security, and blue if the walks are higher.
Input Values
Select the “ Format ”, button located next to the indicator label to adjust the input values and the style.
The Monte Carlo indicator has only one user-defined input value that can be changed.
The Random_Variable determines set of random walks. If this variable is changed, it will run a fresh set
of 200 random walks which will result in a slightly different outcome. 200 random walks will load
relatively quick and produce roughly the same outcome as 10,000 random walks.
Adding the indicator to your chart multiple times using many different random variables will allow you
to achieve a more accurate reading.
For more information on this indicator view the PDF here: www.kenzing.com
Block Sale Transaction Alert!Understanding Block Transactions
Block transactions are transactions that are of a significantly high value. This can be a transaction of any
security that is large enough to have an impact on the market price and cause a flow-on effect of
investment that will ensue.
Block transactions are significant because the party who initiated the transaction is likely to be more
confident than the retail investor. Confidence can be assumed by the value of the transaction and the
source can be either,
a) an institutional fund with access to detailed and reliable information
or
b) a party with secret, insider knowledge that is currently undisclosed to the market.
For these reasons, being aware of block transactions is extremely important for anyone looking for a
new investment opportunity or risk management of current holdings.
Block Transaction Utility
This indicator is compatible with instant E-mail and SMS notifications so that the investor will be well
informed of institutional activity and make trading decisions quickly.
If a block transaction occurs, the user will be able to visualize whether it was a purchase or sale as it will
be textualized above or below the current bar if used with the Block Transaction Buy Alert found here:
Input Values
The visual representation of the transactions are customizable as you can adjust the shape, color, and
location by clicking “ Format ” at the top left of your chart, next to the indicator label.
Setting up Text message or E-mail Notifications
In order to receive the text message and/or email alerts, you will need to make sure the correct contact
information is saved in your TradingView® account settings.
For more information on this indicator, and setting up alerts, view this PDF: www.kenzing.com


SignalToSignal.com - Logical Volume Trading SystemOur Logical Volume Trading System is a vast improvement on ‘standard’ volume spread analysis. Based on 15+ year combined experience with our Smart Volume Spread Analysis software, we have refined our analysis and algorithms to provide the most powerful VSA indicator on TradingView.
Combining fundamental analysis, technical analysis, and volume analysis into a powerful methodology that enables you to trade the markets in a way that is uniquely accurate.
The Signal to Signal Logical Volume Trading System quickly handles time-consuming manual background analysis, volume analysis, and signal analysis leaving you free to make considered and knowledgeable trading decisions instantly.
We have refined our price action and volume analysis algorithms to focus on the core trading signals, which often precede large moves, providing you with clear insight and a roadmap to trading successfully.
Due to unique characteristics of the Pine programming language that TradingView indicators utilize, we have also made adjustments to the signal validation and advisor systems. The result is a clean, easy to read chart which allows you to recognize strong setups as soon as they form.
Lastly, our Logical Volume Trading System is customizable. You can choose which signals and advisor warnings are enabled, allowing you test any number of ideas and analysis combinations. Of course the system is optimized for most charts by default so you can get started right away.
To gain access to the Logical Volume Trading System, please visit our website .
If you have any questions, please contact us through the Contact link on our website - signaltosignal.com

Stock Vn Signal Buy Sell Pro [PlungerMen]Vn Stock Signal Buy Sell Pro , mix 2 indicaror in it for exactly Signal
This Script is perfectly functional and works well by me and the best way to use this script is to use it with “Long Short" script, both compliment for each other. the "Long Short" script is Free, you can find it by searching
If you want to be more accurate and more efficient, more comfortable when you do not want to see too many other indicators, you can register for our Professional edition.
- The Professional Edition supports Level 1 and Level 2 commands ( display at chart : LONG+, long-, SHORT,+,short- ), which are very effective in allocating funds and optimizing your profits
Besides that,You will be supported by personal preferences, profit maximization -2.64% -1.30% -3.21% -3.33% -3.27% Scalping Pro and B Long Short Pro
- We will invite you to the signal channel Telgram with the announcement of the bottom and the peak of the BTC -3.11% -2.64% -1.30% -3.21% -3.33% -3.27% 0.60% -0.13% ,the big variable variable has exists
**We hope you enjoy this script. Your support will help us develop more good quality scripts in the future to serve the community **
**Remember, Like this script and posivite feedback if you are satisfied**
if you have any questions, post a comment ... below here
*********** Guide:
+ option for all frames : Click setting and input high and low for time inteval
+ hide wave trend : Click setting -> click Style --> Up trend Fill or Down trend fill
******
New features: this time we add two lines that can help traders trader safer. When the red line cross above the green line means we are in the downtrend and when the green line cross above the red line, which means we are in a uptrend. This new features will help traders do a safer trade at small time frame.
We have the Script free for the user pass, search keyword " Vn Stock Signal Buy Sell Pro "
-->> 0.2 eth/1 month will be used Script: Vn Stock Signal Buy Sell Pro Pro an Super Bot alert telegram <--
Swinger v2This script is used for swing trading:
Rules for reading indicator plot:
1) BUY: on green
2) SELL: on red
3) The height of the indicator tells the strength of the trend.
Message me for access
