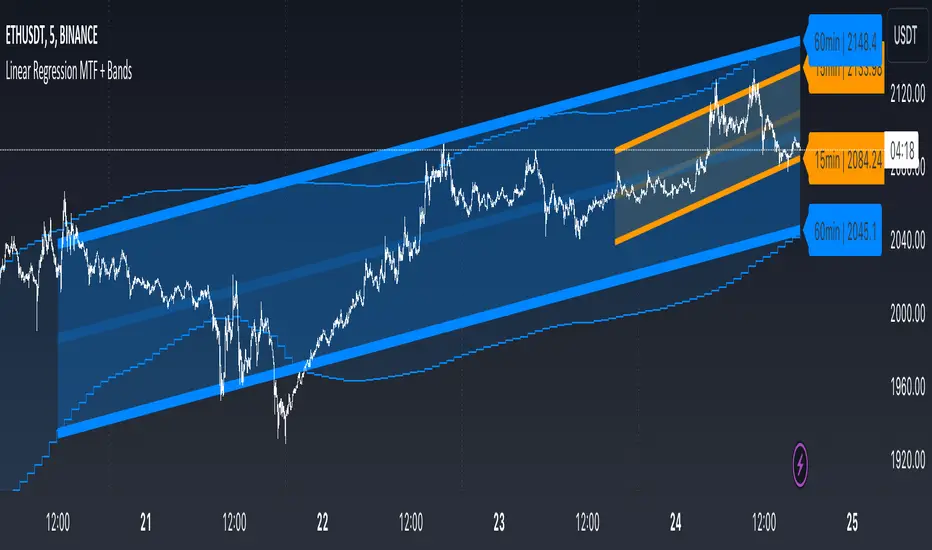
Linear Regression MTF + Bands
Multiple Time Frames (MTFs): The indicator allows you to view linear regression trends over three different time frames (TF1, TF2, TF3) simultaneously. This means a trader can observe short, medium, and long-term trends on a single chart, which is valuable for understanding overall market direction and making cross-timeframe comparisons.
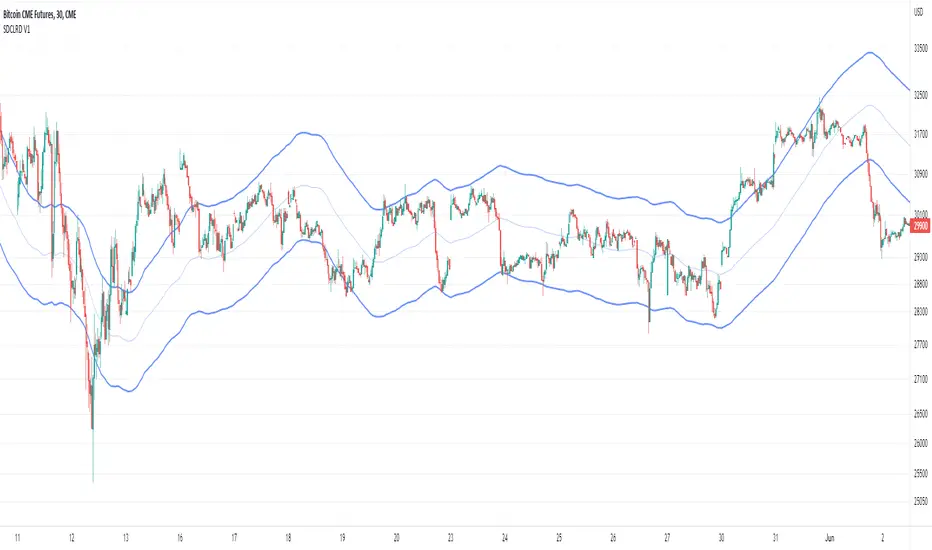
Linear Regression Bands: For each time frame, the indicator calculates linear regression bands. These bands represent the expected price range based on past prices. The middle line is the linear regression line, and the upper and lower lines are set at a specified deviation from this line. Traders can use these bands to spot potential overbought or oversold conditions, or to anticipate future price movements.
History Bands: Looking at linear regression channels can be deceiving if the user does not understand the calculation. In order to see where the channel was at in history the user can display the history bands to see where price actual was in a non-repainting fashion.
Customization Options: Traders can customize various aspects of the indicator, such as whether to display each time frame, the length of the linear regression (how many past data points it considers), and the deviation for the bands. This flexibility allows traders to adapt the indicator to their specific trading style and the asset they are analyzing.
Alerts: The script includes functionality to set alerts based on the price crossing the upper or lower bands of any time frame. This feature helps traders to be notified of potential trading opportunities or risks without constantly monitoring the chart.
Examples
The 15minute linear regression is overlayed onto a 5 minute chart. We are able to see higher timeframe average and extremes. The average is the middle of the channel and the extremes are the outer edges of the bands. The bands are non-repainting meaning that is the actual value of the channel at that place in time.
Here multiple channels are shown at once. We have a linear regression for the 5, 15, and 60 minute charts. If your strategy uses those timeframes you can see the average and overbought/oversold areas without having to flip through charts.
In this example we show just the history bands. The bands could be thought of as a "don't diddle in the middle" area if your strategy is looking for reversals
You can extend the channel into the future via the various input settings.
Standarddevation
Z-Score - AsymmetrikZ-Score-Asymmetrik User Manual
Introduction
The Z-Score Indicator is a powerful tool used in technical analysis to measure how far a data point is from the mean value of a dataset, measured in terms of standard deviations. This indicator helps traders identify potential overbought or oversold conditions in the market.
This user manual provides a comprehensive guide on how to use the Z-Score Indicator in TradingView.
0. Quickstart
- Set the thresholds based on your asset (number of standard deviations that you consider being extreme for this asset / timeframe).
- Red background indicates a possible overbought situation, green background an oversold one.
- The color and direction of the Z-Score Line acts as a confirmation of the trend reversal.
1. Indicator Overview
The Z-Score Indicator, also known as the Z-Score Oscillator, is designed to display the Z-Score of a selected financial instrument on your TradingView chart. The Z-Score measures how many standard deviations an asset's price is from its mean (average) price over a specified period.
The indicator consists of the following components:
- Z-Score Line: This line represents the Z-Score value and is displayed on the indicator panel.
- Background Color: The background color of the indicator panel changes based on user-defined thresholds.
2. Inputs
The indicator provides several customizable inputs to tailor it to your specific trading preferences:
- Number of Periods: This input allows you to define the number of periods over which the Z-Score will be calculated. A longer period will provide a smoother Z-Score line but may be less responsive to recent price changes.
- Z-Score Low Threshold: Sets the lower threshold value for the Z-Score. When the Z-Score crosses below this threshold, the background color of the indicator panel changes accordingly.
- Z-Score High Threshold: Sets the upper threshold value for the Z-Score. When the Z-Score crosses above this threshold, the background color of the indicator panel changes accordingly.
3. How to Use the Indicator
Here are the steps to use the Z-Score Indicator:
- Adjust Parameters: Modify the indicator's inputs as needed. You can change the number of periods for the Z-Score calculation and set your desired low and high thresholds.
- Interpret the Indicator: Observe the Z-Score line on the indicator panel. It fluctuates above and below zero. Pay attention to the background color changes when the Z-Score crosses your specified thresholds.
4. Interpreting the Indicator
- Z-Score Line: The Z-Score line represents the current Z-Score value. When it is above zero, it suggests that the asset's price is above the mean, indicating potential overvaluation. When below zero, it suggests undervaluation.
- Background Color: The background color of the indicator panel changes based on the Z-Score's position relative to the specified thresholds. Green indicates the Z-Score is below the low threshold (potential undervaluation), while red indicates it is above the high threshold (potential overvaluation).
- Z-Score Line Color: The color of the Z-Score line shows that the Z-Score is trending up compared to its moving average. This can be used as a validation of the background color.
5. Customization Options
You can customize the Z-Score Indicator in the following ways:
- Adjust Inputs: Modify the number of periods and the Z-Score thresholds.
- Change Line and Background Colors: You can customize the colors of the Z-Score line and background by editing the indicator's script.
6. Troubleshooting
If you encounter any issues while using the Z-Score Indicator, make sure to check the following:
- Ensure that the indicator is applied correctly to your chart.
- Verify that the indicator's inputs match your intended settings.
- Contact me for more support if needed
7. Conclusion
The Z-Score Indicator is a valuable tool for traders and investors to identify potential overbought and oversold conditions in the market. By understanding how the Z-Score works and customizing it to your preferences, you can integrate it into your trading strategy to make informed decisions.
Remember that trading involves risk, and it's essential to combine technical indicators like the Z-Score with other analysis methods and risk management strategies for successful trading.

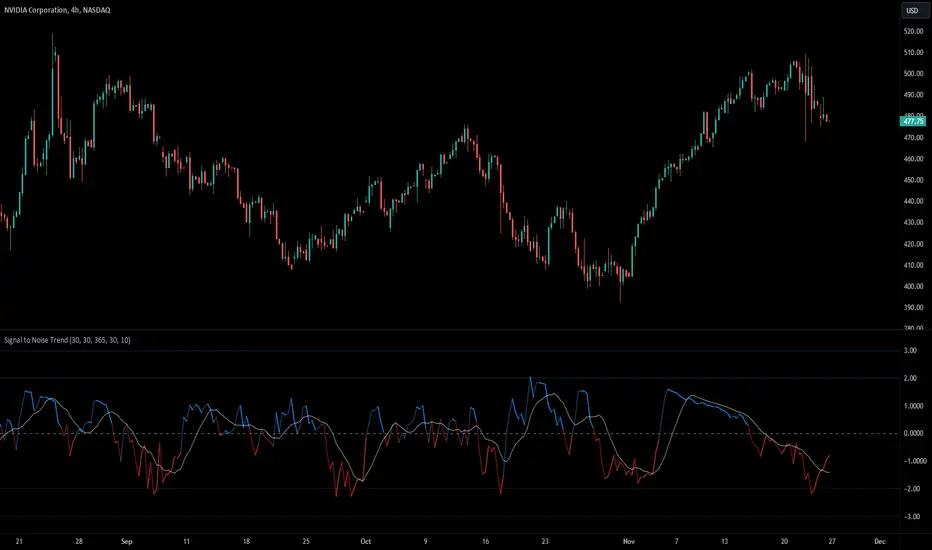
Signal to Noise TrendSignal to Noise Ratio
The Signal to Noise Ratio or SNR is used to assess the quality of information or data by comparing the strength of a useful signal to the presence of background noise or random variations.
In Finance the SNR refers to the ratio of strength of a trading signal to the background noise. A high SNR suggest a clear and reliable signal, meanwhile a low SNR indicates more noise (random fluctuations, volatility, or randomness).
Signal To Noise Trend
This indicator basically calculates the signal to noise of returns and then gets the Z-Score of the signal to noise ratio to find extremes levels of signal and noise. The Lines basically are standard deviations from the mean. 1,2,3 Are standard deviations same with the -1,-2,-3 Lines.
The signal is expressed as the positive Z-Score value, and the Noise is the negative Z-Score Value.
The moving average enhances the indicator ability to display the trend of returns and the trend strength. It provides a smooth representation of the Signal to Nose Ratio values.
There are more trending conditions when there is a higher signal, and there is more "ranging" conditions when there is more noise present in the markets.
The Standard deviations help find extreme levels of signal and noise. If the noise reaches the standard deviation of -3 then that means that there is a extreme negative deviation from the mean, and this would be a rare occurrence, with a lot of noise. This could indicate a potential reversion in market states, and could be followed by a trending move.
Another example is that if the Z-Score value reaches a Standard deviation of 3, this could mean that there is extremely strong and rare signal, and could potentially mean a change to a more noisy environment soon.
dharmatech : Standard Deviation ChannelDESCRIPTION
Based on version by leojez.
Adds a 3rd standard deviation level.
Twice as fast as original version.
Refactored and simplified source code.
HOW TO USE
Load your chart
Adjust the timeframe and zoom of the chart so that the trend you're interested in is in view.
Add the indicator
Use the measuring tool to measure the number of bars from the start of the trend to the latest candle.
Open settings for the indicator.
Set the length value to the number of bars that you noted.

Complete Discrete Fourier Transform ToolkitThis is an expansion from my Discrete Fourier Transform Overlay indicator which offers various features that may be useful for traders wishing to apply frequency analysis or integral transform to their trading. For those unfamiliar with the concept, the discrete Fourier transform decomposes wave or wave-like data into functions depending on frequency. This can be helpful in demonstrating or interpreting trends and periodic frequencies in time-series price data, or oscillating indicators.
This toolkit has the following features:
Fourier bands (deviation cloud): The deviation cloud expresses the uncertainty in the DFT algorithm, as well as the relative change in frequency of the curve.
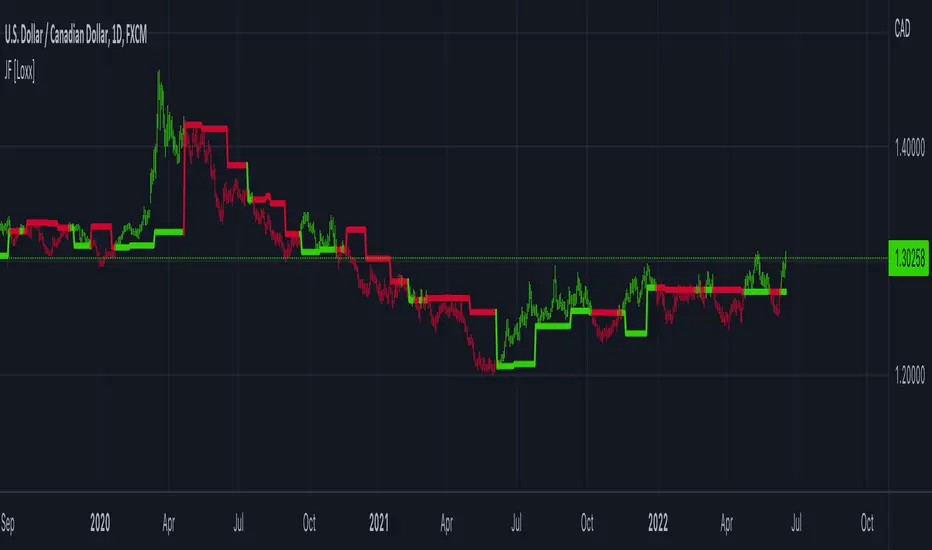
Fourier supertrend: The supertrend is applied as a product of the DFT algorithm, instead of onto the price data itself. This filters the supertrend from infrequent periodicities. For trading, this means that the supertrend will not be affected by false breakouts or breakdowns. See the image below for an example:
Future updates may include:
Projection of the probabilistic uncertainty principle. In a nutshell, the concept can be used to project uncertainties forwards through price data to forecast the path of least resistance, or, the most probable frequency.
Machine learning capabilities. Justin Doherty has done the Pine Script community a great service in introducing kNN algorithms with Lorentzian distance calculations; however, this is only the start of relativistic mechanics that can be applied to time series data. The DFT algorithm essentially filters data into its periodicities; this data can be inserted into a relativistic kNN algorithm - Lorenz or otherwise - to possibly improve accuracy.

Weekly Range Support & Resistance Levels [QuantVue]Weekly Range Support & Resistance Levels
Description:
The Weekly Range Support & Resistance Levels analyzes weekly ranges and takes the average range of the last 30 weeks (default setting).
It also takes the average +/- a standard deviation, and creates support & resistance levels/zones based on the weekly opening price.
The levels will update each week, and previous weekly levels can be toggled on or off.
Settings:
🔹Averaging Period
🔹Standard Deviation Multiplier
🔹Toggle Support & Resistance Prices
🔹Show Weekly Open Line
🔹Show Previous Levels
Don't hesitate to reach out with any questions or concerns. We hope you enjoy!
Cheers.

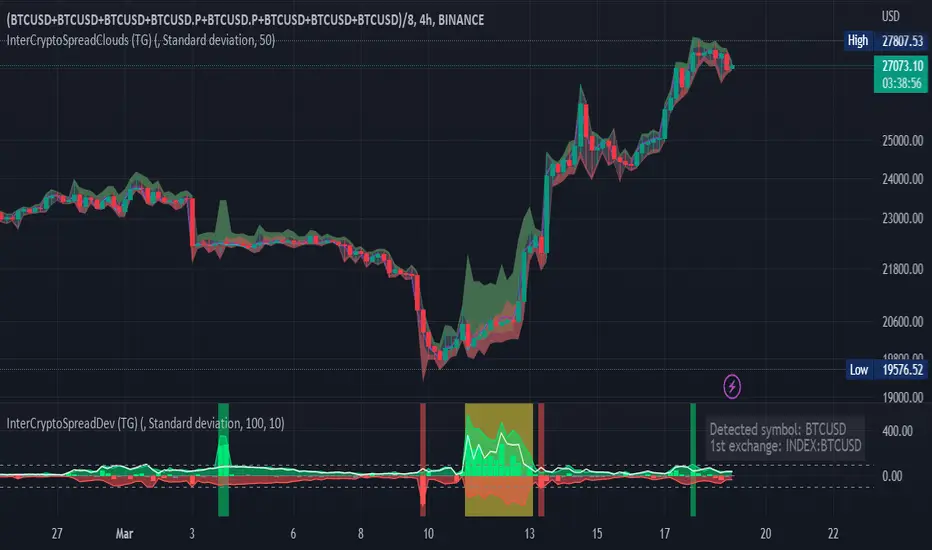
Inter-Exchanges Crypto Price Spread Deviation (Tartigradia)Measures the deviation of price metrics between various exchanges. It's a kind of realized volatility indicator, as the idea is that in times of high volatility (high emotions, fear, uncertainty), it's more likely that market inefficiencies will appear for the same asset between different market makers, ie, the price can temporarily differ a lot. This indicator will catch these instants of high differences between exchanges, even if they lasted only an instant (because we use high and low values).
Both standard deviation and median absolute deviation (more robust to outliers, ie, exchanges with a very different price from others won't influence the median absolute deviation, but the standard deviation yes).
Compared to other inter-exchanges spread indicators, this one offers two major features:
* The symbol automatically adapts to the symbol currently selected in user's chart. Hence, switching between tickers does not require the user to modify any option, everything is dynamically updated behind the scenes.
* It's easy to add more exchanges (requires some code editing because PineScript v5 does not allow dynamical request.security() calls).
Limitations/things to know:
* History is limited to what the ticker itself display. Ie, even if the exchanges specified in this indicator have more data than the ticker currently displayed in the user's chart, the indicator will show only a timeperiod as long as the chart.
* The indicator can manage multiple exchanges of different historical length (ie, some exchanges having more data going way earlier in the past than others), in which case they will simply be ignored from calculations when far back in the past. Hence, you should be aware that the further you go in the past, the less exchanges will have such data, and hence the less accurate the measures will be (because the deviation will be calculated from less sources than more recent bars). This is thanks to how the array.* math functions behave in case of na values, they simply skip them from calculations, contrary to math.* functions.
TheATR™: Volatility Extremes (VolEx)Volatility is a crucial aspect of financial markets that is closely monitored by traders and investors alike. The traditional Average True Range (ATR) oscillator is a widely used technical indicator for measuring volatility in financial markets. However, there are limitations to the ATR oscillator, as it does not account for changing market conditions and may not adequately reflect extreme price movements. To address these limitations, TheATR has developed the VolEx indicator, which aims to identify extremes in the ATR oscillator by building dynamic thresholds using either a 'percentage' or 'standard deviation' based comparison with the value of the ATR.
The VolEx indicator utilizes a dynamic approach to measure volatility by considering the current level of the ATR oscillator relative to the dynamically generated thresholds. The dynamic thresholds are calculated based on the current ATR value and the chosen method of comparison (either 'percentage' or 'standard deviation'). If the ATR value exceeds the upper dynamic threshold, the market is experiencing high volatility, while a value below the lower dynamic threshold indicates low volatility.
The VolEx indicator offers several advantages over traditional volatility indicators, such as the ATR oscillator. First, it takes into account the changing market conditions and adjusts the thresholds accordingly. Second, it offers flexibility in the choice of the comparison method, allowing traders to tailor the indicator to their specific trading strategies. Finally, it provides clear signals for identifying extremes in volatility, which can be used to inform trading decisions.
In summary, the VolEx indicator developed by TheATR is a dynamic and flexible technical indicator that offers a robust approach to measuring volatility in financial markets. By utilizing dynamic thresholds and allowing for different comparison methods, the VolEx indicator provides a valuable tool for traders and investors seeking to identify extremes in market volatility..
NOTE: It is important to note that volatility, as measured by the VolEx indicator, does not provide any directional bias for the market movement. Rather, it simply indicates the degree to which the market is moving, regardless of direction. Traders and investors must use other technical or fundamental analysis tools to determine the direction of the market and make informed trading decisions based on their individual strategies and risk tolerance.

SFC Smart Money - VolatilityIn statistics, a normal distribution is a type of continuous probability distribution for a real-valued random variable. Normal distributions are important in statistics and are often used in the natural and social sciences to represent real-valued random variables whose distributions are not known.
The indicator provide a deep statistic for the specified period. It calculate the normal distribution of all candles in the particular period, in order to measure the volatility and the probabilities. Also it separate bull from bear candles and calculate the normal distribution of each group. The calculations are mode based on open-open data and high-low data.
Volatility
Volatility is a statistical measure of the dispersion of returns for a given security or market index. In most cases, the higher the volatility , the riskier the security. Volatility is often measured from either the standard deviation or variance between returns from that same security or market index.
Volatility often refers to the amount of uncertainty or risk related to the size of changes in a security's value. A higher volatility means that a security's value can potentially be spread out over a larger range of values. This means that the price of the security can change dramatically over a short time period in either direction. A lower volatility means that a security's value does not fluctuate dramatically, and tends to be more steady.
While variance captures the dispersion of returns around the mean of an asset in general, volatility is a measure of that variance bounded by a specific period of time. Thus, we can report daily volatility , weekly, monthly, or annualized volatility .
This statistic gives very accurate information how the price moved in the past and what are normal movements and spikes. From this information, a future actions can be taken.
For better understanding, all data is calculated in pips.
Features:
- Mean - Mean is the one we are most used to, i.e. the average.
- Median -Sometimes, the data set values can have a few values which are at the extreme ends, and this might cause the mean of the data set to portray an incorrect picture.
Thus, we use the median, which gives the middle value of the sorted data set.
- Mode - In a given dataset, the mode will be the number which is occurring the most.
- Max - Maximum volatility for a given range.
- Min - Minimum volatility for a given range.
- Standard Deviation - The standard deviation tells us how far the value deviates from the mean.
- Range - Range simply gives the difference between the min and max values of the data set.
- ATR - Average True Range measures volatility, taking into account any gaps in the price movement.
- Normal Distribution - The basic premise is that given a range of observations, it is found that most of the values center around the mean and within one standard deviation
away from the mean.
- Probability - probability of outcomes.
We all know that the banks and professional traders do not trade with charts, but with different statistical methods, math. models and macroeconomics. This statistical indicator shows one of these methods.
It is recommended to use the indicator on daily timeframe . It also works on other timeframes, for example 1H for intraday analysis.
For more information how the normal distribution works, please search in internet.

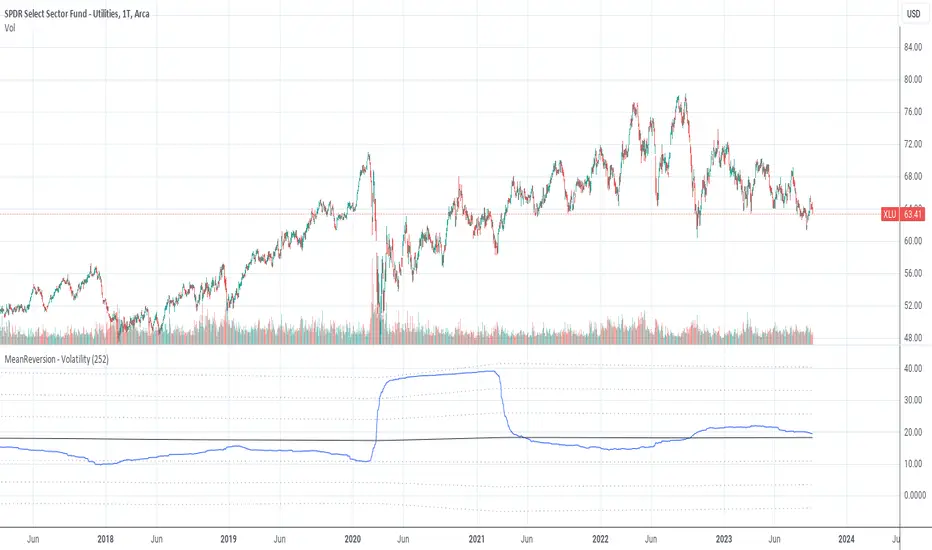
MeanReversion by VolatilityMean reversion is a financial term for the assumption that an asset will return to its mean value.
This indicator calculate the volatility of an asset over a period of time and show the values of logRerturn, mean and standart deviations.
The default time period for volatility calculation is 252 bars at a "Daily" chart. At a "Daily" chart 252 bar means one trading-year.
See also:
MeanReversion by Logarithmic Returns
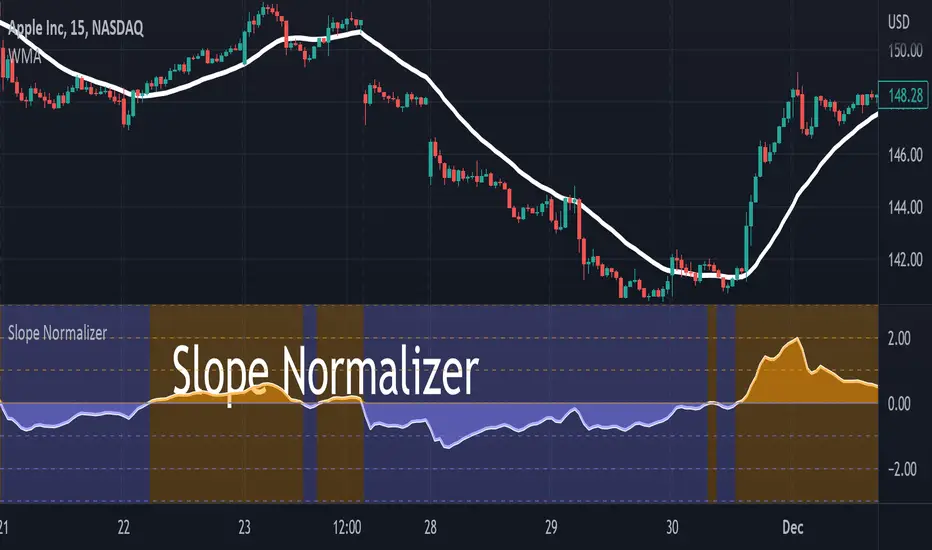
Slope NormalizerBrief:
This oscillator style indicator takes another indicator as its source and measures the change over time (the slope). It then isolates the positive slope values from the negative slope values to determine a 'normal' slope value for each.
** A 'normal' value of 1.0 is determined by the average slope plus the standard deviation of that slope.
The Scale
This indicator is not perfectly linear. The values are interpolated differently from 0.0 - 1.0 than values greater than 1.0.
From values 0.0 to 1.0 (positive or negative): it means that the value of the slope is less than 'normal' **.
Any value above 1.0 means the current slope is greater than 'normal' **.
A value of 2.0 means the value is the average plus 2x the standard deviation.
A value of 3.0 means the value is the average plus 3x the standard deviation.
A value greater than 4.0 means the value is greater than the average plus 4x the standard deviation.
Because the slope value is normalized, the meaning of these values can remain generally the same for different symbols.
Potential Usage Examples/b]
Using this in conjunction with an SMA or WMA may indicate a change in trend, or a change in trend-strength.
Any values greater than 4 indicate a very strong (and unusual) trend that may not likely be sustainable.
Any values cycling between +1.0 and -1.0 may mean indecision.
A value that is decreasing below 0.5 may predict a change in trend (slope may soon invert).
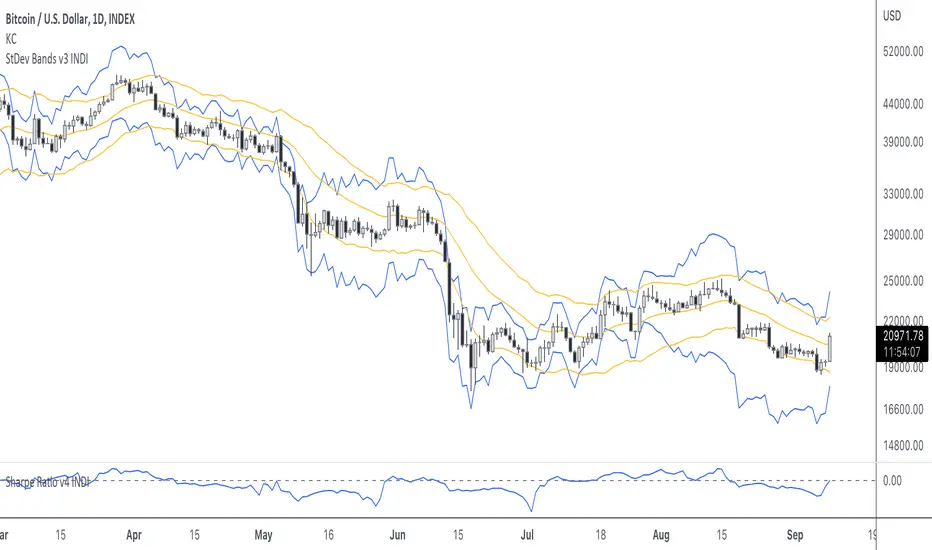
StDev BandsThis is a "bands"-type indicator. It was developed out of my Sharpe Ratio indicator . It uses the standard deviation of returns as basis for drawing the bands. I'm going to update this indicator as the other indicator evolves. Please be sure you know how to calculate Sharpe Ratio and check out the Sharpe Ratio indicator as well. This will help you understand the purpose of this indicator a bit more.
As a very short introduction. Many investors use the standard deviation of returns as risk measurement . I admit the defaults of this indicator aren't perfect. Normally investors use the standard deviation over a 1 year period. Traditional finance uses 265 days, and because crypto never sleeps, we could use 365. I defaulted it to 20.
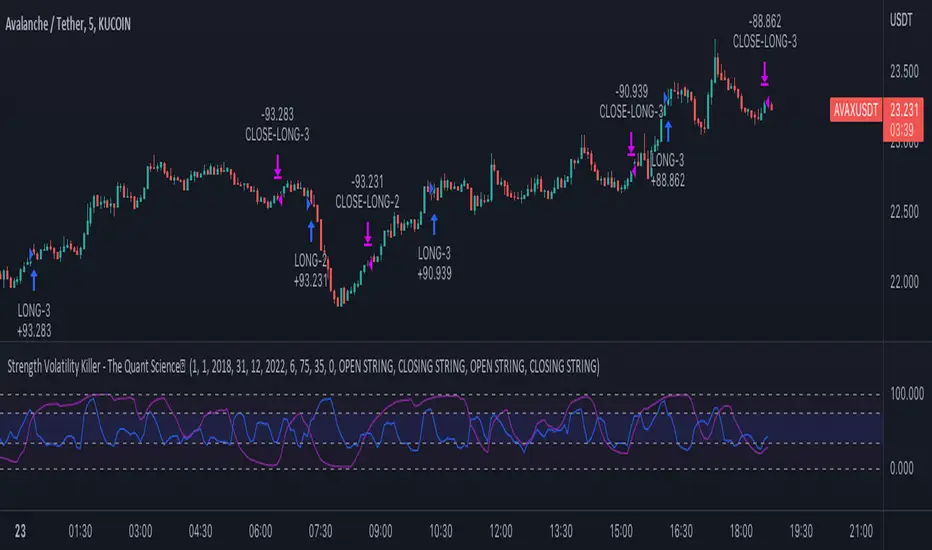
Strength Volatility Killer - The Quant ScienceStrength Volatility Killer - The Quant Science™ is based on a special version of RSI (Relative Strength Index), created with the simple average and standard deviation.
DESCRIPTION
The algorithm analyses the market and opens positions following three different volatility entry conditions. Each entry has a specific and personal exit condition. The user can setting trailing stop loss from user interface.
USER INTERFACE SETTING
Configures the algorithm from the user interface.
AUTO TRADING COMPLIANT
With the user interface, the trader can easily set up this algorithm for automatic trading.
BACKTESTING INCLUDED
The trader can adjust the backtesting period of the strategy before putting it live. Analyze large periods such as years or months or focus on short-term periods.
NO LIMIT TIMEFRAME
This algorithm can be used on all timeframes.
GENERAL FEATURES
Multi-strategy: the algorithm can apply long strategy or short strategy.
Built-in alerts: the algorithm contains alerts that can be customized from the user interface.
Integrated indicator: indicator is included.
Backtesting included: quickly automatic backtesting of the strategy.
Auto-trading compliant: functions for auto trading are included.
ABOUT BACKTESTING
Backtesting refers to the period 13 June 2022 - today, ticker: AVAX/USDT, timeframe 5 minutes.
Initial capital: $1000.00
Commission per trade: 0.03%
Crypto Portfolio ManagementCrypto Portfolio Management
This is an indicator not like the other ones that you regularly see in tradingview. The main difference is that this indicator does not plot a value for each candle bar like you would see with RSI or MACD. Actually it is table and it just uses tradingview great database of assets to plot some valuebale information that can not be found elsewhere easily. These metrics are some basic one that is used by portfolio managers to decide what they want to hold in their portfolio. The basic idea is that you should hold assets in your basket that are less correlated to the benchmark.
Benchmark in traditional context refers to main market indices like S&P 500 of US market. But they already have a lot of tools available. My effort was for crypto investors who are trying to rebalance their portfolio every month or week to have some good metrics to make decision. Because of this I used Bitcoin as crypto market benchmark. So, everything is compared to bitcoin in this script. I’m gonna explain the terms that is used in the table’s columns below.
MAKE SURE YOU PUT YOUR CHART AT DAILY AND AT THE MAXIMUM AVAILABLE DATA EXCHANGE.
Y-Exp
This is yearly expected return of the asset. It is simply the mean of the yearly returns of the asset. (these calculations are not typical in Tradingview because mainly we calculate on each bar and give value at the same bar but here this value to change once a year). Remember that the higher this value is the better it is because historically the asset have shown good returns but there is a tip: Always check the available historical data in any asset that you are adding if you add an asset that has only 1 year of data available or you use an exchange data that recently added the coin you will get unsignificant results and the results can not be trusted. You should always selects coins and market (coins can be changed in setting) that have the largest data available.
Y-SDev
This is a little bit complicated than the previous. This is the standard deviation of the yearly returns. This is a classic measure of RISK in financial markets. The higher the value, the more risk is involved with the asset that you have added. If you added two assets that have same returns but different Standard deviations, the rational thinker should choose the asset with lower Standard deviation.
The standard deviation is a good place to start but there are some considerations to have -it is getting complicated and average user should not be involved with these terms and can ignore the next phrases- standard deviation and mean of the yearly returns are random variables, these variables have a theoretical probability density function and these functions are not gaussian normal distribution. Because of this in the professional usage these returns should be transformed to a normal distribution and have all these terms calculated there and then transform back to its own normal state and then be used for any serious investment decision. I think these calculations can be done on Tradingview but I need you support to do this in the form of like and share of my scripts and ideas.
M-Exp and M-SDev
These terms are like the previous ones but it is calculated on monthly returns. As it goes for yearly return, the monthly returns change once a monthly candle closes. So be patient to use this indicator.
I highly recommend not to make decisions on monthly data due to a lot of noise involved with this market but in long run it is ok. So go with yearly returns and wait at least for 3 years to see your results.
CorToBTC
Basically you want to buy something that is less correalted with the benchmark. this is the correlation of the asset to bitcoin.
Sharpe Ratio
This is one of the most used metric as a risk adjusted return measurment. you can google it for more information. The higher this value the better. remmeber with any invenstment it is important to understand risks associated with the assets that you are buying.
DownFromATH
This metric that I didn't see anywhere in the tradingview and is familiar in the platforms like coinmarketcap. this is a real calculation of precentage down from ATH (All Time High). it means how much percentage a coin is down from the maximum price that the asset has experienced until now.
***
Remember you can change all the asset except main asset. If you like this script to 500 I will update this continuously.

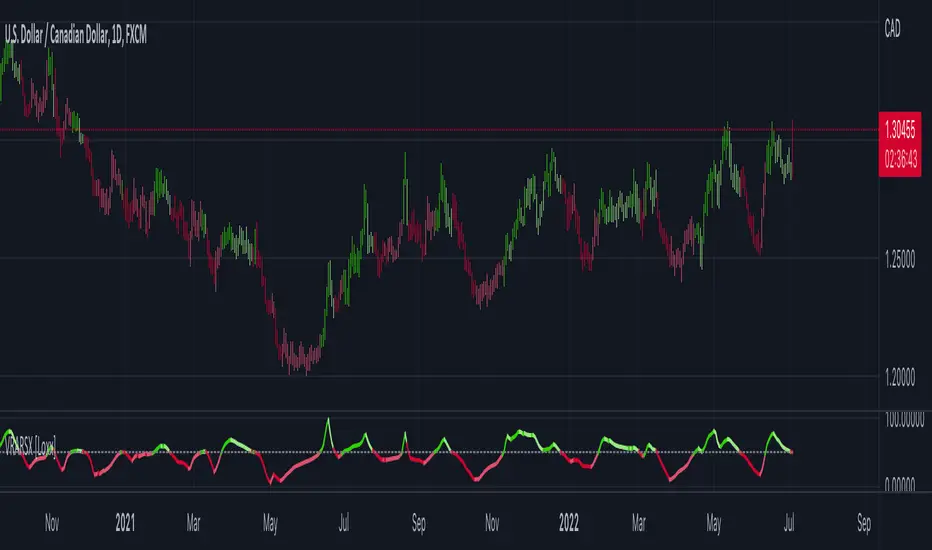
Volatility Ratio Adaptive RSX [Loxx]Volatility Ratio Adaptive RSX this indicator adds volatility ratio adapting and speed value to RSX in order to make it more responsive to market condition changes at the times of high volatility, and to make it smoother in the times of low volatility
What is RSX?
RSI is a very popular technical indicator, because it takes into consideration market speed, direction and trend uniformity. However, the its widely criticized drawback is its noisy (jittery) appearance. The Jurik RSX retains all the useful features of RSI, but with one important exception: the noise is gone with no added lag.
Included:
-Toggle on/off bar coloring
Standard deviation channel of linear regression distance [AbAh]The indicator calculates the distance between linear regression line and the data point (price) as a percentage , then calculates the standard deviation for the linear regression distance , then draw the channel of two lines depending on the values of standard deviation .
///////// How to use ////////////////
1 - for Best result , indicator should be used on 2H frame Time of less : like 1H or 30 min
2 - The upper line and the lower line, both play a role as a support and resistance area, when the price bounces from the upper zone or lower zone, there is a high probability that it will move to the other line.
3 - The price breakout of one of the lower or upper lines may indicate a major price movement coming in the direction of the breakout
/////////////////////////////////////
STD Stepped Ehlers Optimal Tracking Filter MTF w/ Alerts [Loxx]STD Stepped Ehlers Optimal Tracking Filter MTF w/ Alerts is the traditional Ehlers Optimal Tracking Filter but with stepped price levels, access to multiple time frames, and alerts.
What is Ehlers Optimal Tracking Filter?
From "OPTIMAL TRACKING FILTERS" by John Ehlers:
"Dr. R.E. Kalman introduced his concept of optimum estimation in 1960. Since that time, his technique has proven to be a powerful and practical tool. The approach is particularly well suited for optimizing the performance of modern terrestrial and space navigation systems. Many traders not directly involved in system analysis have heard about Kalman filtering and have expressed an interest in learning more about it for market applications. Although attempts have been made to provide simple, intuitive explanations, none has been completely successful. Almost without exception, descriptions have become mired in the jargon and state-space notation of the “cult”.
Surprisingly, in spite of the obscure-looking mathematics (the most impenetrable of which can be found in Dr. Kalman’s original paper), Kalman filtering is a fairly direct and simple concept. In the spirit of being pragmatic, we will not deal with the full-blown matrix equations in this description and we will be less than rigorous in the application to trading. Rigorous application requires knowledge of the probability distributions of the statistics. Nonetheless we end with practically useful results. We will depart from the classical approach by working backwards from Exponential Moving Averages. In this process, we introduce a way to create a nearly zero lag moving average. From there, we will use the concept of a Tracking Index that optimizes the filter tracking for the given uncertainty in price movement and the uncertainty in our ability to measure it."
Included:
-Standard deviation stepping filter, price is required to exceed XX deviations before the moving average line shifts direction
-Selection of filtering based on source price, the moving average, or both; you can also set the Filter deviations to 0 for no filtering at all
-Toggle on/off bar coloring
-Toggle on/off signals
-Long/Short alerts

STD Aadaptive, floating RSX Dynamic Momentum Index [Loxx]STD Aadaptive, floating RSX Dynamic Momentum Index is an attempt to improve Chande's original work on Dynamic Momentum Index. The full name of this indicator is "Standard-Deviation-Adaptive, floating-level, Dynamic Momentum Index on Jurik's RSX".
What Is Dynamic Momentum Index?
The dynamic momentum index is used in technical analysis to determine if a security is overbought or oversold. This indicator, developed by Tushar Chande and Stanley Kroll, is very similar to the relative strength index (RSI). The main difference between the two is that the RSI uses a fixed number of time periods (usually 14), while the dynamic momentum index uses different time periods as volatility changes, typically between five and 30.
What is RSX?
RSI is a very popular technical indicator, because it takes into consideration market speed, direction and trend uniformity. However, the its widely criticized drawback is its noisy (jittery) appearance. The Jurk RSX retains all the useful features of RSI, but with one important exception: the noise is gone with no added lag.
Differences
RSX is used instead of RSI for the calculation, producing a much smoother result
Standard deviation is used to adapt the RSX calculation
Floating levels are used instead of fixed levels for OB/OS
Included
-Change bar colors

Jurik Filter [Loxx]Jurik Filter is a Jurik-filtered moving average that acts as both a baseline and a support and resistance indicator
What is Jurik Volty used in the Juirk Filter?
One of the lesser known qualities of Juirk smoothing is that the Jurik smoothing process is adaptive. "Jurik Volty" (a sort of market volatility ) is what makes Jurik smoothing adaptive. The Jurik Volty calculation can be used as both a standalone indicator and to smooth other indicators that you wish to make adaptive.
What is the Jurik Moving Average?
Have you noticed how moving averages add some lag (delay) to your signals? ... especially when price gaps up or down in a big move, and you are waiting for your moving average to catch up? Wait no more! JMA eliminates this problem forever and gives you the best of both worlds: low lag and smooth lines.
Ideally, you would like a filtered signal to be both smooth and lag-free. Lag causes delays in your trades, and increasing lag in your indicators typically result in lower profits. In other words, late comers get what's left on the table after the feast has already begun.
Included
-Advanced filtering system using multiples of standard deviation, this filter acts paint dynamic support and resistance levels on the chart based on volatility
-Double Jurik filtering
-Toggle bar color on/off
DataCleanerLibrary "DataCleaner"
Functions for acquiring outlier levels and acquiring a cleaned version of a series.
outlierLevel(src, len, level) Gets the (standard deviation) outlier level for a given series.
Parameters:
src : The series to average and add a multiple of the standard deviation to.
len : The The number of bars to measure.
level : The positive or negative multiple of the standard deviation to apply to the average. A positive number will be the upper boundary and a negative number will be the lower boundary.
Returns: The average of the series plus the multiple of the standard deviation.
cleanUsing(src, result, len, maxDeviation) Returns an array representing the result series with (outliers provided by the source) removed.
Parameters:
src : The source series to read from.
result : The result series.
len : The maximum size of the resultant array.
maxDeviation : The positive or negative multiple of the standard deviation to apply to the average. A positive number will be the upper boundary and a negative number will be the lower boundary.
Returns: An array containing the cleaned series.
clean(src, len, maxDeviation) Returns an array representing the source series with outliers removed.
Parameters:
src : The source series to read from.
len : The maximum size of the resultant array.
maxDeviation : The positive or negative multiple of the standard deviation to apply to the average. A positive number will be the upper boundary and a negative number will be the lower boundary.
Returns: An array containing the cleaned series.
outlierLevelAdjusted(src, level, len, maxDeviation) Gets the (standard deviation) outlier level for a given series after a single pass of removing any outliers.
Parameters:
src : The series to average and add a multiple of the standard deviation to.
level : The positive or negative multiple of the standard deviation to apply to the average. A positive number will be the upper boundary and a negative number will be the lower boundary.
len : The The number of bars to measure.
maxDeviation : The optional standard deviation level to use when cleaning the series. The default is the value of the provided level.
Returns: The average of the series plus the multiple of the standard deviation.

Enlighten-TradeTechnical analysts use support and resistance levels to identify price points on a chart to find probabilities to trade a prevailing trend.
This indicator plots dynamic support and resistance based on price range (all time frames).
Indicator will plot S1, S2, S3, S4 - P - R1, R2, R3, R4 (S = Support, R = Resistance & P = Pivot )
Support breaks when a downtrend was started and price will go below the support level.
Resistance breaks when a uptrend was started and price will go above the support level.
Breakouts provide possible trading opportunities. A breakout to the upside signals traders to possible get long or cover short positions. A breakout to the downside signals traders to possibly get short or to sell long positions.
Breakouts can be subjective since not all traders will recognize or use support and resistance levels.
This indicator shows Dynamic Support & Resistance Levels.
