Orderblocks & BreakersThis indicator identifies potential orderblocks and breakers based on recent swing highs and lows. It is built to offer a structured, customizable, and noise-controlled view of how price interacts with supply and demand levels.
The script applies pivot-based swing detection to identify swing highs and lows.
Bullish Orderblocks: The script Identifies and stores the last down candle before a swing high is breached and confirms and plots the orderblock with a market structure break (close above the swing high).
Bearish Orderblocks: The script Identifies and stores the last up candle before a swing low is breached and confirms and plots the orderblock with a market structure break (close below the swing low).
When price later closes through an existing orderblock, it is reclassified as a Breaker and recolored accordingly. (all colors can be changed in the settings)
What Makes It Different
Unlike most orderblock tools that simply mark every swing-based block, this version introduces:
1. Chop Control – automatically hides breakers that price repeatedly closes through (2 closes after the orderblock becomes a breaker), keeping only relevant zones visible.
2. Recent Block Filtering – limits how many of the recent orderblocks or breakers are displayed, preventing chart clutter.
3. Dynamic Updating – orderblocks automatically convert to breakers when price closes beyond them, with clear color changes.
These features make it easier to study cleaner price structure without manually managing old or invalid zones. The optional Chop Control filter can reduce overlapping or repeatedly invalidated zones to keep the chart clearer.
Customizable Parameters
- Swing detection length (shorter means more aggressive pivot detection, longer means less aggressive so less highs/lows detected)
- Number of recent blocks to display
- Visibility toggles for orderblocks or breakers
- Color and transparency controls for each type
Alerts
Alerts can be set to trigger when price tests any defined zone.
Purpose
This indicator is designed as a price structure visualization and study tool.
It may assist in understanding how price interacts with previously active regions, but it does not produce signals or trade recommendations.
Smartmoneyconcepts

FOREXSOM Session Boxes (Local Time) — Asian, London & New YorkFOREXSOM Session Boxes (Local Time) highlights the three major Forex sessions — Asian, London, and New York — using your chart’s local timezone automatically.
This indicator helps traders visualize market structure, liquidity zones, and timing across global trading hours with accuracy and clarity.
Key Features
Automatically adjusts to your chart’s local timezone
Highlights Asian, London, and New York sessions with clean color zones
Works on all timeframes and asset classes
Ideal for Smart Money Concepts (SMC), ICT, and price action strategies
Helps identify range breakouts, session highs/lows, and liquidity grabs
How It Works
Each session box updates in real time to show the current range as the market develops.
The boxes reset at the end of each session, making it easy to compare volatility and liquidity shifts between regions.
Sessions (default times):
Asian: 17:00 – 03:00
London: 02:00 – 11:00
New York: 07:00 – 16:00
How to Use
Add the indicator to your chart.
Ensure your chart timezone matches your local time in chart settings.
Watch session ranges form and look for liquidity sweeps or breakouts between overlaps (London/New York).
Created by FOREXSOM
Empowering traders worldwide with precision-built tools for Smart Money and institutional trading education.

Market Structure ICT Screener [TradingFinder] BoS ChoCh🔵 Introduction
Market Structure is the foundation of every Smart Money and ICT based trading model. It describes how price moves through a sequence of highs and lows, forming clear phases of expansion, retracement and reversal. Understanding this structure allows traders to read institutional order flow and align their positions with the true direction of liquidity.
Two of the most critical components in Market Structure are the Break of Structure (BOS) and Change of Character (CHOCH). A BOS represents trend continuation, confirming strength within the current direction. In contrast, CHOCH also known as a Market Structure Shift (MSS) signals the first sign of a trend reversal or liquidity shift where order flow begins to change from bullish to bearish or vice versa.
Because the market is fractal, structure can exist at multiple levels known as Major (External) and Minor (Internal). Major structure defines the overall trend on higher timeframes while minor or internal structure reveals short term swings and early reversals within that larger move.
🔵 How to Use
Understanding Market Structure starts with identifying how price interacts with previous swing highs and swing lows. Every trend in the market, whether bullish or bearish, is built from a sequence of impulsive and corrective moves. Impulsive legs show strong displacement in the direction of liquidity flow, while corrective legs represent temporary pullbacks as the market rebalances before the next expansion. Recognizing these sequences is essential for reading the story of price and anticipating what may happen next.
A Break of Structure (BOS) occurs when price decisively moves beyond a previous structural point by breaking above the last high in an uptrend or falling below the last low in a downtrend. This event confirms that the current trend remains intact and that liquidity has been successfully taken from one side of the market. A BOS acts as confirmation of continuation and reflects strength within the existing directional bias.
A Change of Character (CHOCH) appears when price violates structure in the opposite direction of the prevailing trend. This is the first signal that market sentiment and order flow may be shifting. For example, during a downtrend if price breaks above a previous high, it indicates that sellers are losing control and a potential bullish reversal may be developing. In an uptrend, when price drops below a recent low, it suggests a possible bearish transition.
Because the market is fractal, structure exists across multiple layers. Major structure reflects the dominant movement visible on higher timeframes and defines the broader directional bias. Minor or internal structure represents smaller swings within that move and helps identify early transitions before they appear on the higher timeframe. When internal and external structures align, they offer a high probability signal for trend continuation or reversal.
By observing BOS and CHOCH across both internal and external structures, traders can clearly visualize when the market is expanding, contracting or preparing to shift direction. This structured understanding of price movement forms the foundation for precise trend analysis and high quality decision making in any Smart Money or ICT based trading approach.
🔵 Settings
🟣 Display Settings
Table on Chart : Allows users to choose the position of the signal dashboard either directly on the chart or below it, depending on their layout preference.
Number of Symbols : Enables users to control how many symbols are displayed in the screener table, from 10 to 20, adjustable in increments of 2 symbols for flexible screening depth.
Table Mode : This setting offers two layout styles for the signal table :
Basic : Mode displays symbols in a single column, using more vertical space.
Extended : Mode arranges symbols in pairs side-by-side, optimizing screen space with a more compact view.
Table Size : Lets you adjust the table’s visual size with options such as: auto, tiny, small, normal, large, huge.
Table Position : Sets the screen location of the table. Choose from 9 possible positions, combining vertical (top, middle, bottom) and horizontal (left, center, right) alignments.
🟣 Symbol Settings
Each of the 20 symbol slots comes with a full set of customizable parameters :
Symbol : Define or select the asset (e.g., XAUUSD, BTCUSD, EURUSD, etc.).
Timeframe : Set your desired timeframe for each symbol (e.g., 15, 60, 240, 1D).
Pivot Period : Set the length used to detect swing highs and lows. Shorter values increase sensitivity, longer ones focus on major structures.
🔵 Conclusion
Mastering Market Structure and understanding the relationship between BOS and CHOCH allows traders to see the market with greater clarity and confidence. These two elements reveal how liquidity moves through different phases of expansion and retracement and how institutional order flow shifts between accumulation and distribution.
By analyzing both internal and external structures, traders can align short term and long term perspectives and anticipate where price is most likely to react. The ability to read these structural shifts helps identify continuation points, reversals and areas where liquidity is engineered or collected.
Incorporating Market Structure into a consistent trading process transforms the way a trader views the chart. Instead of reacting to random movements, each swing, break and shift becomes part of a logical framework that reflects the true behavior of the market. Understanding BOS and CHOCH is not just a concept but a complete language of price that guides every professional decision in Smart Money and ICT based trading.

Market Structure Report Library [TradingFinder]🔵 Introduction
Market Structure is one of the most fundamental concepts in Price Action and Smart Money theory. In simple terms, it represents how price moves between highs and lows and reveals which phase of the market cycle we are currently in uptrend, downtrend, or transition.
Each structure in the market is formed by a combination of Breaks of Structure (BoS) and Changes of Character (CHoCH) :
BoS occurs when the market breaks a previous high or low, confirming the continuation of the current trend.
CHoCH occurs when price breaks in the opposite direction for the first time, signaling a potential trend reversal.
Since price movement is inherently fractal, market structure can be analyzed on two distinct levels :
Major / External Structure: represents the dominant macro trend.
Minor / Internal Structure: represents corrective or smaller-scale movements within the larger trend.
🔵 Library Purpose
The “Market Structure Report Library” is designed to automatically detect the current market structure type in real time.
Without drawing or displaying any visuals, it analyzes raw price data and returns a series of logical and textual outputs (Return Values) that describe the current structural state of the market.
It provides the following information :
Trend Type :
External Trend (Major): Up Trend, Down Trend, No Trend
Internal Trend (Minor): Up Trend, Down Trend, No Trend
Structure Type :
BoS : Confirms trend continuation
CHoCH : Indicates a potential trend reversal
Consecutive BoS Counter : Measures trend strength on both Major and Minor levels.
Candle Type : Returns the current candle’s condition(Bullish, Bearish, Doji)
This library is specifically designed for use in Smart Money–based screeners, indicators, and algorithmic strategies.
It can analyze multiple symbols and timeframes simultaneously and return the exact structure type (BoS or CHoCH) and trend direction for each.
🔵 Function Outputs
The function MS() processes the price data and returns seven key outputs,
each representing a distinct structural state of the market. These values can be used in indicators, strategies, or multi-symbol screeners.
🟣 ExternalTrend
Type : string
Description : Represents the direction of the Major (External) market structure.
Possible values :
Up Trend
Down Trend
No Trend
This is determined based on the behavior of Major Pivots (swing highs/lows).
🟣 InternalTrend
Type : string
Description : Represents the direction of the Minor (Internal) market structure.
Possible values :
Up Trend
Down Trend
No Trend
🟣 M_State
Type : string
Description : Specifies the type of the latest Major Structure event.
Possible values :
BoS
CHoCH
🟣 m_State
Type : string
Description : Specifies the type of the latest Minor Structure event.
Possible values :
BoS
CHoCH
🟣 MBoS_Counter
Type : integer
Description : Counts the number of consecutive structural breaks (BoS) in the Major structure.
Useful for evaluating trend strength :
Increasing count: indicates trend continuation.
Reset to zero: typically occurs after a CHoCH.
🟣 mBoS_Counter
Type : integer
Description : Counts the number of consecutive structural breaks in the Minor structure.
Helps analyze the micro structure of the market on lower timeframes.
Higher value : strong internal trend.
Reset : indicates a minor pullback or reversal.
🟣 Candle_Type
Type : string
Description : Represents the type of the current candle.
Possible values :
Bullish
Bearish
Doji
import TFlab/Market_Structure_Report_Library_TradingFinder/1 as MSS
PP = input.int (5 , 'Market Structure Pivot Period' , group = 'Symbol 1' )
= MSS.MS(PP)

MK_OSFT-Momentum Confluence DetectorMOMENTUM CONFLUENCE DETECTOR - Trading Indicator Overview
What This Indicator Does
The Momentum Confluence Detector is a comprehensive Pine Script indicator designed to identify high-probability trading opportunities by detecting momentum bars that align with multiple confluence factors. It combines traditional technical analysis with advanced Smart Money Concepts to filter out noise and highlight the most significant price movements.
CORE FUNCTIONALITY
📊 Momentum Bar Detection Identifies unusual volume and bar size expansion using customizable multipliers
Detects bullish, bearish, and neutral momentum bars based on OHLC relationships
Uses moving averages to establish baseline volume and bar size thresholds
🔄 Multi-Filter Confluence System
The indicator employs up to 5 different filter types to validate momentum signals:
Level Concept Filter - Choose between:
- Support/Resistance Levels : Traditional pivot-based S/R zones with touch counting and break tracking
- Smart Money Concepts : Institutional order flow analysis including Order Blocks, Fair Value Gaps (FVGs), and market structure breaks
Trend Filter : EMA/SMA-based trend direction confirmation with alignment requirements
Breakout Filter : Detects price breakouts beyond recent highs/lows with percentage thresholds
Volatility Filter : ATR expansion confirmation to ensure signals occur during active market conditions
Market Session Filter : Filters signals to specific trading sessions (Tokyo, London, New York)
ADVANCED FEATURES
🎯 Smart Money Concepts Integration
Order Blocks : Identifies institutional supply/demand zones from major and minor structure breaks
Fair Value Gaps (FVGs) : Detects price imbalances and tracks their evolution through partial fills and inversions
Market Structure : Recognizes Break of Structure (BOS) and Change of Character (CHoCH) patterns
Retracement Patterns : Tracks HLH (Higher-Low-Higher) and LHL (Lower-High-Lower) institutional patterns
📈 Support/Resistance System
Multi-timeframe pivot detection (3, 5, 7-bar spans)
Volume-weighted strength calculation for level importance
Dynamic level merging and break tracking
Automatic level type classification (Support/Resistance/Flip zones)
⚙️ Intelligent Filtering Logic
ALL Mode : Requires all enabled filters to pass (high precision)
ANY Mode : Requires at least one filter to pass (higher frequency)
Real-time filter status tracking and visualization
Visual Features
Signal Markers : Clear triangular markers for qualified momentum bars
Unfiltered Signals : Optional display of raw momentum bars for comparison
Level Visualization : Dynamic S/R level boxes and lines with strength indicators
Structure Lines : BOS/CHoCH break visualization with major/minor classification
Fair Value Gaps : Color-coded boxes showing bullish/bearish FVGs with partial fill tracking and IFVG conversion
Order Blocks : Institutional supply/demand zones displayed as colored boxes with major/minor classification
Information Table : Real-time display of signal details and filter status
Session Boxes : Visual representation of active trading sessions
Practical Applications
✅ Swing Trading : Identify high-probability reversal and continuation setups
✅ Day Trading : Spot intraday momentum shifts with institutional backing
✅ Multi-Timeframe Analysis : Combine major and minor structure analysis
✅ Risk Management : Filter out low-quality setups using confluence requirements
✅ Educational : Understand market structure and institutional order flow
Customization Options
Adjustable momentum thresholds for different market conditions
Comprehensive filter settings with individual enable/disable controls
Visual customization for colors, sizes, and display preferences
Alert system with detailed signal information
Performance optimization settings for different chart timeframes
Who Should Use This Indicator
This indicator is suitable for traders who:
Want to combine multiple technical analysis approaches
Seek to understand institutional market behavior
Prefer confluence-based trading setups
Need customizable filtering for different market conditions
Value comprehensive signal validation over high-frequency alerts
The Momentum Confluence Detector transforms complex market analysis into clear, actionable signals by requiring multiple forms of confirmation before highlighting trading opportunities.

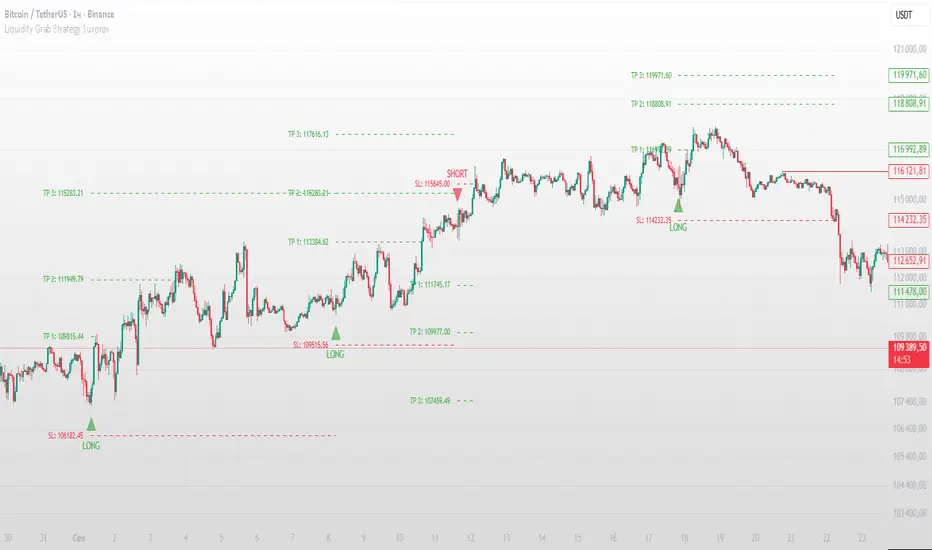
Liquidity Grab Strategy SuvorovLiquidity grab strategy
Description:
This indicator is built around the Liquidity Grab Strategy, which identifies and reacts to stop hunts and false breakouts at key swing highs and lows. It detects where liquidity is likely to be resting (e.g., above highs or below lows) and provides trade signals when that liquidity is taken and price begins to reverse.
Core Features:
Liquidity Detection: Automatically identifies and marks key swing highs and lows where stop-losses are likely to accumulate.
Entry Signals: Generates BUY/SELL signals after a liquidity sweep and a confirmed reversal — based on price action, volume, or structure shifts.
Stop Loss & Take Profit Zones: Visualizes stop-loss just beyond the liquidity wick and take-profit near the next major structure point, with configurable Risk/Reward ratios.
False Signal Filters: Optional filters based on volume spikes, RSI divergence, or market structure confirmation.
Multi-Timeframe Logic: Supports separate timeframes for structure detection and signal confirmation (e.g., structure on 1H, entry on 5m).
Smarter Money Concepts Dashboard [PhenLabs]📊Smarter Money Concepts Dashboard
Version: PineScript™v6
📌Description
The Smarter Money Concepts Dashboard is a comprehensive institutional trading analysis tool that combines six of our most powerful smarter money concepts indicators into one unified suite. This advanced system automatically detects and visualizes Fair Value Gaps, Inverted FVGs, Order Blocks, Wyckoff Springs/Upthrusts, Wick Rejection patterns, and ICT Market Structure analysis.
Built for serious traders who need institutional-grade market analysis, this dashboard eliminates subjective interpretation by automatically identifying where smart money is likely positioned. The integrated real-time dashboard provides instant status updates on all active patterns, making it easy to monitor market conditions at a glance.
🚀Points of Innovation
● Multi-Module Integration: Six different SMC concepts unified in one comprehensive system
● Real-Time Dashboard Display: Live tracking of all active patterns with customizable positioning
● Advanced Volume Filtering: Institutional volume confirmation across all pattern types
● Automated Pattern Management: Smart memory system prevents chart clutter while maintaining relevant zones
● Probability-Based Wyckoff Detection: Mathematical probability calculations for spring/upthrust patterns
● Dual FVG System: Both standard and inverted Fair Value Gap detection with equilibrium analysis
🔧Core Components
● Fair Value Gap Engine: Detects standard FVGs with volume confirmation and equilibrium line analysis
● Inverted FVG Module: Advanced IFVG detection using RVI momentum filtering for inversion confirmation
● Order Block System: Institutional order block identification with customizable mitigation methods
● Wyckoff Pattern Recognition: Automated spring and upthrust detection with probability scoring
● Wick Rejection Analysis: High-probability reversal patterns based on wick-to-body ratios
● ICT Market Structure: Simplified institutional concepts with commitment tracking
🔥Key Features
● Comprehensive Pattern Detection: All major SMC concepts in one indicator with automatic identification
● Volume-Confirmed Signals: Multiple volume filters ensure only institutional-grade patterns are highlighted
● Interactive Dashboard: Real-time status display with active pattern counts and module status
● Smart Memory Management: Automatic cleanup of old patterns while preserving relevant market zones
● Full Alert System: Complete notification coverage for all pattern types and signal generations
● Customizable Display Options: Adjustable colors, transparency, and positioning for all visual elements
🎨Visualization
● Color-Coded Zones: Distinct color schemes for bullish/bearish patterns across all modules
● Dynamic Box Extensions: Automatically extending zones until mitigation or invalidation
● Equilibrium Lines: Fair Value Gap midpoint analysis with dotted line visualization
● Signal Markers: Clear spring/upthrust signals with directional arrows and probability indicators
● Dashboard Table: Professional-grade status panel with module activation and pattern counts
● Candle Coloring: Wick rejection highlighting with transparency-based visual emphasis
📖Usage Guidelines
Fair Value Gap Settings
● Days to Analyze: Default 15, Range 1-100 - Controls historical FVG detection period
● Volume Filter: Enables institutional volume confirmation for gap validity
● Min Volume Ratio: Default 1.5 - Minimum volume spike required for gap recognition
● Show Equilibrium Lines: Displays FVG midpoint analysis for precise entry targeting
Order Block Configuration
● Scan Range: Default 25 bars - Lookback period for structure break identification
● Volume Filter: Institutional volume confirmation for order block validation
● Mitigation Method: Wick or Close-based invalidation for different trading styles
● Min Volume Ratio: Default 1.5 - Volume threshold for significant order block formation
Wyckoff Analysis Parameters
● S/R Lookback: Default 20 - Support/resistance calculation period for spring/upthrust detection
● Volume Spike Multiplier: Default 1.5 - Required volume increase for pattern confirmation
● Probability Threshold: Default 0.7 - Minimum probability score for signal generation
● ATR Recovery Period: Default 5 - Price recovery calculation for pattern strength assessment
Market Structure Settings
● Auto-Detect Zones: Automatic identification of high-volume thin zones
● Proximity Threshold: Default 0.20% - Price proximity requirements for zone interaction
● Test Window: Default 20 bars - Time period for zone commitment calculation
Display Customization
● Dashboard Position: Four corner options for optimal chart layout
● Text Size: Scalable from Tiny to Large for different screen configurations
● Pattern Colors: Full customization of all bullish and bearish zone colors
✅Best Use Cases
● Swing Trading: Identify major institutional zones for multi-day position entries
● Day Trading: Precise intraday entries at Fair Value Gaps and Order Block boundaries
● Trend Analysis: Market structure confirmation for directional bias establishment
● Risk Management: Clear invalidation levels provided by all pattern boundaries
● Multi-Timeframe Analysis: Works across all timeframes from 1-minute to monthly charts
⚠️Limitations
● Market Condition Dependency: Performance varies between trending and ranging market environments
● Volume Data Requirements: Requires accurate volume data for optimal pattern confirmation
● Lagging Nature: Some patterns confirmed after initial price movement has begun
● Pattern Density: High-volatility markets may generate excessive pattern signals
● Educational Tool: Requires understanding of smart money concepts for effective application
💡What Makes This Unique
● Complete SMC Integration: First indicator to combine all major smart money concepts comprehensively
● Real-Time Dashboard: Instant visual feedback on all active institutional patterns
● Advanced Volume Analysis: Multi-layered volume confirmation across all detection modules
● Probability-Based Signals: Mathematical approach to Wyckoff pattern recognition accuracy
● Professional Memory Management: Sophisticated pattern cleanup without losing market relevance
🔬How It Works
1. Pattern Detection Phase:
● Multi-timeframe scanning for institutional footprints across all enabled modules
● Volume analysis integration confirms patterns meet institutional trading criteria
● Real-time pattern validation ensures only high-probability setups are displayed
2. Signal Generation Process:
● Automated zone creation with precise boundary definitions for each pattern type
● Dynamic extension system maintains relevance until mitigation or invalidation occurs
● Alert system activation provides immediate notification of new pattern formations
3. Dashboard Update Cycle:
● Live status monitoring tracks all active patterns and module states continuously
● Pattern count updates provide instant feedback on current market condition density
● Commitment tracking for market structure analysis shows institutional engagement levels
💡Note:
This indicator represents institutional trading concepts and should be used as part of a comprehensive trading strategy. Pattern recognition accuracy improves with understanding of smart money principles. Combine with proper risk management and multiple confirmation methods for optimal results.

FlowScope [Hapharmonic]FlowScope: Uncover the Market's True Intent 🔬
Ever wished you could look inside the candles and see where the real action is happening? FlowScope is your microscope for the market's flow, designed to give you a powerful edge by revealing the volume distribution that price action alone can't show you.
Instead of just looking at the open, high, low, and close, FlowScope lets you dive deeper into the market's auction process. It groups candles together and builds a detailed Volume Profile for that period, showing you exactly where the trading happened and revealing the story behind the price action.
Let's explore how you can use it to gain a powerful new edge.
🧐 Core Concept: How It Works
At its heart, FlowScope does three key things:
It Groups Candles: You decide how many candles to group together. For example, setting " Group Candles " to 4 on a 5-minute chart effectively gives you a detailed 20-minute candle and profile. This helps you see the bigger picture and filter out market noise.
It Builds a Volume Profile: For each group, FlowScope analyzes the volume at every single price level. It then displays this as a horizontal histogram (we call this a "footprint" or profile). Longer bars mean more volume was traded at that price, indicating a "fair" price or an area of acceptance. Shorter bars mean price moved through quickly, indicating rejection.
It Creates a Custom "Grouped Candle": To summarize the group's overall price action, FlowScope draws a single, custom candle representing the entire group's:
Open: The open of the first candle in the group.
High: The absolute highest price reached within the group.
Low: The absolute lowest price reached within the group.
Close: The close of the last candle in the group.
This gives you a crystal-clear view of the group's net result, free from the back-and-forth noise of the individual candles inside it.
Below are some of the stunning preset color palettes you can choose from to customize your view:
🚀 How to Use: Practical Applications
FlowScope isn't just for looking pretty; it's a powerful analysis tool. Here are a few ways to integrate it into your trading:
Identify High-Volume Nodes (HVNs): Look for the longest bars in the profile. These are price levels where the market spent the most time and traded the most volume. HVNs often act as powerful "magnets" for price, becoming key areas of support and resistance.
Spot Low-Volume Nodes (LVNs): These are areas with very short bars or gaps in the profile. They represent price levels that the market moved through quickly and inefficiently. If price returns to an LVN, it's likely to move through it quickly again.
Analyze the Summary Box: This is where the real magic happens! ✨
Total Volume (Σ): The total volume for the entire group.
Buy (B) vs. Sell (S) Volume: FlowScope analyzes the lower timeframe action to estimate the buying and selling pressure that made up the total volume. Is a big red candle mostly aggressive selling, or was it just a lack of buyers? The B/S data gives you clues. A high-volume candle with nearly 50/50 buy/sell pressure might indicate absorption or a potential reversal.
Use the Grouped Candle for Clarity: Is the market in a clear uptrend, or is it just choppy? The grouped candle can give you a much clearer signal. A series of strong, green grouped candles shows much more conviction than a mix of small green and red candles.
⚙️ Settings & Customization
This is where you can truly make FlowScope your own. Let's walk through each setting.
Profile Settings
Group Candles: The number of standard chart candles you want to combine into a single FlowScope profile. A setting of 1 will analyze every single bar. A higher number gives you a broader market view. When Group Candles is set to 5, the data from the 5 individual candles are combined, and the volume is calculated accordingly.
Max Profile Boxes: This setting is more than just a number; it's a smart limit that ensures your profiles are always readable and relevant to the current market conditions.
Adaptive Sizing (The Ideal Goal): FlowScope first tries to create the perfect profile by making each volume box's height proportional to the current market volatility. It calculates an "ideal" box height based on the Average True Range ( ATR / 10 ). This is powerful because it automatically adapts: you get smaller, more detailed boxes in quiet, low-volatility markets, and larger, clearer boxes in volatile, fast-moving markets.
The Safety Cap (Your Setting): However, what if you group several candles during a massive price move? The price range could be huge! If we only used the small, ATR-based box height, you might end up with hundreds of tiny, unreadable boxes. This is where your Max Profile Boxes setting (defaulting to 50) comes in. It acts as a maximum detail cap . If the adaptive, volatility-based calculation determines that it would need more boxes than your setting (e.g., more than 50), the indicator will override it. It will then simply divide the entire price range of the group into exactly the number of boxes you specified (e.g., 50).
In short: You are setting the maximum allowable detail. FlowScope intelligently adapts the profile's granularity below that limit based on market volatility, ensuring you always get a clear and meaningful picture.
Style
Show Profile BG: A simple toggle to show or hide the faint background color behind the volume bars. Turning it off can create a cleaner look.
Color Mode: This dropdown controls how the volume profile text is colored.
Custom Gradient: This mode uses the three custom colors you select in the "Profile Colors" section to create a beautiful gradient across the profile.
Candle Color: This mode colors the profile based on whether the grouped candle was bullish (green) or bearish (red). The color will be a gradient, with the most intense color applied to the box with the highest volume; the colors of the other boxes will fade out from that point. It's a great way to see the profile's "mood" at a glance.
Profile Colors 🎨
Use Preset Palette: This is the master switch!
If checked: You can choose from 10 stunning, pre-designed color palettes from the Palette dropdown. The custom color pickers below will be disabled.
If unchecked (Default): The Palette dropdown will be disabled, and you can now choose your own three colors for the gradient.
Palette: (Only active when "Use Preset Palette" is checked) . Choose from 10 luxurious, eye-catching color schemes like "Solar Flare" or "Deep Space" to instantly change the look and feel of your chart.
Low Price / Mid Price / High Price: (Only active when "Use Preset Palette" is unchecked) . These three color pickers allow you to design your own unique gradient for the Custom Gradient color mode.
Candle Display
These settings control the custom "Grouped Candle" that summarizes the profile. When using the "Show Custom Candle" feature, you should change the chart's candlestick display to Bars for a cleaner view.
Show Custom Candle: This is the main toggle. When you check this box, the original chart candles will be hidden, and your custom FlowScope candle will be displayed instead. This custom candle is intentionally small to ensure it does not visually overlap with the volume profile boxes.
Show Body: (Only active when "Show Custom Candle" is checked) . Toggles the visibility of the candle's body.
Wick Width & Body Width: (Only active when "Show Custom Candle" is checked) . These sliders let you control the thickness of the wick and body lines to match your personal style.
Up Color / Down Color: (Only active when "Show Custom Candle" is checked) . Choose the colors for your bullish and bearish custom candles.
Experiment with the settings, find a style that works for you, and start seeing the market in a whole new light.
Happy trading! 📈😊

Unfilled ImbalancesUNFILLED IMBALANCES TRACKER - IDENTIFY HIGH-PROBABILITY REVERSAL ZONES
This advanced indicator automatically detects and tracks unfilled price imbalances (Fair Value Gaps/FVGs) between candle bodies, providing traders with crucial levels where price is likely to return.
METHODOLOGY
This indicator employs an approach to imbalance detection that differs from standard FVG indicators:
1. Body-to-Body Gap Detection: Unlike typical FVG indicators that use wicks, this system exclusively tracks gaps between candle bodies, filtering out noise and focusing on the most significant price inefficiencies.
2. Dynamic Partial Fill Tracking: Our unique algorithm continuously monitors and adjusts imbalance zones as they're partially filled, showing exactly how much of each gap remains unfilled in real-time. This feature helps traders identify the strongest remaining levels.
3. Dual Fill Detection Logic: Proprietary fill detection offers two distinct modes - Distal (gap filled when touched) and Through (requires complete price movement through the entire gap), allowing adaptation to different market behaviors.
KEY FEATURES
Real-Time Imbalance Detection
Identifies body-to-body gaps between consecutive candles
Tracks both bullish and bearish imbalances
Automatically removes filled imbalances from the chart
Advanced Fill Detection Modes
Distal Mode: Imbalance considered filled when price touches the near edge
Through Mode: Requires price to completely trade through the gap
Body Fill Option: Requires candle body (not just wick) to enter the gap zone
Partial Fill Visualization
Watch imbalances shrink in real-time as price partially fills them
Visual representation shows exact percentage of gap remaining
Critical for position sizing and risk management
Flexible Display Options
Full Box Mode: Shows complete imbalance zones
Line Mode: Displays only critical edge levels for cleaner charts
Customizable visual parameters (colors, transparency, line thickness)
Smart Extension Features
Auto-extends visual elements to current price bar
Optional extension into future (0-500 bars)
Statistics table showing active imbalances count and fill rates
TRADING METHODOLOGY
Unfilled imbalances represent areas where price moved too quickly, leaving behind inefficiencies that markets tend to revisit. This indicator helps identify:
High-probability entry zones for trend continuation trades
Logical take profit targets at unfilled gaps
Stop loss placement beyond strong imbalance zones
Market structure breaks when key imbalances are filled
Supply and demand zone identification
HOW TO USE
Apply the indicator to any timeframe (works best on 15m and above)
Configure fill detection mode based on your trading style
Watch for price approaching unfilled imbalance zones
Use partial fill information to gauge zone strength
Combine with your existing strategy for confirmation
TARGET AUDIENCE & BEST PRACTICES
This tool is designed for traders who understand price action and market structure. It works best on:
Liquid instruments with consistent volume
Trending markets where imbalances are more likely to be revisited
Higher timeframes for more reliable signals
LIMITATIONS & CONSIDERATIONS
Imbalances may not always be filled, especially in strong trending markets
Performance varies across different market conditions and instruments
Should be used in conjunction with other analysis methods, not as a standalone system
Gap detection is based on candle closes and may miss intrabar movements
Historical imbalances from many bars ago may lose relevance
SETTINGS EXPLANATION
The indicator includes multiple customization options:
Require Body Fill: Controls whether wicks or bodies must enter gaps
Fill Detection Mode: Choose between Distal or Through modes
Visual Display: Select between boxes or lines
Alert Configuration: Set minimum age before fill alerts trigger
Debug Mode: Learn how the algorithm works with visual feedback
This indicator represents months of research into price inefficiency patterns and provides a systematic approach to identifying and tracking these critical market levels.
Note: Works on all timeframes and markets. Best results on liquid instruments with consistent volume patterns.

Smarter Money Concepts - Wyckoff Springs & Upthrusts [PhenLabs]📊Smarter Money Concepts - Wyckoff Springs & Upthrusts
Version: PineScript™v6
📌Description
Discover institutional manipulation in real-time with this advanced Wyckoff indicator that detects Springs (accumulation phases) and Upthrusts (distribution phases). It identifies when price tests support or resistance on high volume, followed by a strong recovery, signaling potential reversals where smart money accumulates or distributes positions. This tool solves the common problem of missing these subtle phase transitions, helping traders anticipate trend changes and avoid traps in volatile markets.
By combining volume spike detection, ATR-normalized recovery strength, and a sigmoid probability model, it filters out weak signals and highlights only high-confidence setups. Whether you’re swing trading or day trading, this indicator provides clear visual cues to align with institutional flows, improving entry timing and risk management.
🚀Points of Innovation
Sigmoid-based probability threshold for signal filtering, ensuring only statistically significant Wyckoff patterns trigger alerts
ATR-normalized recovery measurement that adapts to market volatility, unlike static recovery checks in traditional indicators
Customizable volume spike multiplier to distinguish institutional volume from retail noise
Integrated dashboard legend with position and size options for personalized chart visualization
Hidden probability plots for advanced users to analyze underlying math without chart clutter
🔧Core Components
Support/Resistance Calculator: Scans a user-defined lookback period to establish dynamic levels for Spring and Upthrust detection
Volume Spike Detector: Compares current volume to a 10-period SMA, multiplied by a configurable factor to identify significant surges
Recovery Strength Analyzer: Uses ATR to measure price recovery after breaks, normalizing for different market conditions
Probability Model: Applies sigmoid function to combine volume and recovery data, generating a confidence score for each potential signal
🔥Key Features
Spring Detection: Spots accumulation when price dips below support but recovers strongly, helping traders enter longs at potential bottoms
Upthrust Detection: Identifies distribution when price spikes above resistance but falls back, alerting to possible short opportunities at tops
Customizable Inputs: Adjust lookback, volume multiplier, ATR period, and probability threshold to match your trading style and market
Visual Signals: Clear + (green) and - (red) labels on charts for instant recognition of accumulation and distribution phases
Alert System: Triggers notifications for signals and probability thresholds, keeping you informed without constant monitoring
🎨Visualization
Spring Signal: Green upward label (+) below the bar, indicating strong recovery after support break for accumulation
Upthrust Signal: Red downward label (-) above the bar, showing failed breakout above resistance for distribution
Dashboard Legend: Customizable table explaining signals, positioned anywhere on the chart for quick reference
📖Usage Guidelines
Core Settings
Support/Resistance Lookback
Default: 20
Range: 5-50
Description: Sets bars back for S/R levels; lower for recent sensitivity, higher for stable long-term zones – ideal for spotting Wyckoff phases
Volume Spike Multiplier
Default: 1.5
Range: 1.0-3.0
Description: Multiplies 10-period volume SMA; higher values filter to significant spikes, confirming institutional involvement in patterns
ATR for Recovery Measurement
Default: 5
Range: 2-20
Description: ATR period for recovery strength; shorter for volatile markets, longer for smoother analysis of post-break recoveries
Phase Transition Probability Threshold
Default: 0.9
Range: 0.5-0.99
Description: Minimum sigmoid probability for signals; higher for strict filtering, ensuring only high-confidence Wyckoff setups
Display Settings
Dashboard Position
Default: Top Right
Range: Various positions
Description: Places legend table on chart; choose based on layout to avoid overlapping price action
Dashboard Text Size
Default: Normal
Range: Auto to Huge
Description: Adjusts legend text; larger for visibility, smaller for minimal space use
✅Best Use Cases
Swing Trading: Identify Springs for long entries in downtrends turning to accumulation
Day Trading: Catch Upthrusts for short scalps during intraday distribution at resistance
Trend Reversal Confirmation: Use in conjunction with other indicators to validate phase shifts in ranging markets
Volatility Plays: Spot signals in high-volume environments like news events for quick reversals
⚠️Limitations
May produce false signals in low-volume or sideways markets where volume spikes are unreliable
Depends on historical data, so performance varies in unprecedented market conditions or gaps
Probability model is statistical, not predictive, and cannot account for external factors like news
💡What Makes This Unique
Probability-Driven Filtering: Sigmoid model combines multiple factors for superior signal quality over basic Wyckoff detectors
Adaptive Recovery: ATR normalization ensures reliability across assets and timeframes, unlike fixed-threshold tools
User-Centric Design: Tooltips, customizable dashboard, and alerts make it accessible yet powerful for all trader levels
🔬How It Works
Calculate S/R Levels:
Uses the highest high and the lowest low over the lookback period to set dynamic zones
Establishes baseline for detecting breaks in Wyckoff patterns
Detect Breaks and Recovery:
Checks for price breaking support/resistance, then recovering on volume
Measures recovery strength via ATR for volatility adjustment
Apply Probability Model:
Combines volume spike and recovery into a sigmoid function for confidence score
Triggers signal only if above threshold, plotting visuals and alerts
💡Note:
For optimal results, combine with price action analysis and test settings on historical charts. Remember, Wyckoff patterns are most effective in trending markets – use lower probability thresholds for practice, then increase for live trading to focus on high-quality setups.

Volume Rotor Clock [hapharmonic]🕰️ Volume Rotor Clock
The Volume Rotor Clock is an indicator that separates buy and sell volume, compiling these volumes over a recent number of bars or a specified past period, as defined by the user. This helps to reveal accumulation (buying) or distribution (selling) behavior, showing which side has superior volume. With its unique and beautiful display, the Volume Rotor Clock is more than just a timepiece; it's a dynamic dashboard that visualizes the buying and selling pressure of your favorite symbols, all wrapped in an elegant and fully customizable interface.
Instead of just tracking price, this indicator focuses on the engine behind the movement: volume. It helps you instantly identify which assets are under accumulation (buying) and which are under distribution (selling).
---
🎨 20 Pre-configured Templates
---
🧐 Interpreting the Clock Display
The interface is designed to give you multiple layers of information at a glance. Let's break down what each part represents.
1. The Main Clock Hands (Current Chart Symbol)
The clock hands—hour, minute, and second—are dedicated to the symbol on your current active chart .
Minute Hand: Displays the base currency of the current symbol (e.g., USDT, USD) at its tip.
Hour Hand: Displays the percentage of the winning volume side (buy vs. sell) at its tip.
Color Gauge: The color of the text characters at the tip of both the hour and minute hands acts as your primary volume gauge for the current symbol.
If buy volume is dominant , the text will be green .
If sell volume is dominant , the text will be red .
Tooltip: Hovering your mouse over the text at the tip of the hour or minute or other spherical elements hand will reveal a detailed tooltip with the precise Buy Volume, Sell Volume, Total Volume, Buy %, and Sell % for the current chart's symbol.
2. The Volume Scanner: Bulls & Bears (Symbols Inside the Clock) 🐂🐻
The circular symbols scattered inside the clock face are your multi-symbol volume scanner. They represent the assets you've selected in the indicator's settings.
Green Circles (Bulls - Upper Half): These represent symbols from your list where the total buy volume is greater than the total sell volume over the defined "Lookback" period. They are considered to be under bullish accumulation. The size of the circle and its text grows larger as the buy percentage becomes more dominant. The percentage shown within the circle represents the buy volume's share of the total volume, calculated over the 'Lookback (Bars)' you've set.
Red Circles (Bears - Lower Half): These represent symbols where the total sell volume is greater than the total buy volume. They are considered to be under bearish distribution or selling pressure. The size of the circle indicates the dominance of the sell-side volume. The percentage shown within the circle represents the sell volume's share of the total volume, calculated over the 'Lookback (Bars)' you've set.
3. The Bullish Watchlist (Symbols Above the Clock) ⭐
The symbols arranged neatly along the top edge of the clock are the "best of the bulls." They are symbols that are not only bullish but have also passed an additional, powerful strength filter.
What it Means: A symbol appears here when it shows signs of sustained, high-volume buying interest . It's a way to filter out noise and focus on assets with potentially significant accumulation phases.
The Filter Logic: For a bullish symbol (where total buy volume > total sell volume) to be promoted to the watchlist, its trading volume must meet specific criteria based on this formula:
ta.barssince(not(volume > ta.sma(volume, X))) >= Y
In plain English, this means: The indicator checks how many consecutive bars the `volume` has been greater than its `X`-bar Simple Moving Average (`ta.sma(volume, X)`). If this count is greater than or equal to `Y` bars, the condition is met.
(You can configure `X` (Volume MA Length) and `Y` (Consecutive Days Above MA) in the settings.)
Why it's Useful: This filter is powerful because it looks for consistency . A single spike in volume can be an anomaly. However, when an asset's volume remains consistently above its recent average for several consecutive days, it strongly suggests that larger players or a significant portion of the market are actively accumulating the asset. This sustained interest can often precede a significant upward price trend.
---
⚙️ Indicator Settings Explained
The Volume Rotor Clock is highly customizable. Here’s a detailed walkthrough of every setting available in the "Inputs" tab.
🎨 Color Scheme
This group allows you to control the entire aesthetic of the clock.
Template: Choose from a wide variety of professionally designed color themes.
Use Template: A simple checkbox to switch between using a pre-designed theme and creating your own.
`Checked`: You can select a theme from the dropdown menu, which offers 20 unique templates like "Cyberpunk Neon" or "Forest Green". All custom color settings below will be disabled (grayed out and unclickable).
`Unchecked`: The template dropdown is disabled, and you gain full control over every color element in the sections below.
🖌️ Custom Appearance & Colors
These settings are only active when "Use Template" is unchecked.
Flame Head / Tail: Sets the start and end colors for the dynamic flame effect that traces the clock's border, representing the second hand.
Numbers / Main Numbers: Customize the color of the regular hour numbers (1, 2, 4, 5...) and the main cardinal numbers (3, 6, 9, 12).
Sunburst Colors (1-6): Controls the six colors used in the gradient background for the "sunburst" effect inside the clock face.
Hands & Digital: Fine-tune the colors for the Hour/Minute Hand, Second Hand, central Pivot point, and the digital time display.
Chain Color / Width: Customize the appearance of the two chains holding the clock.
📡 Volume Scanner
Control the behavior of the multi-symbol scanner.
Show Scanner Labels: A master switch to show or hide all the bull/bear symbol circles inside the clock.
Lookback (Bars): A crucial setting that defines the calculation period for buy/sell volume for all scanned symbols. The calculation is a sum over the specified number of recent bars.
`0`: Calculates using the current bar only .
`7`: Calculates the sum of volume over the last 8 bars (the current bar + 7 historical bars).
Symbols List: Here you can enable/disable up to 20 slots and input the ticker for each symbol you want to scan (e.g., BINANCE:BTCUSDT , NASDAQ:AAPL ).
⭐ Bullish Watchlist Filter
Configure the criteria for the elite watchlist symbols displayed above the clock.
Enable Watchlist: A master switch to turn the entire watchlist feature on or off.
Volume MA Length: Sets the lookback period `(X)` for the Simple Moving Average of volume used in the filter.
Consecutive Days Above MA: Sets the minimum number of consecutive days `(Y)` that volume must close above its MA to qualify.
Symbols Per Row: Determines the maximum number of watchlist symbols that can fit in a single row before a new row is created above it.
Background / Text Color: When not using a template, you can set custom colors for the watchlist symbols' background and text.
📏 Position & Size
Adjust the clock's placement and dimensions on your chart.
Clock Timezone: Sets the timezone for the digital and analog time display. You can use standard formats like "America/New_York" or enter "Exchange" to sync with the chart's timezone.
Radius (Bars): Controls the overall size of the clock. The radius is measured in terms of the number of bars on the x-axis.
X Offset (Bars): Moves the entire clock horizontally. Positive values shift it to the right; negative values shift it to the left.
Y Offset (Price %): Moves the entire clock vertically as a percentage of your screen's price pane. Positive values move it up; negative values move it down.

Watermark [TakingProphets] Watermark
A fully customizable watermark & chart info panel to keep your charts branded, organized, and informative — without clutter.
Special thanks to for inspiring the original concept that led to this expanded version.
📌 Overview
Perfect for:
Traders who stream, record, or share charts
Keeping essential info (symbol, TF, date, price) visible
Intraday traders who want day-of-week labels without messy vertical lines
✨ Key Features
1. Personal Watermark
Custom text, colors, size, opacity
Position anywhere: Top, Middle, Bottom × Left, Center, Right
Alignment options: left, center, right
Optional border with adjustable color or hide completely
2. Chart Info Panel
Show any combination of:
Custom text
Symbol
Timeframe (auto-formatted)
Date (MM-DD-YYYY)
Last price
Day of the week
Position independently from watermark
Adjustable background opacity
3. Day-of-Week Labels
Labels Sunday → Saturday at session start or midday
Works on intraday ≤ 15m timeframes
Option to hide weekends
Place labels Top or Bottom
⚙️ How to Use
Enable Watermark → Personal Watermark Settings → Toggle Show Watermark, enter your text, style it.
Set Up Info Panel → Chart Information Panel → Select details, choose position, adjust style.
Add Day Labels → Day of Week Labels Settings → Turn on for intraday charts.
💡 Tips
Lower background opacity for a subtle look.
Use bright colors for streaming so your brand stands out.
Hide unused features to keep charts clean & fast.
🙏 Acknowledgments
This script’s concept was inspired by toodegrees.
Developed by TakingProphets — tools for traders who value clarity, precision, and style.
⚠️ Disclaimer:
This script is for informational purposes only. It is not financial advice. Always trade responsibly and manage your risk.

SMC Pro - Smart Money Concepts🎯 SMC Pro - Complete Smart Money Concepts Trading System with Trade Alerts
The Most Comprehensive SMC/ICT Indicator Built for Real Traders
After extensive research into what retail and prop firm traders actually need, I've created SMC Pro - a complete Smart Money Concepts indicator that solves the biggest problems with existing SMC tools.
🚀 What Makes This Different:
✅ COMPLETE TRADE SETUP ALERTS - Not just structure breaks! Get full trade setups with:
* Entry, Stop Loss & Target Prices
* Risk/Reward Calculations
* 5-Point Confluence Scoring
* Visual Trade Labels on Chart
✅ INTELLIGENT FILTERING - No more chart spam:
* Minimum structure size filter (ATR-based)
* Minimum bars between signals
* Volume confirmation for order blocks
* Clean, actionable signals only
📊 Core Features:
1. Market Structure Analysis
* Break of Structure (BOS) with smart filtering
* Change of Character (CHoCH) detection
* Clear directional bias identification
* Prevents excessive signal clustering
2. Order Blocks
* Volume-confirmed institutional zones
* Automatic mitigation tracking
* Entry points for trade setups
3. Fair Value Gaps
* ATR-based size filtering
* Automatic fill detection
* Confluence factor for trades
4. Liquidity Zones
* Buy-side & Sell-side liquidity mapping
* Sweep detection with alerts
* Target zones for trades
5. Risk Management Integration
* Automatic R:R calculation
* Position sizing guidance
* Minimum R:R filtering (default 2:1)
🎯 5-Point Trade Confluence System:
1. Market structure alignment
2. Recent structure break (BOS/CHoCH)
3. Order block at current price
4. Fair value gap support
5. Liquidity target available
Minimum score of 3/5 required for trade alerts (adjustable)
⚙️ Smart Settings:
* Swing Length: 10 (default) - adjust for sensitivity
* Min Bars Between Signals: 20 - prevents clustering
* Min Structure Size: 1.0 ATR - filters noise
* Min Confluence Score: 3/5 - quality control
* Target R:R: 2:1 minimum - proper risk management
📱 Alert Types:
* 🎯 Trade Setup Alerts - Complete entry/exit plans
* ✅ Structure Breaks - BOS & CHoCH notifications
* 📊 Order Block Touch - Price at key zones
* 💧 Liquidity Sweeps - Stop hunts detected
💡 Pro Tips:
* Start with default settings
* Use on 15m+ timeframes for cleaner signals
* Increase confluence requirement for prop firm trading
* Enable volume confirmation for higher quality OBs
* Dashboard shows real-time setup status
🔧 If You Get Too Many Signals:
* Increase Swing Length to 15-20
* Increase Min Bars Between to 30-50
* Increase Min Structure Size to 1.5 ATR
* Raise Min Confluence Score to 4 or 5
This indicator is the result of solving real problems traders face with SMC/ICT concepts. It's designed to give you clean, actionable trade setups - not just mark up your chart with zones.
Built with Pine Script v6 for maximum performance and reliability.
Trade with confluence. Trade with confidence. Trade smart. 🎯

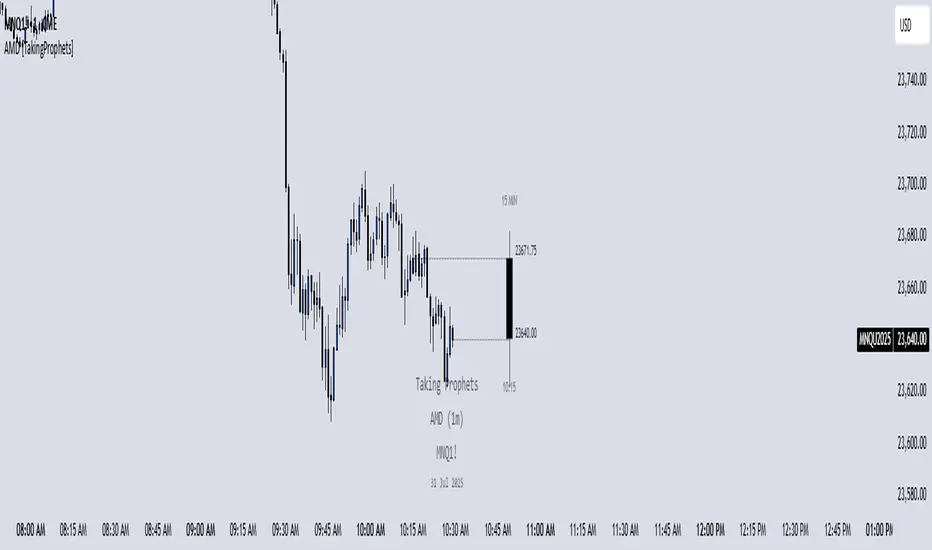
AMD [TakingProphets]Accumulation Manipulation Distribution – Real-Time HTF Candle Projection for ICT/SMC Traders
Accumulation Manipulation Distribution (AMD) is a premium, real-time indicator designed for traders who use ICT and Smart Money Concepts (SMC). It projects higher timeframe (HTF) candles directly onto your lower timeframe chart, allowing you to monitor institutional price behavior without switching timeframes.
By continuously tracking the open, high, low, and close (OHLC) of active HTF candles, AMD helps traders interpret whether the market is in a phase of accumulation, manipulation, or distribution—a key concept for understanding institutional order flow.
Core Features and How It Works
1. Live HTF Candle Visualization
Displays complete HTF candles — including body and wicks — in real time.
Provides immediate higher timeframe context for lower timeframe execution.
Supports any timeframe from 1 minute to monthly.
2. Real-Time OHLC Projections
Projects the open, high, low, and current close of the active HTF candle as it develops.
Acts as evolving reference points for support, resistance, and directional bias.
Fully customizable with adjustable colors, line styles, and labels.
3. Session Timing and Labeling
Optional time labels mark candle openings and help anticipate session closes.
Supports 12-hour and 24-hour formatting for flexibility across markets.
4. Complete Visual Customization
Configure candle width, wick transparency, border color, and projection lines.
Maintain a clean, professional overlay that aligns with your preferred charting style.
How to Use AMD
Determine HTF Bias: Identify whether the active candle is expanding in your trade direction or showing signs of rejection.
Track Price Reaction: Monitor how price interacts with projected HTF highs, lows, and midpoints—especially during ICT killzones or after liquidity events.
Anchor Lower Timeframe Entries: Combine AMD with tools like Order Blocks, Liquidity Levels, or Rejection Blocks to confirm high-probability Smart Money setups.
This approach allows traders to synchronize LTF executions with HTF market structure, enhancing clarity and confidence in trade selection.
Smart Money Trap Scanner [TradingFinder]🔵 Introduction
In many market conditions, what initially seems to be a decisive breakout often turns out to be nothing more than a false breakout or fake move. Price breaks through a significant structural level, such as a swing high or low or a key support and resistance zone, only to quickly return to its previous range. These moves, often driven by liquidity traps or market manipulation, typically signal structural weakness rather than the start of a new trend.
This screener is specifically designed to detect such situations. It focuses on identifying false breakouts and price returns to broken levels within a defined time window, and then looks for retracements into the Fibonacci zone. If price reenters the 0.618 to 1.0 retracement area and aligns with the time-based filters, the system flags a low-risk, high-probability entry opportunity.
To enhance the precision of signal detection, the screener categorizes setups into two distinct types based on the speed of the price reaction after a breakout. Type A signals occur when the price breaks a level and immediately returns to break-even within the very next candle indicating a sharp rejection and rapid invalidation of the breakout. In contrast, Type B signals involve a more gradual return to the broken level, typically taking between two to five candles. This differentiation allows traders to better assess the context and urgency of each trap, providing a clearer understanding of momentum and liquidity behavior behind the move.
Additionally, the screener includes a Signal Age feature, which displays how much time has passed since the last valid signal was generated. This allows traders to quickly assess signal freshness and avoid acting on outdated setups, especially in fast-moving market environments.
One of the key advantages of this tool is its ability to simultaneously scan multiple symbols and timeframes. It only triggers an alert when all conditions false breakout, structural return, and Fibonacci alignment are met. This allows traders to bypass the need for manually reviewing dozens of charts and instead concentrate on clean, valid, and structure-based setups with greater precision.
🔵 How to Use
This tool operates as a structure-based screener that continuously scans various symbols and timeframes. By combining price behavior analysis, structural breakout detection, and Fibonacci retracement zones, it only signals entries when the probability of reversal is significantly supported by liquidity logic and price correction depth.
The system doesn’t just monitor price movements beyond key levels like swing highs or lows. It also evaluates whether the move quickly reverses and absorbs liquidity. If so, Fibonacci is applied to measure the depth of the pullback and identify the most favorable entry zones.
🟣 Long Signal
A long setup is triggered when price temporarily breaks below a valid structural support or swing low. This initial move is typically designed to trigger stop losses and collect sell-side liquidity. If price returns to the broken level within five candles, it is considered a false breakout.
At this point, Fibonacci is drawn from the recent swing high to the new low. If price enters the 0.618 to 1.0 retracement zone within the next ten candles, a potential long entry aligned with Smart Money logic is activated. This deep retracement zone often offers the best low-risk entry, as it typically marks the area where liquidity has been absorbed and the breakout structure has failed.
The stop loss is placed slightly below the 1.0 level to account for minor fluctuations, while the target is set based on trend structure or risk-reward preferences.
🟣 Short Signal
A short setup begins with price temporarily breaking above a valid resistance or swing high. This breakout is often driven by buy-side liquidity collection or stop hunting. If price returns to the broken level within five candles, the move is marked as a breakout failure.
Fibonacci is then drawn from the recent swing low to the new high. If price enters the 0.618 to 1.0 zone within ten candles after the return, a short opportunity is confirmed. This area usually represents the maximum acceptable retracement before a continuation move to the downside and often triggers strong reactions.
The stop loss is placed just above the 1.0 level, and the target is defined based on the expected structure of the move or a predetermined reward ratio.
🟡 Advantages of the Screener
Unlike manual approaches that require constant monitoring of multiple charts, this tool functions as a fully automated screener across multiple symbols and timeframes. It continuously evaluates key levels, liquidity reactions, structural returns, and Fibonacci zones. An alert is only generated when all necessary conditions are met with high accuracy.
This ensures that traders avoid risky or misleading entries and stay focused on precise, verified, and logic-based setups — saving time, reducing noise, and improving consistency in decision-making.
🔵 Settings
🟣 Logical settings
Swing period : You can set the swing detection period.
Valid After Trigger Bars : Limits how many candles after a fake breakout the entry zone remains valid.
Max Swing Back Method : It is in two modes "All" and "Custom". If it is in "All" mode, it will check all swings, and if it is in "Custom" mode, it will check the swings to the extent you determine.
Max Swing Back : You can set the number of swings that will go back for checking.
🟣 Display Settings
Table on Chart : Allows users to choose the position of the signal dashboard either directly on the chart or below it, depending on their layout preference.
Number of Symbols : Enables users to control how many symbols are displayed in the screener table, from 10 to 20, adjustable in increments of 2 symbols for flexible screening depth.
Table Mode : This setting offers two layout styles for the signal table :
Basic : Mode displays symbols in a single column, using more vertical space.
Extended : Mode arranges symbols in pairs side-by-side, optimizing screen space with a more compact view.
Table Size : Lets you adjust the table’s visual size with options such as: auto, tiny, small, normal, large, huge.
Table Position : Sets the screen location of the table. Choose from 9 possible positions, combining vertical (top, middle, bottom) and horizontal (left, center, right) alignments.
🟣 Symbol Settings
Each of the 10 symbol slots comes with a full set of customizable parameters :
Symbol : Define or select the asset (e.g., XAUUSD, BTCUSD, EURUSD, etc.).
Timeframe : Set your desired timeframe for each symbol (e.g., 15, 60, 240, 1D).
🟣 Alert Settings
Alert : Enables alerts for SMT Screener.
Message Frequency : Determines the frequency of alerts. Options include 'All' (every function call), 'Once Per Bar' (first call within the bar), and 'Once Per Bar Close' (final script execution of the real-time bar). Default is 'Once per Bar'.
Show Alert Time by Time Zone : Configures the time zone for alert messages. Default is 'UTC'.
🔵 Conclusion
Many trading mistakes stem from misinterpreting price breaks and entering too early into deceptive moves. In a market environment where false breakouts, liquidity traps, and engineered movements are increasingly common, having a tool that accurately filters these events and frames them within a Fibonacci-based and time-filtered structure provides a real strategic edge.
This indicator merges market structure logic, false breakout detection, and precise retracement analysis to ensure trades are only taken when multiple technical factors are aligned. It not only enhances trade success rates but also helps avoid emotional or impulsive entries.
Moreover, with the ability to scan across several symbols and timeframes simultaneously, the tool goes beyond being just an indicator it becomes a semi-automated structural analysis system. For traders who base their decisions on price behavior, Smart Money logic, and structural retracements, this screener can become a key component of a disciplined and effective trading approach.
Bezahltes Script

ICT Opening Range Projections (tristanlee85)ICT Opening Range Projections
This indicator visualizes key price levels based on ICT's (Inner Circle Trader) "Opening Range" concept. This 30-minute time interval establishes price levels that the algorithm will refer to throughout the session. The indicator displays these levels, including standard deviation projections, internal subdivisions (quadrants), and the opening price.
🟪 What It Does
The Opening Range is a crucial 30-minute window where market algorithms establish significant price levels. ICT theory suggests this range forms the basis for daily price movement.
This script helps you:
Mark the high, low, and opening price of each session.
Divide the range into quadrants (premium, discount, and midpoint/Consequent Encroachment).
Project potential price targets beyond the range using configurable standard deviation multiples .
🟪 How to Use It
This tool aids in time-based technical analysis rooted in ICT's Opening Range model, helping you observe price interaction with algorithmic levels.
Example uses include:
Identifying early structural boundaries.
Observing price behavior within premium/discount zones.
Visualizing initial displacement from the range to anticipate future moves.
Comparing price reactions at projected standard deviation levels.
Aligning price action with significant times like London or NY Open.
Note: This indicator provides a visual framework; it does not offer trade signals or interpretations.
🟪 Key Information
Time Zone: New York time (ET) is required on your chart.
Sessions: Supports multiple sessions, including NY midnight, NY AM, NY PM, and three custom timeframes.
Time Interval: Supports multi-timeframe up to 15 minutes. Best used on a 1-minute chart for accuracy.
🟪 Session Options
The Opening Range interval is configurable for up to 6 sessions:
Pre-defined ICT Sessions:
NY Midnight: 12:00 AM – 12:30 AM ET
NY AM: 9:30 AM – 10:00 AM ET
NY PM: 1:30 PM – 2:00 PM ET
Custom Sessions:
Three user-defined start/end time pairs.
This example shows a custom session from 03:30 - 04:00:
🟪 Understanding the Levels
The Opening Price is the open of the first 1-minute candle within the chosen session.
At session close, the Opening Range is calculated using its High and Low . An optional swing-based mode uses swing highs/lows for range boundaries.
The range is divided into quadrants by its midpoint ( Consequent Encroachment or CE):
Upper Quadrant: CE to high (premium).
Lower Quadrant: Low to CE (discount).
These subdivisions help visualize internal range dynamics, where price often reacts during algorithmic delivery.
🟪 Working with Ranges
By default, the range is determined by the highest high and lowest low of the 30-minute session:
A range can also be determined by the highest/lowest swing points:
Quadrants outline the premium and discount of a range that price will reference:
Small ranges still follow the same algorithmic logic, but may be deemed insignificant for one's trading. These can be filtered in the settings by specifying a minimum ticks limit. In this example, the range is 42 ticks (10.5 points) but the indicator is configured for 80 ticks (20 points). We can select which levels will plot if the range is below the limit. Here, only the 00:00 opening price is plotted:
You may opt to include the range high/low, quadrants, and projections as well. This will plot a red (configurable) range bracket to indicate it is below the limit while plotting the levels:
🟪 Price Projections
Projections extend beyond the Opening Range using standard deviations, framing the market beyond the initial session and identifying potential targets. You define the standard deviation multiples (e.g., 1.0, 1.5, 2.0).
Both positive and negative extensions are displayed, symmetrically projected from the range's high and low.
The Dynamic Levels option plots only the next projection level once price crosses the previous extreme. For example, only the 0.5 STDEV level plots until price reaches it, then the 1.0 level appears, and so on. This continues up to your defined maximum projections, or indefinitely if standard deviations are set to 0.
This example shows dynamic levels for a total of 6 sessions, only 1 of which meet a configured minimum limit of 50 ticks:
Small ranges followed by significant displacement are impacted the most with the number of levels plotted. You may hide projections when configuring the minimum ticks.
A fixed standard deviation will plot levels in both directions, regardless of the price range. Here, we plot up to 3.0 which hiding projections for small ranges:
🟪 Legal Disclaimer
This indicator is provided for informational and educational purposes only. It is not financial advice, and should not be construed as a recommendation to buy or sell any financial instrument. Trading involves substantial risk, and you could lose a significant amount of money. Past performance is not indicative of future results. Always consult with a qualified financial professional before making any trading or investment decisions. The creators and distributors of this indicator assume no responsibility for your trading outcomes.

Synapse Trade - Fair Value GapsNot your average FVG indicator. This FVG indicator allowed for overlapping, and invalidated FVGs to remain as the existence of Inversion Fair Value Gaps exists and, in my recent experience, has been incredibly useful finding new levels of support and resistance, even inside a currently FVG, the "invalidated" FVGs can still have an impact on price trend and react to it.
~edit: updated chart to be cleaner and include only the FVG indicator

Smarter Money Concepts - MTF IFVGs [PhenLabs]📊 Smarter Money Concepts - MTF IFVG
Version: PineScript™ v6
📌 Description
This multi-timeframe indicator identifies Inverse Fair Value Gaps (IFVGs) and their inversions across simultaneous chart intervals, helping traders spot liquidity voids and potential reversal zones. By analyzing price action through the lens of institutional order flow patterns, it solves the problem of manual gap tracking across timeframes while incorporating volatility-adjusted parameters and psychological level analysis for higher-probability setups.
🚀 Points of Innovation
• Multi-Timeframe Engine - Simultaneous analysis of 3 higher timeframes
• Adaptive Parameters - Auto-adjusts to market volatility conditions
• Quality Scoring System - Ranks gaps using RVI strength and size metrics
• Inversion Tracking - Monitors failed gaps for counter-trend signals
• Render Optimization - Prevents chart clutter with smart gap management
🔧 Core Components
FVG Detection Logic: Identifies gaps using customizable price source (Close/Wick)
Inversion Tracker: Manages failed gaps and generates counter signals
Multi-Timeframe Engine: Processes 3 independent higher timeframe analyses
Dashboard System: Real-time display of active gaps across all timeframes
🔥 Key Features
• Volatility-adjusted gap size filters (ATR-based)
• Customizable timeframe confluence analysis
• Color-coded quality scoring
• Non-repainting inversion signals
• Mobile-optimized visual rendering
🎨 Visualization
• Colored Boxes: Translucent zones show active gaps (green/bullish, red/bearish)
• Midline Plot: Dashed gray line marks gap midpoint for price targets
• Inversion Markers: Intense colors show failed gaps (dark red/bullish failure, bright green/bearish failure)
• HTF Differentiation: Higher timeframe gaps shown in blue/teal hues
📖 Usage Guidelines
Multi-Timeframe Settings
• Higher Timeframe 1
Default: 30 | Range: Any > Chart TF | Controls primary confluence timeframe
• Show All Timeframes
Default: True | Toggles multi-TF gap displays
Gap Settings
• Source
Default: Close | Options: | Determines gap measurement method
• RVI Period
Default: 14 | Range: 1-50 | Sets momentum confirmation sensitivity
• RVI Value
Default 0.1 | 0 to see all IFVGs | Increase min RVI to see the most powerful IFVGs
✅ Best Use Cases
• Identifying confluence across timeframes
• Spotting institutional order blocks
• High-probability reversal trading
• Trend continuation confirmation
• Volatility breakout setups
⚠️ Limitations
• Repaints historical gap zones
• Requires understanding of FVG concepts
• Higher timeframe data latency
• Quality scores rely on RVI/ATR settings
💡 What Makes This Unique
First FVG indicator with true multi-timeframe processing
Adaptive parameters that auto-adjust to volatility
Quantifiable quality scoring system
Professional-grade dashboard with HTF tracking
🔬 How It Works
Gap Detection: Identifies FVGs using price relationships and RVI confirmation
Inversion Tracking: Monitors price breaches to flag failed gaps
Quality Assessment: Scores gaps based on size, momentum, and location
Adaptive Filtering: Adjusts parameters using ATR-based volatility analysis
Multi-TF Synthesis: Correlates gaps across user-selected timeframes
Visual Rendering: Displays only relevant, active gaps to prevent clutter
💡 Note:
Start with default settings and gradually adjust parameters after observing market interactions. Focus on gaps with quality scores above 7 that align with higher timeframe trends. Combine with price action at psychological levels for highest-probability setups. Remember that higher timeframe gaps generally carry more significance than current chart gaps.

CISD [TakingProphets]🧠 Indicator Purpose:
The "CISD - Change in State of Delivery" is a precision tool designed for traders utilizing ICT (Inner Circle Trader) conecpets. It detects critical shifts in delivery conditions after liquidity sweeps — helping you spot true smart money activity and optimal trade opportunities. This script is especially valuable for traders applying liquidity concepts, displacement recognition, and market structure shifts at both intraday and swing levels.
🌟 What Makes This Indicator Unique:
Unlike basic trend-following or scalping tools, CISD operates through a two-phase smart money logic:
Liquidity Sweep Detection (sweeping Buyside or Sellside Liquidity).
State of Delivery Change Identification (through bearish or bullish displacement after the sweep).
It intelligently tracks candle sequences and only signals a CISD event after true displacement — offering a much deeper context than ordinary indicators.
⚙️ How the Indicator Works:
Swing Point Detection: Identifies recent pivot highs/lows to map Buyside Liquidity (BSL) and Sellside Liquidity (SSL) zones.
Liquidity Sweeps: Watches for price breaches of these liquidity points to detect institutional stop hunts.
Sequence Recognition: Finds series of same-direction candles before sweeps to mark institutional accumulation/distribution.
Change of Delivery Confirmation: Confirms CISD only after significant displacement moves price against the initial candle sequence.
Visual Markings: Automatically plots CISD lines and optional labels, customizable in color, style, and size.
🎯 How to Use It:
Identify Liquidity Sweeps: Watch for CISD levels plotted after a liquidity sweep event.
Plan Entries: Look for retracements into CISD lines for high-probability entries.
Manage Risk: Use CISD levels to refine your stop-loss and profit-taking zones.
Best Application:
After stop hunts during Killzones (London Open, New York AM).
As part of the Flow State Model: identify higher timeframe PD Arrays ➔ wait for lower timeframe CISD confirmation.
🔎 Underlying Concepts:
Liquidity Pools: Highs and lows cluster stop orders, attracting institutional sweeps.
Displacement: Powerful price moves post-sweep confirm smart money involvement.
Market Structure: CISD frequently precedes major Change of Character (CHoCH) or Break of Structure (BOS) shifts.
🎨 Customization Options:
Adjustable line color, width, and style (solid, dashed, dotted).
Optional label display with customizable color and sizing.
Line extension settings to keep CISD zones visible for future reference.
✅ Recommended for:
Traders studying ICT Smart Money Concepts.
Intraday scalpers and higher timeframe swing traders.
Traders who want to improve entries around liquidity sweeps and institutional displacement moves.
🚀 Bonus Tip:
For maximum confluence, pair this with the HTF POI, ICT Liquidity Levels, and HTF Market Structure indicators available at TakingProphets.com! 🔥

ICT Breakers (BOS / MSS - Market Structure) [ICTProTools]The Breakers (Market Structure) indicator is designed to help traders identify true breaker structures , a key concept in Inner Circle Trader (ICT) methodology. In market structure, Breakers represent powerful shifts where a key high or low is broken, leading to a reversal in market direction. Most tools misinterpret structure shifts, using internal structure , leading to fake breakouts. This tool solves that problem by filtering out false signals , providing clear & structured insights , all with multi-timeframe compatibility.
💎 Key Features
⚡️ Breakers in action
The indicator shows the structure following ICT instructions. A breaker is defined by two lines:
The first line confirms the previous trend (it could be interpreted as a BOS).
The second line highlights the moment price breaks structure (with candle body or wick based on your chosen settings), signaling a shift in trend direction (like an MSS).
Furthermore, it’s important to note that a breaker not only shows the structure, but also defines a potential Point of Interest (POI), an area where price may retrace before continuing its trend.
Here, we can observe two clear structure shifts.
On the far left, the market was in a bearish trend, illustrated by the first visible (dotted and red) line. Shortly after, the second (solid and green) line appears, showing a break that initiates a new bullish trend.
This upward movement continues, with the last confirmation marked by a top structure line. And finally, the structure is broken once again indicating a transition back into a bearish trend.
💪 Real Structure with True Highs / Lows
Unlike many indicators that detect internal breakouts , this tool follows ICT’s true market structure rules .
In a bearish trend , a bullish breaker is only confirmed when the high that created the low is broken , and conversely for a bullish scenario.
Fake breakouts are ignored, preventing misleading signals.
In the image above, the white breakout is correctly ignored by the indicator, as it doesn't align with ICT’s structural rules. That white high is simply part of the internal structure, not the true swing point. Instead, the green line highlights the key level that truly matters, the one whose rupture would have confirmed a real change in market structure.
🔔 Smart Alerts for Structure Updates
Stay one step ahead with customizable alerts designed to notify you instantly when market structure changes occur.
Get notified for BOS (Continuation) and / or MSS (Breaker) events.
Set alerts for bullish , bearish , or both directions.
Choose between once or repeated alerts , based on your strategy.
This feature allows traders to remain focused and reactive , even when monitoring multiple markets.
In the alert settings, select which structure shifts you want to be notified of. Whether you're a scalper or a swing trader, the alerts keep you connected to key moments without needing to constantly monitor the chart.
⏳ Multi-Timeframe Structure
All features of the indicator are fully compatible with higher timeframes .
Get a broader view of market structure without switching timeframes.
Monitor higher timeframe structures and receive alerts, all without leaving your analysis chart .
In this example, the market structure of the 30m timeframe is displayed while on a 5m chart, providing a clearer perspective.
✨ Customization & User Control
Make it yours! The indicator allows full customization:
Swing bars (to confirm high / low)
Select your mode for Breakers (MSS) , using the candle body only or body / wick
Line style (type, width, color)
Choice of displayed timeframe
Activate any alert , with the frequency you want
🎯 Conclusion
✅ Avoid false signals by focusing on true ICT Breakers
✅ Smart alerts to never miss a structural shift
✅ Multi-timeframe support for enhanced analysis
✅ Clean & professional design for an optimal trading experience

NoSweep CandlesNoSweep Candles – Identify Candles Without Liquidity Sweeps
The NoSweep Candles indicator highlights candles that do not break the high or low of the previous candle. This helps traders easily spot areas of consolidation, potential reversals, or moments of market indecision.
Key Features:
✅ White candle coloring when neither the high nor low of the previous candle is breached.
✅ Keeps default colors for other candles, maintaining a clean chart.
✅ Perfect for Smart Money Concept (SMC) traders, helping identify liquidity stability.
✅ No unnecessary signals or distractions, just pure price action analysis.
Use NoSweep Candles to refine your trading strategy and better understand market structure! 🚀
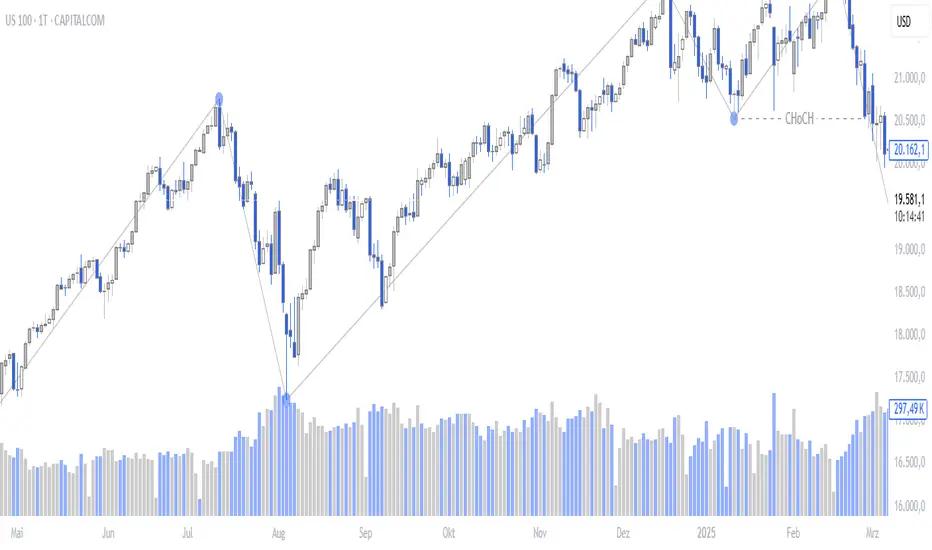
AlgoCados x ICT ToolkitAlgoCados x ICT Toolkit is a TradingView tool designed to integrate ICT (Inner Circle Trader) Smart Money Concepts (SMC) into a structured trading framework.
It provides traders with institutional liquidity insights, precise price level tracking, and session-based analysis, making it an essential tool for intraday, swing, and position trading.
Optimized for Forex, Futures, and Crypto, this toolkit offers multi-timeframe liquidity tracking, killzone mapping, RTH analysis, standard deviation projections, and dynamic price level updates, ensuring traders stay aligned with institutional market behavior.
# Key Features
Multi-Timeframe Institutional Price Levels
The indicator provides a structured approach to analyzing liquidity and market structure across different time horizons, helping traders understand institutional order flow.
- Previous Day High/Low (PDH/PDL) – Tracks the Previous Day’s High/Low, crucial for intraday liquidity analysis.
- Previous Week High/Low (PWH/PWL) – Monitors the Previous Week’s High/Low, aiding in higher timeframe liquidity zone tracking.
- Previous Month High/Low (PMH/PML) – Highlights the Previous Month’s High/Low, critical for swing trading and long-term bias confirmation.
- True Day Open (TDO) – Marks the NY Midnight Opening Price, providing a reference point for intraday bias and liquidity movements.
- Automatic Level Cleanup – When enabled. pxHigh/pxLow levels gets automatically deleted when raided, keeping the chart clean and focused on valid liquidity zones.
- Monthly, Weekly, Daily Open Levels – Identifies HTF price action context, allowing traders to track institutional order flow and potential liquidity draws.
# Regular Trading Hours (RTH) High, Low & Mid-Equilibrium (EQ)
For futures traders, the toolkit accurately identifies RTH liquidity zones to align with institutional trading behavior.
- RTH High/Low (RTH H/L) – Defines the RTH Gap high and low dynamically, marking key liquidity levels.
- RTH Equilibrium (EQ) – Calculates the midpoint of the RTH range, acting as a mean reversion level where price often reacts.
# Killzones & Liquidity Mapping
The indicator provides a time-based liquidity structure that helps traders anticipate market movements during high-impact trading windows.
ICT Killzones (Visible on 30-minute timeframe or lower)
- Asia Killzone (Asia) – Tracks overnight liquidity accumulation.
- London Open Killzone (LOKZ) – Marks early European liquidity grabs.
- New York Killzone (NYKZ) – Captures US session volatility.
- New York PM Session (PMKZ) – Available only for futures markets, tracking late-day liquidity shifts.
Forex-Specific Killzones (Visible on 30-minute timeframe or lower)
- London Close Killzone (LCKZ) – Available only for Forex, marks the European end of Day liquidity Points of Interests (POI).
- Central Bank Dealers Range (CBDR) – Available only for Forex, providing a liquidity framework used by central banks.
- Flout (CBDR + Asian Range) – Available only for Forex, extending CBDR with Asian session liquidity behavior.
- Killzone History Option – When enabled, Killzones remain visible beyond the current day; otherwise, they reset daily.
- Customizable Killzone Boxes – Modify opacity, colors, and border styles for seamless integration into different trading styles.
CME_MINI:NQH2025 FOREXCOM:EURUSD
# Standard Deviation (STDV) Liquidity Projections
A statistical approach to forecasting price movements based on Standard Deviations of HOTD (High of the Day) and LOTD (Low of the Day).
- Asia, CBDR, and Flout STDV Calculations (Visible on 30-minute timeframe or lower) – Predicts liquidity grabs based on price expansion behavior.
- Customizable Display Modes – Choose between Compact (e.g., "+2.5") or Verbose (e.g., "Asia +2.5") labels.
- Real-Time STDV Updates – Projections dynamically adjust as new price data is formed, allowing traders to react to developing market conditions.
CME_MINI:NQH2025
# Daily Session Dividers
- Visualizes Trading Days (Visible on 1-hour timeframe or lower) – Helps segment the trading session for better structure analysis.
- Daily Divider History Option – When enabled, dividers remain visible beyond the current trading week; otherwise, they reset weekly.
# Customization & User Experience
- Flexible Label Options – Adjust label size, font type, and color for improved readability.
- Intraday-Optimized Data – Killzones (30m or lower), STDV (30m or lower), and Daily Dividers (1H or lower) ensure efficient use of chart space.
- Configurable Line Styles – Customize solid, dotted, or dashed styles for various levels, making charts aesthetically clean and data-rich.
# Usage & Configurations
The AlgoCados x ICT Toolkit is designed to seamlessly fit different trading methodologies.
Scalping & Intraday Trading
- Track PDH/PDL levels for liquidity sweeps and market reversals.
- Utilize Killzones & Session Open levels to identify high-probability entry zones.
- Analyze RTH High/Low & Mid-EQ for potential liquidity targets and reversals.
- Enable STDV projections for potential price expansion and reversals.
Swing & Position Trading
- Use PWH/PWL and PMH/PML levels to determine HTF liquidity shifts.
- Monitor RTH Gap, TDO, and session liquidity markers for trade confirmation.
- Combine HTF bias with LTF liquidity structures for optimized entries and exits.
# Inputs & Configuration Options
Customizable Parameters
- Offset Adjustment – Allows users to shift displayed data horizontally for better visibility.
- Killzone Box Styling – Customize colors, opacity, and border styles for session boxes.
- Session Dividers – Modify line styles and colors for better time segmentation.
- Killzone & Daily Divider History Toggle – Enables users to view past killzones and dividers instead of resetting them daily/weekly.
- Label Formatting – Toggle between Compact and Verbose display modes for streamlined analysis.
# Advanced Features
Real-Time Data Processing & Dynamic Object Management
- Auto Cleanup of pxLevels – Prevents clutter by removing invalidated levels upon liquidity raids.
- Session History Control – Users can toggle historical data for daily dividers and killzones to maintain a clean chart layout.
- Daily & Weekly Resets – Ensures accurate session tracking by resetting daily dividers at the start of each new trading week.
CME_MINI:NQH2025
# Example Use Cases
- Day Traders & Scalpers – Utilize Killzones, PDH/PDL, DO and TDO levels for precise liquidity-based trading opportunities.
- Swing Traders – Leverage HTF Open Levels, PWH/PWL liquidity mapping, and TDO for trend-based trade execution.
- Futures Traders – Optimize trading with RTH High/Low, Mid-EQ, and PMKZ for session liquidity tracking.
- Forex Traders – Use CBDR, Flout, and session liquidity mapping to align with institutional order flow.
CME_MINI:ESH2025
"By integrating institutional concepts, liquidity mapping, and smart money methodologies, the AlgoCados x ICT Toolkit empowers traders with a data-driven approach to market inefficiencies and liquidity pools."
# Disclaimer
This tool is designed to assist in trading decisions but should be used in conjunction with other analysis methods and proper risk management. Trading involves significant risk, and traders should ensure they understand market conditions before executing trades.

Flux Charts - PAT Automation💎 GENERAL OVERVIEW
The PAT Automation is a powerful and versatile tool designed to help traders rigorously test their trading strategies against historical market data. With an array of advanced settings, traders can fine-tune their strategies, assess performance, and identify key improvements before deploying in live trading environments. This backtester offers a wide range of configurable settings, explained within this write-up.
Features of the PAT Automation:
Step By Step : Configure your strategy step by step, which will allow you to have OR & AND logic in your strategies.
Highly Configurable : Offers multiple parameters for fine-tuning trade entry and exit conditions.
Multi-Timeframe Analysis : Allows traders to analyze multiple timeframes simultaneously for enhanced accuracy.
Provides advanced stop-loss, take-profit, and break-even settings.
Incorporates volume-based conditions, liquidity grabs , order blocks , market structures and fair value gaps for refined strategy execution.
🚩 UNIQUENESS
The PAT Automation stands out from conventional backtesting tools due to its unparalleled flexibility, precision, and advanced trading logic integration. Key factors that make it unique include:
✅ Comprehensive Strategy Customization – Unlike traditional backtesters that offer basic entry and exit conditions, PAT Automation provides a highly detailed parameter set, allowing traders to fine-tune their strategies with precision.
✅ Multi-Timeframe Price Action Features – This is the first-ever tool that allows traders to backtest price action with multi-timeframe features such as Fair Value Gaps (FVGs), Inversion Fair Value Gaps (IFVGs), Order Blocks & Breaker Blocks.
✅ Customizable Take-Profit Conditions – Offers various methods to set take-profit exits, including using core features from price action, and fixed exits like ATR, % change or price change, enabling traders to tailor their exit strategies to specific market behaviors.
✅ Customizable Stop-Loss Conditions – Provides several ways to set up stop losses, including using concepts from price action and trailing stops or fixed exits like ATR, % change or price change, allowing for dynamic risk management tailored to individual strategies.
✅ Integration of External Indicators – Allows the inclusion of other indicators or data sources from TradingView for creating strategy conditions, enabling traders to enhance their strategies with additional insights and data points.
By integrating these advanced features, PAT Automation ensures that traders can rigorously test and optimize their strategies with great accuracy and efficiency.
📌 HOW DOES IT WORK?
The first setting you will want to set it the pyramiding setting. This setting controls the number of simultaneous trades in the same direction allowed in the strategy. For example, if you set it to 1, only one trade can be active in any time, and the second trade will not be entered unless the first one is exited. If it is set to 2, the script will handle both of them at the same time. Note that you should enter the same value to this pyramiding setting, and the pyramiding setting in the "Properties" tab of the script for this to work.
For deep backtesting, you can set "Max Distance To Last Bar" to "Unlimited". If you encounter any memory issues, try decreasing this setting to a lower value.
You can enable and set a backtesting window that will limit the entries to between the start date & end date.
Then, you can enter your desired settings to Price Action features like FVGs, IFVGs, Order Blocks, Breaker Blocks, Liquidity Grabs, Market Structures, EQH & EQL and Volume Imbalances. You can also enable and set up to 3 timeframes, which you can use later on when customizing your strategies enter / exit conditions.
Entry Conditions
From the "Long Conditions" or the "Short Conditions" groups, you can set your position entry conditions. For settings like "initial capital" or "order size", you can open the "Properties" tab, where these are handled.
The PAT Automation can use the following conditions for entry conditions :
1. Order Block (OB)
Detection: Triggered when an Order Block forms or is detected
Retest: Triggered when price retests an Order Block. A retest is confirmed when a candle enters an Order Block and closes outside of it.
Retracement: Triggered when price touches an Order Block
Break: Triggered when an Order Block is invalidated by candle close or wick, depending on the user's input.
2. Breaker Block (BB)
Detection: Triggered when a Breaker Block forms or is detected
Retest: Triggered when price retests a Breaker Block. A retest is confirmed when a candle enters a Breaker Block and closes outside of it.
Retracement: Triggered when price touches a Breaker Block
Break: Triggered when a Breaker Block is invalidated by candle close or wick, depending on the user's input.
3. Fair Value Gap (FVG)
Detection: Triggered when an FVG forms or is detected
Retest: Triggered when price retests an FVG. A retest is confirmed when a candle enters an FVG and closes outside of it.
Retracement: Triggered when price touches an FVG
Break: Triggered when an FVG is invalidated by candle close or wick, depending on the user's input.
4. Inversion Fair Value Gap (IFVG)
Detection: Triggered when an IFVG forms or is detected
Retest: Triggered when price retests an IFVG. A retest is confirmed when a candle enters an IFVG and closes outside of it.
Retracement: Triggered when price touches an IFVG
Break: Triggered when an IFVG is invalidated by candle close or wick, depending on the user's input.
5. Break of Structure (BOS)
Detection: Triggered when a BOS forms or is detected
6. Change of Character (CHoCH)
Detection: Triggered when a CHoCH forms or is detected
7. Change of Character Plus (CHoCH+)
Detection: Triggered when a CHoCH+ forms or is detected
8. Volume Imbalance (VI)
Detection: Triggered when a Volume Imbalance forms or is detected
9. Equal High (EQH)
Detection: Triggered when an EQH is detected
10. Equal Low (EQL)
Detection: Triggered when an EQL is detected
11. Buyside Liquidity Grab
Detection: Triggered when a liquidity grab occurs at Buyside Liquidity (BSL).
12. Sellside Liquidity Grab
Detection: Triggered when a liquidity grab occurs at Sellside Liquidity (SSL).
🕒 TIMEFRAME CONDITIONS
The PAT Automation supports Multi-Timeframe (MTF) features, just like the Price Action Toolkit. When setting an entry condition, you can also choose the timeframe.
To set up MTF conditions, navigate to the 'Timeframes' section in the settings, select your desired timeframes, and enable them. You can choose up to three timeframes.
Once you've selected your timeframes, you can use them in your strategy. When setting long and short entry / exit conditions, you can choose from Timeframe 1, Timeframe 2, or Timeframe 3.
External Conditions
Users can use external indicators on the chart to set entry conditions.
The second dropdown in the external condition settings allows you to choose a conditional operator to compare external outputs. Available options include:
Less Than or Equal To: <=
Less Than: <
Equal To: =
Greater Than: >
Greater Than or Equal To: >=
The position entry conditions work like this ;
Each side has 5 Price Action conditions and 1 Source condition. Each condition can be enabled or disabled using the checkbox on the left side.
For Price Action Conditions, you can set a direction: "Any", "Bullish" or "Bearish".
Then a Price Action Feature, like "FVG" or "Order Block".
The last part of our constructed condition is the alert type, which you can select between "Detection", "Retest", "Retracement" or "Break".
Now you should have a constructed condition, which should look like "Bullish Order Block Retest".
You can select which timeframe should this condition work on from Timeframe 1, 2 or 3. If you select "Any Timeframe", the condition will work for all timeframes.
Lastly select the step of this condition from 1 to 6.
The Source Condition
The last condition on each side is a source condition that is different from the others. Using this condition, you can create your own logic using other indicators' outputs on your chart. For example, suppose that you have an EMA indicator in your chart. You can have the source condition to something like "EMA > high".
The Step System
Each condition has a step number, and conditions are in topological order based on them.
The conditions are executed step by step. This means the condition with step 2 cannot be executed before the condition with step 1 is executed.
Conditions with the same step numbers have "OR" logic. This means that if you have 2 conditions with step 3, the condition with step 4 can trigger after only one of the step 3 conditions is executed.
➕ OTHER ENTRY FEATURES
The PAT Automation allows traders to choose when to execute trades and when not to execute trades.
1. Only Take Trades
This setting lets users specify the time period when their strategy can open or execute trades.
2. Don't Take Trades
This setting lets users specify time periods when their strategy can't open or execute trades.
↩️ EXIT CONDITIONS
1. Exit on Opposite Signal
When enabled, a long position will close when short entry conditions are met, and a short position will close when long entry conditions are met.
2. Exit on Session End
When enabled, positions will be closed at the end of the trading session.
📈 TAKE PROFIT CONDITIONS
There are several methods available for setting take profit exits and conditions.
1. Entry Condition TP
Users can use entry conditions as triggers for take-profit exits. This setting can be found under the long and short exit conditions.
2. Fixed TP
Users can set a fixed TP for exits. This setting can be found under the long and short exit conditions. Users can choose between the following:
Price: This method triggers a TP exit when price reaches a specified level. For example, if you set the Price TP to 10 and buy NASDAQ:TSLA at $190, the trade will automatically exit when the price reaches $200 ($190 + $10).
Ticks: This method triggers a TP exit when price moves a specified number of ticks.
Percentage (%): This method triggers a TP exit when price moves a specified percentage.
ATR: This method triggers a TP exit based on a specified multiple of the Average True Range (ATR).
📉 STOP LOSS CONDITIONS
There are several methods available for setting stop-loss exits and conditions.
1. Entry Condition SL
Users can use entry conditions as triggers for stop-loss exits. This setting can be found under the long and short exit conditions.
2. Fixed SL
Users can set a fixed SL for exits. This setting can be found under the long and short exit conditions. Users can choose between the following:
Price: This method triggers a SL exit when price reaches a specified level. For example, if you set the Price SL to 10 and buy NASDAQ:TSLA at $200, the trade will automatically exit when the price reaches $190 ($200 - $10).
Ticks: This method triggers a SL exit when price moves a specified number of ticks.
Percentage (%): This method triggers a SL exit when price moves a specified percentage.
ATR: This method triggers a SL exit based on a specified multiple of the Average True Range (ATR).
3. Trailing Stop
An explanation & example for the trailing stop feature is present on the write-up within the next section.
Exit conditions have the same logic of constructing conditions like the entry ones. You can construct a Take-Profit Condition & a Stop-Loss Condition. Note that the Take-Profit condition will only work if the position is in profit, regardless of if it's triggered or not. The same applies for the Stop-Loss condition, meaning that it will only work if the position is in loss.
You can also set a Fixed TP & Fixed SL based on the price movement after the position is entered. You have options like "Price", "Ticks", "%", or "Average True Range". For example, you can set a Fixed TP like "5%", and the position will be entered once it moves 5% up in a long position.
Trailing Stop
For the Fixed SL, you also have a "Trailing" stop option, which you can set it's activation level as well. The Trailing stop activation level and it's value are expressed in ticks. Check this scenerio for an example :
We have a ticker with a tick value of $1. Our Trailing Stop is set to 10 ticks and activation level is set to 30 ticks.
We buy 1 contract when the price is $100.
When the price becomes $110, we are in $10 (10 ticks) profit and the trailing stop is now activated.
The current price our stop's on is $110 - $30 (30 ticks), which is the level of $80.
The trailing stop will only move if the price moves up the highest high the price has been after we entered the position.
Let's suppose that price moves up $40 right after our trailing stop is activated. The price will now be $150, and our trailing stop will sit on $150 - $30 (30 ticks) = $120.
If the price is down the $120 level, our stop loss will be triggered.
There is also a "Hard SL" option designed for a backup stop-loss when trailing stops are enabled. You can enable & set this option and if the price goes down before our trailing stop even activates, the position will be exited.
You can also move stop-loss to the break-even (entry price of the position) after a certain profit is achieved using the last setting of the exit conditions. Note that for this to work, you will need to have a Fixed SL set-up.
➕ OTHER EXIT FEATURES
1. Move Stop Loss to Breakeven
This setting allows the strategy to automatically move the SL to Breakeven (BE) when the position is in profit by a certain amount. Users can choose between the following:
Price: This method moves the SL to BE when price reaches a specified level.
Ticks: This method moves the SL to BE when price moves a specified number of ticks.
Percentage (%): This method moves the SL to BE when price moves a specified percentage.
ATR: This method moves the SL to BE when price moves a specified multiple of the Average True Range (ATR).
Example Entry Scenario
To give an example , check this scenario; out conditions are :
LONG CONDITIONS
Bullish Order Block Detection, Step 1
Bullish CHoCH Detection, Step 2
Bullish Volume Imbalance Detection, Step 2
Bullish IFVG Retest, Step 3
First, the strategy needs to detect a Bullish Order Block in order to start working.
After it's detected, now it's looking for either a CHoCH, or a Volume Imbalance to proceed to the next step, the reason for this is that they both have the same step number.
After one of them is detected, the strategy will consistently check all IFVGs for a retest. If the retest occurs, a long position will be entered.
⏰ ALERTS
This indicator uses TradingView's strategy alert system. All entries and exits will be sent as an alert if configured. It's possible to further customize these alerts to your liking. For more information check TradingView's strategy alert customization page: www.tradingview.com
⚙️ SETTINGS
1. Backtesting Settings
Pyramiding: Controls the number of simultaneous trades allowed in the strategy. This setting must have the same value that is entered on the script's properties tab on the settings pane.
Max Distance to Last Bar: Determines the depth of historical data used to prevent memory overload.
Enable Custom Backtesting Period: Restricts backtesting to a specific date range.
Start & End Time Configuration: Define precise start and end dates for historical analysis.
2. Fair Value Gaps Settings
Zone Invalidation: Select between "Wick" and "Close" invalidation.
Filtering: Choose between "Average Range" and "Volume Threshold".
FVG Sensitivity: Ranges from Extreme to Low to detect FVGs with varying strictness.
Allow Gaps: Enables analysis on tickers that have different open-close price gaps.
3. Inversion Fair Value Gaps Settings
Zone Invalidation: Choose between "Wick" and "Close".
4. Order Block Settings
Swing Length: Adjusts the minimum number of bars required for OB formation.
Zone Invalidation Method: Select between "Wick" and "Close".
5. Breaker Block Settings
Zone Invalidation: Set invalidation method as "Wick" or "Close".
6. Liquidity Grabs Settings
Pivot Length: Adjusts the number of bars used to detect liquidity grabs.
Wick-Body Ratio: Defines the proportion of wick-to-body size for liquidity grab detection.
7. Multi-Timeframe Analysis
Enable Up to Three Timeframes: Select and analyze trades across multiple timeframes.
8. Market Structures
Swing Length: Defines the number of bars required for structure shifts.
Includes BOS, CHoCH, CHoCH+ Detection.
9. Equal Highs & Lows
ATR Multiplier: Defines the sensitivity of equal highs/lows detection.
10. Volume Imbalances
Gap Size Sensitivity: Ranges from "Ultra" to "Low".
Disable Overnight Gaps: Filters out volume imbalances occurring due to overnight gaps.
11. Entry Conditions for Long & Short Trades
Multiple Conditions (1-6): Configure up to six independent conditions per trade direction.
Condition Types: Options include Detection, Retest, Retracement, and Break.
Timeframe Specification: Choose between "Any Timeframe", "Timeframe 1", "Timeframe 2", or "Timeframe 3".
Trade Execution Filters: Restrict trades within specific trading sessions.
12. Exit Conditions for Long & Short Trades
Exit on Opposite Signal: Automatically exit trades upon opposite trade conditions.
Exit on Session End: Closes all positions at the end of the trading session.
Multiple Take-Profit (TP) and Stop-Loss (SL) Configurations:
TP/SL based on % move, ATR, Ticks, or Fixed Price.
Hard SL option for additional risk control.
Move SL to BE (Break Even) after a certain profit threshold.
