Mxwll Price Action Suite [Mxwll]Introducing the Mxwll Price Action Suite!
The Mxwll Price Action Suite is an all-in-one analysis indicator incorporating elements of SMC and also ideas extending beyond the trading methodology!
Features
Internal structures
External structures
Customizable Sensitivities
BoS/CHoCH
Order Blocks
HH/LH/LL/LH Areas
Rolling TF highs/lows
Rolling Volume Comparisons
Auto Fibs
And more!
The image above shows the indicator's market structure identification capabilities. Internal BoS and CHoCH structures in addition to overarching market structures are available with customizable sensitivities.
The image above shows the indicator identifying order blocks! Additionally, HH/LH/LL/LH areas are also identified.
The image above shows a rolling area of interest. These areas can be compared to supply/demand zones, where traders might consider a bargain long/short/sell area.
The indicator displays a rolling 4hr high/low and 1D high/low, alongside auto fibonacci levels with a customizable sensitivity.
Finally, the Mxwll Price Action Suite shows relevant session information.
Table information
Current Session
Countdown to session close
Next Session
Countdown to next session open
Rolling 4-Hr volume intensity
Rolling 24-Hr volume intensity
Introducing the Mxwll SMC Suite!
The Mxwll SMC Suite is an all-in-one analysis indicator incorporating elements of SMC and also ideas extending beyond the trading methodology!
Features
Internal structures
External structures
Customizable Sensitivities
BoS/CHoCH
Order Blocks
HH/LH/LL/LH Areas
Rolling TF highs/lows
Rolling Volume Comparisons
Auto Fibs
And more!
The image above shows the indicator's market structure identification capabilities. Internal BoS and CHoCH structures in addition to overarching market structures are available with customizable sensitivities.
The image above shows the indicator identifying order blocks! Additionally, HH/LH/LL/LH areas are also identified.
The image above shows a rolling area of interest. These areas can be compared to supply/demand zones, where traders might consider a bargain long/short/sell area.
The indicator displays a rolling 4hr high/low and 1D high/low, alongside auto fibonacci levels with a customizable sensitivity.
Finally, the Mxwll Price Action Suite shows relevant session information.
Table information
Current Session
Countdown to session close
Next Session
Countdown to next session open
Rolling 4-Hr volume intensity
Rolling 24-Hr volume intensity
Expanded Features of Mxwll Price Action Suite
Internal and External Structures
Internal Structures: These elements refer to the price formations and patterns that occur within a smaller scope or a specific trading session. The suite can detect intricate details like minor support/resistance levels or short-term trend reversals.
External Structures: These involve larger, more significant market patterns and trends spanning multiple sessions or time frames. This capability helps traders understand overarching market directions.
Customizable Sensitivities
Adjusting sensitivity settings allows users to tailor the indicator's responsiveness to market changes. Higher sensitivity can catch smaller fluctuations, while lower sensitivity might focus on more significant, reliable market moves.
Break of Structure (BoS) and Change of Character (CHoCH)
BoS: This feature identifies points where the price breaks a significant structure, potentially indicating a new trend or a trend reversal.
CHoCH: Detects subtle shifts in the market's behavior, which could suggest the early stages of a trend change before they become apparent to the broader market.
Order Blocks and Market Phases
Order Blocks: These are essentially price levels or zones where significant trading activities previously occurred, likely pointing to the positions of smart money.
HH/LH/LL/LH Areas: Identifying Higher Highs (HH), Lower Highs (LH), Lower Lows (LL), and Lower Highs (LH) helps in understanding the trend and market structure, aiding in predictive analysis.
Rolling Timeframe Highs/Lows and Volume Comparisons
Tracks highs and lows over specified rolling periods, providing dynamic support and resistance levels.
Compares volume data across different timeframes to assess the strength or weakness of the current price movements.
Auto Fibonacci Levels
Automatically calculates and plots Fibonacci retracement levels, a popular tool among traders to identify potential reversal points based on past movements.
Session Data and Volume Intensity
Session Information: Displays current and upcoming trading sessions along with countdown timers, which is crucial for day traders and those trading on session overlaps.
Volume Intensity: Measures and compares the volume within the last 4 hours and 24 hours to gauge market activity and potential breakout/breakdown movements.
Visualizations and Practical Use
Dynamic Visuals: The suite provides dynamic visual aids, such as real-time updating of high/low markers and Fibonacci levels, which adjust as new data comes in. This feature is critical in fast-paced markets.
Strategic Entry/Exit Points: By identifying order blocks and using Fibonacci levels, traders can pinpoint strategic entry and exit points, maximizing potential returns.
Risk Management: Enhanced features like session countdowns and volume intensity help in better risk management by providing traders with more data on market sentiment and potential volatility.
Smartmoney

smart money - main trend and counter trendIn today's dynamic financial markets, keeping ahead requires more than just technical analysis.
Introducing the Smart Money indicator – a Pine Script tool made to discover the activity of market maker.
Smart Money is a helpful method for traders seeking a deeper understanding of market dynamics. This method shows the actions of big investors and large financial firms.
Keen traders pay close attention to what market makers do to stay ahead.
Trading strategies based on the Smart Money aim to align with the actions of these informed players.
Similar to the price action method, Smart Money method involves using classic concepts like supply and demand, price patterns, and support and resistance.
This indicator not only identifies usual parameters like Break of Structure (BOS), Change of Character (CHOCH), Inducement (IDM), Engineering Liquidity (Eng), and Order Blocks (OB), but also excels at uncovering these market events within counter-trend (internal trend).
Break of Structure (BOS)
BOS is formed when the price breaks the market structure (reliable support or resistance level) in the direction of the trend.
Change of Character (CHOCH)
CHOCH is formed when the price breaks the market structure in the opposite direction of the trend. This indicates a change in the market behavior. When traders can see these changes, they can adjust their strategies early on.
Inducement (IDM)
Inducement is a concept based on liquidity principles and technically is the last price pullback in the market structure.
IDM is the extreme point of the last pullback in the structure when the price makes a BOS or CHOCH. It's like a trap that makes traders jump into the market too early.
Engineering Liquidity (Eng Liq)
Also known as trend line liquidity and technically is the first extreme point in that trend.
Order Blocks (OB)
Order blocks are strategic market areas that indicate the final bearish or bullish activity before a significant price shift.
An Order Block is a handy tool that helps us see where the big guys are likely to put their money (potential reversal zones).
OB is determined based on the extreme points by considering last opposite candle (before a significant price movement) and fair value gaps.
This indicator has the ability to identify the decisional order block (the closest OB) and the extremum order blocks (the farthest OB).
Counter Trend
The standout feature of this indicator lies in its ability to detect and display all above features within internal trends.
Internal trends or counter trend, where the market moves against the main trend, are often challenging to navigate.
This comprehensive feature enables traders to navigate market complexities with confidence, identifying potential trend reversals and strategic entry points even when the broader trend suggests otherwise.
Some features of this indicator:
- Ability to identify BOS, CHOCH, IDM, Eng Liq and OBs in both main trend and counter trend.
- The text, color and size of each characteristic of the main trend and the counter trend are optional and you can manage their display type on the chart
- Ability to display swings with HH, LH, LL and HL labels
- Sending alarms when the price hits any of the levels (alarm levels are optional for both the main trend and the counter trend)
- Sending sweep alarms of each level (optional)
- Ability to display main structures and internal structures with desired color and thickness
- The possibility of displaying live and real-time structures
- Ability to see decision boxes
- Showing the structure trend by changing the background color

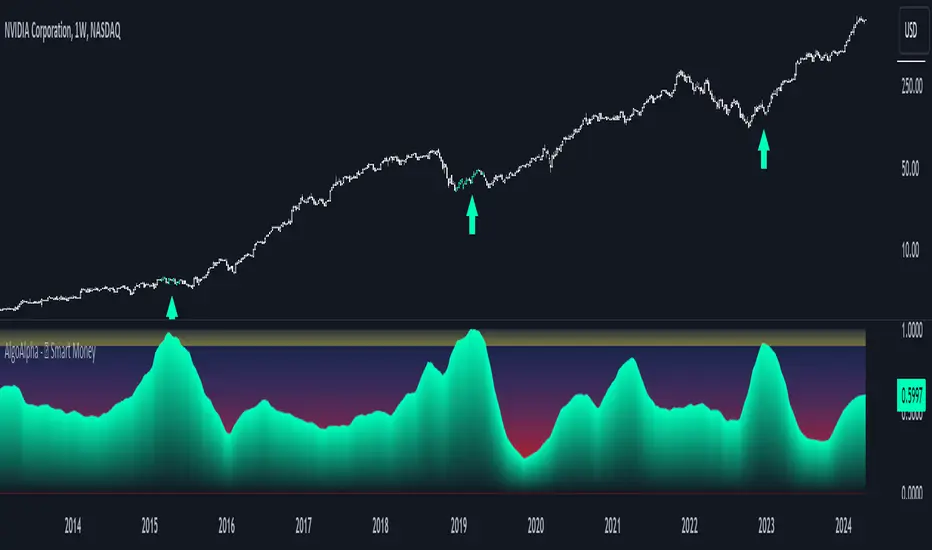
Smart Money Interest Index [AlgoAlpha]🌟 Smart Money Interest Index by AlgoAlpha 🌟
Welcome to the innovative Smart Money Interest Index indicator, designed meticulously by AlgoAlpha to revolutionize the way you trade! 📈🧠 This indicator is engineered to decipher the activities of smart money investors relative to the less informed (dumb money) and dynamically display their dominance in the trading landscape through a sophisticated visual index. 🚀💹
🔑 Key Features:
- Smart vs. Dumb Money Analysis: Tracks and compares the movements of smart money (informed investors) and dumb money (general public) within the market to identify potential investment signals.
- Relative Strength Index (RSI) Based Ratios: Utilizes RSI for both smart and dumb money to create a ratio that indicates buying or selling pressures.
- Dynamic Normalization: Employs a long-term peak normalization over a customizable period to ensure the index remains relevant regardless of market conditions.
- Visual Thresholds and Signals: Highlights significant shifts in market dynamics with color-coded thresholds, making it easier to spot changes at a glance.
🛠 How to Use the Smart Money Interest Index:
🔹 🚀 Step 1: Adding the Indicator
- Add the indicator to your favourites.
- Customize the settings according to your analysis needs:
- `Index Period`, `Volume Flow Period`, `Normalization Period`, `High Interest Threshold`
🔹 📊 Step 2: Interpretation of the Index
- Monitor the index plot; a rising index suggests increasing smart money interest, potentially indicating a buying opportunity.
- A value above the high interest threshold (in yellow) highlights significant interest by smart money, suggesting a good time to buy.
🔹 🔔 Step 3: Setting Alerts
- Configure alerts to notify you when the index crosses above the set threshold, enabling you to capitalize on trading opportunities timely and efficiently.
📐 Basic Logic Overview:
The Smart Money Interest Index by AlgoAlpha provides a unique metric that contrasts the investment behaviors of informed (smart money) and general (dumb money) investors. Utilizing the Relative Strength Index (RSI), this indicator evaluates the trading pressure exerted by both groups over specified periods, then forms a ratio of these activities to identify dominance in buying or selling trends. For example, when we see dumb money selling and smart buying, this suggests that the conditions for buying the asset is optimal as smart money is willing to buy the dip. The outputs are normalized against the highest values observed in a user-defined term to maintain consistency through varying market conditions. When the index exceeds a certain threshold, it suggests that smart money presence is particularly strong, possibly indicating that smart money is looking to enter positions on the asset. This tool serves as a sophisticated visual guide to understanding market dynamics and making well-informed trading decisions based on the activities of market-savvy investors. Smart money activity is identified during areas of low volume and the opposite for dumb money, the indicator uses the NVI and PVI metrics as its foundation for smart and dumb money analysis.
📊 Enhance Your Trading Strategy:
Leverage the Smart Money Interest Index to gain deeper insights into market dynamics and enhance your decision-making process with a powerful, data-driven approach. Whether you're looking to identify entry points or set strategic exits, this tool is designed to provide you with the competitive edge you need in the fast-paced world of trading. 🌐✨
Transform your trading with the power of smart money analysis—start using the Smart Money Interest Index today! 🚀🔔
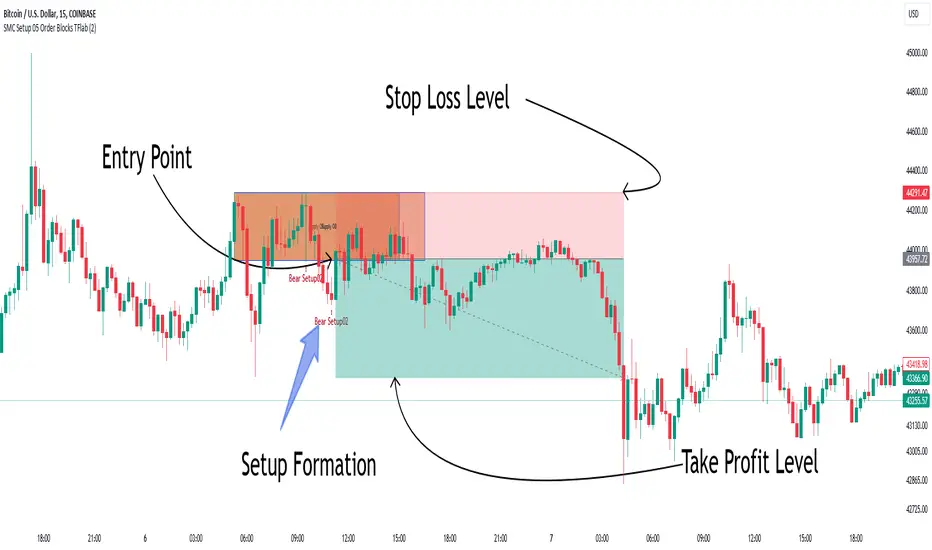
Smart Money Setup 05 [TradingFinder] Minor OB & Trend Proof🔵 Introduction
The "Smart Money Concept" transcends the realm of mere technical trading strategies to embody a comprehensive philosophy on the dynamics of market operations. It posits that key market participants engage in price manipulation, thereby complicating the trading landscape for smaller, retail traders.
Under this doctrine, retail traders are advised to tailor their strategies in alignment with the maneuvers of "Smart Money" - essentially, the capital operated by market makers.
To this end, one should endeavor to mirror the trading patterns of these influential market participants, who are adept at navigating through the nuances of supply, demand, and overall market structure. As a proponent of Smart Money trading, these elements are pivotal in your decision-making process for trade entries.
🟣 Key Insights
The core principle of this strategy hinges on misleading other traders. A sudden market movement against the prevailing trend that results in the formation of either a lower low or a higher high, followed by a pullback where a divergence pattern emerges, sets the stage.
Subsequently, the market may form another lower low or higher high. Traders, persuaded that the market will continue along the trajectory of the new movement, are caught off-guard when the price abruptly reverses direction. Following a "Stop Hunt" of the traders' open positions, the market resumes its initial trend.
To grasp the essence of this setup, observe the following illustrations.
"Bullish Setup" :
"Bearish Setup" :
🔵 How to Use
The setups can be customized based on the desired formation period. This adjustment can be made through the indicator's price setting options, where the default period is set at 2.
Upon configuring your preferred period, the signals become actionable. Once a setup forms, the subsequent step involves waiting for the price to reach the "Order Block".
"Bullish Setup" :
"Bearish Setup" :
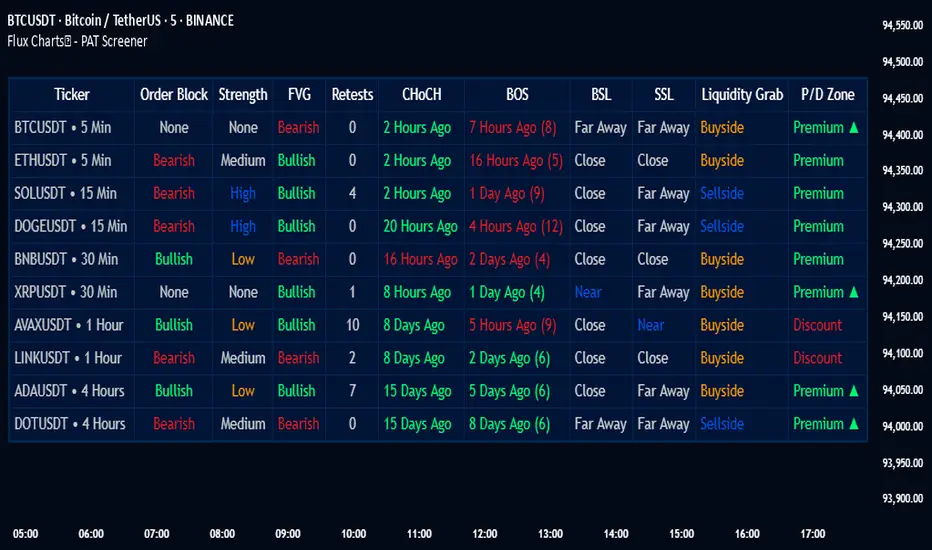
PAT Screener | Flux Charts💎 GENERAL OVERVIEW
Introducing our new Price Action Toolkit (PAT) Screener! This screener can spot trading opportunities that Price Action Toolkit offers across 8 different tickers! We believe that this screener will help you take a glimpse of the current state of the market much easier.
Features of the new Price Action Toolkit (PAT) Screener :
Finds Latest Across 8 Tickers:
Order Blocks
Breaker Blocks
Fair Value Gaps (FVG)
Inversion FVGs
Market Structures (BOS, CHoCH, CHoCH+)
Liquidity Zones
Liquidity Grabs
Premium / Discount Zones
Shows Additional Information Like :
Strength
Retests
(Bullish & Bearish) Volume
Consumption
Also :
All Features Support Tuning
Customizable Theme
📌 HOW DOES IT WORK ?
1. Order Blocks
Order blocks occur when there is a high amount of market orders exist on a price range. It is possible to find order blocks using specific formations on the chart.
The high & low volume of order blocks should be taken into consideration while determining their strengths. The determination of the high & low volume of order blocks are similar to FVGs, in a bullish order block, the high volume is the last 2 bars' total volume, while the low volume is the oldest bar's volume. In a bearish order block scenario, the low volume becomes the last 2 bars' total volume.
2. Breaker Blocks
Breaker blocks form when an order block fails, or "breaks". It is often associated with market going in the opposite direction of the broken order block, and they can be spotted by following order blocks and finding the point they get broken, i.e. price goes below a bullish order block.
The volume of a breaker block is simply the total volume of the bar that the original order block is broken. Often the higher the breaking bar's volume, the stronger the breaker block is.
The strength of Order & Breaker Blocks are calculated by the size of the block to the Average True Range (ATR) of the chart.
3. Fair Value Gaps
Fair value gaps often occur when there is an imbalance in the market, and can be spotted with a specific formation on the chart.
The volume when the FVG occurs plays an important role when determining the strength of it, so we've placed two bars on the FVG zone, indicating the high & low volumes of the FVG. The high volume is the total volume of the last two bars on a bullish FVG, while the low volume is - of the FVG. For a bearish FVG, the total volume of the last two bars is the low volume. The indicator can also detect FVGs that exist in other timeframes than the current chart.
4. Inversion Fair Value Gaps
A Fair Value Gap generally occur when there is an imbalance in the market. They can be detected by specific formations within the chart. An Inverse Fair Value Gap is when a FVG becomes invalidated, thus reversing the direction of the FVG.
IFVGs get consumed when a Close / Wick enters the IFVG zone. Check this example:
5. Market Structures
Sometimes specific market structures form and break as the market fills buy & sell orders. Formed Change of Character (CHoCH) and Break of Structure (BOS) often mean that market will change direction, and they can be spotted by inspecting low & high pivot points of the chart.
The number of times the chart recently had a BOS is displayed between brackets, Ex : (3)
6. Liquidity Zones
Buyside & Sellside Liquidity zones are where most traders place their take-profits and stop-losses in their long / short positions. They are spotted by using high & low pivot points on the chart.
7. Liquidity Grabs
Liquidity grabs occur when one of the latest pivots has a false breakout. Then, if the wick to body ratio of the bar is higher than 0.5 (can be changed from the settings) a liquidity grab has occurred.
8. Premium & Discount Zones
The premium zone is a zone that is over the fair value of the asset's price, and the discount zone is the opposite. They are formed by the latest high & low pivot points.
If the latest close price is outside the Premium or Discount zone, you will see "Premium ⬆️" or "Discount ⬇️". These mean that the price is currently higher than the premium zone or lower than the discount zone.
🚩UNIQUENESS
This screener offers a comprehensive dashboard for traders, combining multiple analytical elements with customizable settings to aid in decision-making across different tickers and timeframes. We believe that this will help traders spot trading opportunities much easier by providing crucial information in a single dashboard. Our new screener contains of common elements like Order & Breaker Blocks, Fair Value Gaps & IFVGs as well as rather unique elements like Liquidity Grabs . With the use of up to 8 tickers & timeframes , you can easily take a look at the bigger picture of the market. We recommend reading the "How Does It Work" section of the description to get a better understanding about how this indicator is unique to others.
⚙️SETTINGS
1. Tickers
You can set up to 8 tickers for the screener to scan here. You can also enable / disable them and set their individual timeframes.
You can enable / disable Retests, Strength, Consumption and (Bullish & Bearish) Volume for :
Order Blocks (Retests, Strength, Bullish & Bearish Volume)
Breaker Blocks (Retests, Strength, Volume)
Fair Value Gaps (Retests, Consumption, Strength, Bullish & Bearish Volume)
Inversion Fair Value Gaps (Retests, Consumption, Strength, Volume)
2. Order Blocks
Enabled -> Enables / Disables Order Blocks
Zone Invalidation -> Select between Wick & Close price for Order Block Invalidation.
Swing Length -> Swing length is used when finding order block formations. Smaller values will result in finding smaller order blocks.
3. Breaker Blocks
Enabled -> Enables / Disables Breaker Blocks
Zone Invalidation -> Select between Wick & Close price for Breaker Block Invalidation.
4. Fair Value Gaps
Enabled -> Enables / Disables Fair Value Gaps
Zone Invalidation -> Select between Wick & Close price for FVG Zone Invalidation.
Zone Filtering -> With "Average Range" selected, algorithm will find FVG zones in comparison with average range of last bars in the chart. With the "Volume Threshold" option, you may select a Volume Threshold % to spot FVGs with a larger total volume than average.
FVG Detection -> With the "Same Type" option, all 3 bars that formed the FVG should be the same type. (Bullish / Bearish). If the "All" option is selected, bar types may vary between Bullish / Bearish.
Detection Sensitivity -> You may select between Low, Normal or High FVG detection sensitivity. This will essentially determine the size of the spotted FVGs, with lower sensitivities resulting in spotting bigger FVGs, and higher sensitivities resulting in spotting all sizes of FVGs.
5. Inversion Fair Value Gaps
Zone Invalidation -> Select between Wick & Close price for IFVG Zone Invalidation. This setting also switches the type for IFVG consumption.
6. Market Structures
Break Of Structure (BOS) -> If the current structure of the market is broken in a bullish or bearish direction, it will be displayed.
Change Of Character (CHoCH) -> If the market shifts into another direction, it will be displayed.
Change Of Character+ (CHoCH+) -> This will display Change Of Characters detected with higher sensitivity if enabled.
7. Liquidity Zones
Buyside Liquidity -> Enables / Disables Buyside Liquidity
Sellside Liquidity -> Enables / Disables Sellside Liquidity
8. Liquidity Grabs
Pivot Length -> This setting determines the range of the pivots. This means a candle has to have the highest / lowest wick of the previous X bars and the next X bars to become a high / low pivot.
Wick-Body Ratio -> After a pivot has a false breakout, the wick-body ratio of the latest candle is tested. The resulting ratio must be higher than this setting for it to be considered as a liquidity grab.
9. Premium & Discount Zones
Enabled -> Enables / Disables Premium & Discount Zones.
10. Style
You can customize the visual looks of the screener here.
Smart Money Setup 04 [TradingFinder] Three Drive (Harmonic) + OB🔵 Introduction
The "Three Drive" pattern is a well-known formation in technical analysis, recognized for its ability to signal potential trend reversals in price action. Within the realm of trading, particularly in the context of "Reversal Patterns," the Three Drive pattern holds significance as a reliable indicator of shifts in market sentiment.
🟣 Bullish 3 Drive
This pattern typically manifests at a price bottom, where a sequence of lower lows suggests a prevailing negative trend. However, within the structure of the Three Drive pattern, a notable occurrence unfolds.
The second low breaches the range of the first low, followed by the third low surpassing the range of the second low. These penetrations signify a diminishing selling pressure and an emerging buying interest.
Traders often await the confirmation of the third low surpassing the second low as an entry point, with price targets set at the highs formed within the Three Drive pattern.
🟣 Bearish 3 Drive
Conversely, the Bearish Three Drive pattern emerges at a price top, characterized by a sequence of higher highs indicating an upward trend. Yet, amidst this apparent bullish momentum, a shift occurs.
The second high breaks beyond the range of the first high, succeeded by the third high exceeding the range of the second high. These breaches signify a waning buying strength and a resurgence in selling pressure.
Entry into a trade is often executed after the confirmation of the third high surpassing the second high, with targets set at the lows formed within the Three Drive pattern.
Importance :
Understanding the Three Drive pattern's significance extends beyond mere technical analysis. It bears resemblance to other established patterns, such as the Harmonic Pattern and Ending Diagonal within the Elliott Wave Theory.
Recognizing these parallels aids traders in comprehending broader market dynamics and potential price movements.
🔵 Formation of 3 Drive in Order Block Zone
The convergence of the Three Drive pattern with the concept of the Order Block Zone introduces a nuanced layer to traders' analytical approach.
In "Price Action" methodology, Order Blocks represent areas on the price chart where significant market players, such as institutional traders, have executed notable orders.
These zones often act as barriers, with price encountering resistance or support upon reaching them.
When the Three Drive pattern forms within an Order Block Zone, it signifies a confluence of market dynamics.
The completion of the pattern within this zone suggests a potential reversal in the prevailing trend, augmented by the presence of significant institutional orders.
Traders incorporate these Order Blocks into their analysis to identify probable levels where price may change direction, enhancing the reliability of their trading decisions.
🔵 How to Use :
To effectively utilize the Three Drive pattern within the Order Block Zone, traders seek alignment between the completion of the pattern and the presence of significant Order Blocks.
This convergence enhances the reliability of the pattern's signals, increasing the likelihood of successful trade outcomes.
Bullish Three Drive in Demand Zone :
Bearish Three Drive in Supply Zone :
Settings :
You can set your desired "Pivot Period" via settings for the indicator to identify setups based on it.

[UST] Protein+Support/Resistance Script: A Comprehensive Overview
Thanks to Pmgjiv for providing the foundation to this improved Version.
In the world of trading, having a robust support and resistance analysis tool can make a significant difference in decision-making and overall strategy. Let's delve into the enhancements made to the support/resistance script and how each component contributes to a trader's arsenal:
Changes and improvements made for the script to help Traders make better rational decisions in their Trading:
1. Multiple Timeframes:
Integrating multiple timeframes into the analysis provides a multi-dimensional view of the market. Traders can now assess price action across different time horizons simultaneously. This feature allows for a deeper understanding of market dynamics and helps in identifying significant support and resistance levels across various timeframes.
2. Timeframe Labels Inside Zones:
By including timeframe labels within the zones, traders can easily identify the origin of each support or resistance level. This contextual information enhances clarity and facilitates more informed decision-making, especially when navigating through multiple timeframes.
3. Visual Zone Update:
Visual updates on zones enable traders to track changes in support and resistance levels in real-time. This dynamic feature enhances the analytical process by providing immediate insights into evolving market conditions, thereby enabling traders to adapt their strategies accordingly.
4. Zones Hit:
Understanding the frequency and intensity of zone hits offers valuable insights into the strength and relevance of support and resistance levels. Traders can gauge the significance of each zone based on its historical interaction with price, thereby gaining a deeper understanding of market sentiment and potential trading opportunities.
5. Option to Turn off Current Timeframe:
The ability to toggle off the current timeframe streamlines chart analysis by focusing only on the most critical support and resistance zones. This decluttering feature helps traders prioritize key levels, reducing cognitive overload and enhancing decision-making efficiency.
Explanation of Additional Functions:
a. Lookback:
The 'lookback' parameter allows traders to customize the age of support and resistance zones based on their trading style and preferences. By adjusting the lookback setting, traders can choose whether to prioritize recent price action or consider historical data, thus tailoring the analysis to their specific trading strategies.
b. Swinglength:
Swinglength determines the sensitivity of the support and resistance zones. By modifying this parameter, traders can control how aggressively the script identifies pivot points. A higher swinglength value results in smoother, more stable zones, whereas a lower value increases sensitivity, capturing smaller price movements.
c. ZigZag Indicator:
The ZigZag indicator plays a pivotal role in identifying significant price reversals. Its period setting determines the number of price bars considered before confirming a pivot point. Traders can utilize this indicator to identify key turning points in the market, aiding in the identification of robust support and resistance levels.
Impact of Sensitivity on Zones:
Adjusting the sensitivity of the ZigZag indicator directly influences the identification and delineation of support and resistance zones. Higher sensitivity levels result in fewer but more robust zones, capturing significant price movements. Conversely, lower sensitivity levels yield more zones, accommodating smaller price fluctuations but potentially introducing noise into the analysis.
d. S/R Range:
The ability to adjust the width of support and resistance zones allows traders to customize the breadth of key areas on a chart. Choosing a wider range encompasses a broader spectrum of prices, thereby identifying more comprehensive support and resistance levels. This flexibility enables traders to adapt their analysis to different market conditions and trading strategies.
Utilization in Trading:
Comprehensive Analysis: By incorporating multiple timeframes, traders gain a holistic view of market dynamics, enabling them to identify high-probability trading opportunities across various horizons.
Contextual Understanding: Timeframe labels within zones provide context, helping traders understand the significance of each level in relation to different timeframes and market conditions.
Real-time Adaptability: Visual zone updates facilitate real-time analysis, allowing traders to adjust their strategies promptly in response to changing market conditions.
Informed Decision-making: By considering zone hits, traders can assess the strength and relevance of support and resistance levels, enhancing their ability to make informed trading decisions.
Customized Analysis: Adjustable parameters such as lookback, swinglength, and sensitivity empower traders to tailor the analysis to their individual trading styles and preferences, enhancing precision and effectiveness.
In summary, these enhancements to the support/resistance script provide traders with a powerful toolkit for analyzing market dynamics, identifying key levels, and executing well-informed trading strategies across various timeframes and market conditions.

STIC bullish and bearish hunter with FVGSmart Trading and Investment Companion (STIC) is a sophisticated tool designed to identify and visualize inducement, market structure, market trends, track liquidity, and project and forecast price action for all applicable assets. it has been tested to work on all timeframes and has been traded on stock, forex, and crypto assets.
This script is an upgraded version of previous STIC indicator, which you can use in addition to it or separately as you deem fit
Traders/ investor that are familiar with market structure, inducement, candlestick psychology, trend-following indicatorsand Fair Value Gap FVG will find it easy to adopt this trading and investment companion. As stated below, this is how it works.
Features and how to use
1st of all, after adding the indicator to yoursuperchart, you want to endusre to set your to so as to enable you see the text labeling clearly. to do that, after adding the indicator to your chart, right click it on the list, you will se the Visual order option.
Special Extreme Alert!
By analyzing the trends and dimensions, we are able to predict market extremes conditions, especially in pump and dump scenarios. (the bullish or bearish P/D extreme alerts).
Market flip arrow
The arrows trigger to indicate when the market flips to bullish (green) or bearish (red) conditions. note that this arrow is just a market flip confirmation and it it triggered by market trends, it does not come one time and sometimes later after market trigger conditions had been met.
circled in white.
Buy or sell potential {The tiny yelow(sell) and blue(buy) triangle}
By analyzing market extreme conditions, market sentiment, and liquidity, the buy/sell potential alert trigger is able to determine the state of the market, This can and should be used in combination with the market flip line (MFL) [the yellow line from , market flip trigger (MFT) (purple line), and market support/resistance line (MSR)(blue line) .
Market flip Line (Blue line) (MFL): the MFL is useful to also understand the market phase; a candle close above the MFL is bullish, while a candle close Below, the MFL is bearish. You are, however, expected to experience market retests and rejections coupled with support and resistance to follow through with the predicted direction. Patience is a valuable virtue in trading.
Extended sell or buy hunt (Red and Green Triangle)
this is real-time triangles indicator just like every other indicator on theis chart that indicates the market direction labeled with buy and sell. Note that the market-extended extreme can occur multiple times in the same direction. Hence, we'll advise having multiple trade entries.
The flip support line
Market Flip Trigger Line (MFTL) (Magenta): When the market crosses and closes below or above the Market Flip Trigger Line, you should wait for a confirmation. a confirmation is usually a retest or rejection of the line. A candle close and reject indicates the market as flip direction and it is going for a correction or major reversal. it is applicable on all timeframe.
As mentioned earlier, if you understand market structure and sentiment, using the uFVG, iFVG, upLQTY, downLQTY and BOS will be easy. however, this is how it works, you may need tohave and expanded readbout market structure for additional knowledge.
upLQTY (Bullish liquidity inducement)
The indicator appear at the close and confirmation on the 3rd candle and it is extended to only appear on 200 bars applicable on all timeframes.
This is a bullish sentiment and liquidty inducement order block that occurs, leading to the break of trend structure and change of character. Meaning the market sentiment as change which is backed up by liquidity in that region, which mostly gets filled, especially on lower timeframes before the price action continues. If price revese breaks and hold above this region, it invalidates the order block. This will always appear when there is a confirmed change of character CHoCH to the bullish side.
downLQTY (Bearish liquidity inducement) The indicator appear at the close and confirmation on the 3rd candle and it is extended to only appear on 200 bars applicable on all timeframes. It is and inverse of the upLQTY.
like order block, these are supply and demand zones that has the potential to change the direction of a trade. This is a bearish order block that occurs, leading to the break of structure and change of character. Meaning there is bearish liquidity yet to be accounted for in the region, which mostly gets filled, especially on lower timeframes before the price action continues. If broken, it invalidates the order block. This will always appear when there is a confirmed change of character from CHoCH to the bearish side.
Fair Value Gap
From general knowledge, FVG also know as Fair value gaps are inbalnace created by a 3 candlestick pattern where the top of the bottom candles doesn't cross the bottom of the top candle. like order block, these are supply and demand zones that has the potential to change the direction of a trade. This mostly indicate the presense of big plays in the market. for STIC indicator, FVG are labeled as listed below;
UFVG, also FVGup, {Colour green box} = bullish imbalance fair value gap
IFVG, aka FVGdown, {Red box} = bearish imbalance fair value gap
OIFVG, {Yellow box, no label} = other imbalances fair value gab
You should not that FG has upper, lower and middle band, any of the this area can be induced and filled by price.
Alert Conditions!
Buy alert conditions
- Any bullish buy alert
- Bullish hunt
- Re-entry Buy
- Sharp Market Sell rejection
- Buy potential
- upLQTY
Long position Exit conditions
- ExtremeB
- Profit
- Sell hunt
The Entry, exit and trail profit alert trigger should be used as position exit conditions either for a Long (Buy) or Short (Sell) situation and should be set as OPB (Once Per Bar). Using it as entry for exit or vice versa as shown not to be very profitable. hence the need to combine with other order entry alerts like the Any bullish or Bearish alerts
Sell alert conditions ( NOTE: All Sell alert are not yet included in this current version as this is targeted towards bullrun.)
- Sell potential
- Sell triangle (Sell hunt)
- downLQTY
and any trail profit alert, this alert put into consideration all the conditions required to trail profit.
Risk management advice
Patience and a good risk management strategy are required to be profitable trader using this tool. You need to ensure not to overleverage, and you should have multiple entries in case the buy coditions/alert shows again below the previous buy alert before a sell condition/alert occurs.

Smart Money Setup 03 [TradingFinder] Minor OB & Trend Proof🔵 Introduction
The "Smart Money Concept" transcends mere technical trading strategies; it embodies a comprehensive philosophy elucidating market dynamics. Central to this concept is the acknowledgment that influential market participants manipulate price actions, presenting challenges for retail traders.
As a "retail trader", aligning your strategy with the behavior of "Smart Money," primarily market makers, is paramount. Understanding their trading patterns, which revolve around supply, demand, and market structure, forms the cornerstone of your approach. Consequently, decisions to enter trades should be informed by these considerations.
🟣 Important Note
In this setup, pattern formation revolves around the robustness of the "Stop Hunt" targeting retail traders.
When this stop hunt occurs, if the price tests below the minor pivot or above the minor pivot, a "Minor Order Block" is formed.
Similarly, if the price tests below the major pivot or above the major pivot, a "Major Order Block" is formed.
Since the price hasn't successfully broken the major pivots before breaking the Top or Bottom, it can be inferred that the minor pivots formed within a leg of price movement exhibit a "Range" structure.
For a deeper comprehension of this setup, refer to the accompanying visual aids below.
Bullish Setup Details :
Bearish Setup Details :
🔵 How to Use
Upon integrating the indicator into your chart, exercise patience as you await the evolution of the trading setup.
Experiment with different trading positions by adjusting both the "Time Frame" and "Pivot Period". Typically, setups materializing over longer "Time Frames" and "Pivot Periods" carry heightened validity.
Bullish Setup Details on Chart :
Bearish Setup Details on Chart :
Within the settings, you possess the flexibility to modify the "Pivot Period" input to tailor the indicator to your preferences.

Dynamic Order Blocks [LuxAlgo]The Dynamic Order Blocks indicator displays the most recent unmitigated bullish and bearish order blocks on the chart, providing dynamic support/resistance areas.
When price sweeps an order block, this is highlighted by the script indicating a potential reversal.
The average between the displayed order blocks is also displayed.
🔶 USAGE
Order blocks are a popular method of price action analysis, representing price areas where more significant market participants accumulate their orders.
Displaying order blocks dynamically allows obtaining relevant areas of support/resistance. Users can obtain longer-term order blocks using a higher "Swing Lookback" setting.
Users can also use mitigation events to assess the current trend direction, with price mitigating a bearish order block (breaking above the upper extremity) indicating an uptrend, and price mitigating a bullish order block (breaking below the lower extremity) indicating a downtrend.
🔹 Average Level
An average level obtained from the displayed bullish and bearish order blocks is included in the indicator and offers an additional polyvalent dynamic support/resistance level.
The change of direction of the average line can also be indicative of the current trend direction.
🔹 Dynamic Sweeps
Price sweeping the mitigation level of an order block is highlighted on the chart using bordered rectangles. These highlight a breakout failure and can be indicative of a potential reversal.
🔶 SETTINGS
Swing Lookback: Period of the swing detection used to construct order blocks. Higher values will return longer-term order blocks.
Use Candle Body: Use the candle body as the order block area instead of the candle full range.

Smart Money Setup 02 [TradingFinder] Mitigated Major OB Proof🔵 Introduction
"Smart money" is money invested by knowledgeable individuals at the right time, and this investment can yield the highest returns.
The concept we focus on in this indicator is whether the market is in an uptrend or downtrend. The market briefly takes a weak and reversal trend with "Minor BoS" without being able to break the major pivot.
In the next step, it returns to its main trend with a strong bullish move and continues its trend with a "Major BoS". The "order block" behind this rapid and powerful movement can be a valid order block for trading.
To better understand this setup, please refer to the explanations in the two images below.
Bullish Setup Details :
Bearish Setup Details :
🔵 How to Use
After adding the indicator to the chart, you should wait for trading opportunities to form. By changing the "Time Frame" and "Period Pivot", you can see different trading positions. In general, the lower the "Time Frame" and "Period Pivot", the higher the likelihood of forming trading opportunities.
Bullish Setup Details on Chart :
Bearish Setup Details on Chart :
You can access "Period Pivot" via settings as an input.

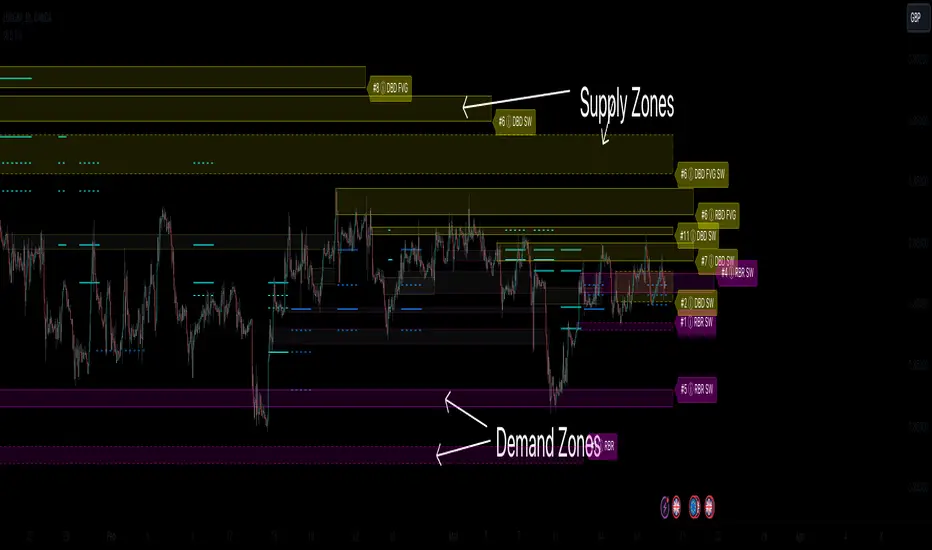
Supply & Demand Zones (Order Block) Pro [BacktestBot]Supply & Demand Zones (Order Block) Pro with DBD/RBR/RBD/DBR/FVG
This indicator helps to identify large price moves driven by banks and institutions. It can be used for any asset type (FOREX, crypto, commodities, indices) and any timeframe.
How to use this indicator
Message me to gain access. I try to reply within 24 hours.
Consider this as more of a visual aid to add to your confluences.
Use a side by side chart layout with different timeframes to see more zones.
(See example of use at the bottom)
Pullback trades are popular with zones.
⭑⭑⭑ Zones ⭑⭑⭑
How are zones created?
Supply zones are created when the price drops quickly, so are found above the price action.
Demand zones are created when the price rallies quickly, so are found below the price action.
The script uses a combination of quick price movements and user defined minimum price % changes. All user defined settings have default settings which vary depending on asset type and timeframe.
What is a strong zone?
The zones boxes have either a dashed border or a solid border. A solid border represents a strong zone which is when
the price has moved very quickly from it, or
the price has bounced off the zone multiple times.
What is a deactivated zone?
When the price has gone through the zone by a certain %, the zone is deactivated and displayed in a more transparant colour.
How are deactivated zones used for switch zones?
When a new zone is created, it is checked to see if it overlaps a recently deactivated zone.
e.g. If a new demand zone overlaps a recently deactivated supply zone, then the zone has switched from supply to demand. This might mean the new zone could be a strong one and the number of hits on the previous zone (also a potential indicator of strength) is displayed in the zone label tooltip.
Zone information
Basic zone information can be found in the zone label.
Users can choose what information is displayed in the label including the number of hits and prices.
More detailed information can be found in the zone label tooltip.
Hovering over the label will display more information including the zone start time and height %.
DBD/RBR/RBD/DBR/FVG
Zones are defined as drop base drop, rally base rally, rally base drop, drop base rally, and fair value gap.
Zone height
Users have the option of choosing
Wick to wick, or
Wick to body
The indicator does its best to meet the user preference but sometimes it is not possible. The information in the label tooltip will show if the preference was matched.
Minimum and maximum height default settings help to prevent zone boxes which might fill the whole chart.
⭑⭑⭑ Lines of Interest ⭑⭑⭑
Lines of interest are displayed as an added bonus.
Long wick
Long wicks might show areas of support or resistance. Very long and long wicks are defined by the % change in the wicks.
Very long wick lines are always displayed, and long wicks are displayed if they are not near a zone.
Possible Support / Resistance
After a big rally or drop, lines are displayed to show where the price might pullback to. These lines can act as possible support or resistance, and
are taken from recently deactivated zones. A solid line respresents a strong deactivated zone.
⭑⭑⭑ Alerts ⭑⭑⭑
Limit the number of alerts to the recommended ones. Consider this as more of a visual aid to add to your confluences.
Alert types
Early alerts happen immediately.
Bar end alerts happen when the bar closes.
Alert display
Alerts can be displayed on the chart with symbols. The most recent symbols have a tooltip which allow alert information to be displayed when hovering over them.
It is recommended to turn the alert display off, as it can clutter up the chart. The alerts will continue to work with the display off.
⭑⭑⭑ Example of use ⭑⭑⭑
Side by side chart with different timeframes
⭑⭑⭑ Disclaimer ⭑⭑⭑
Trading is very high risk. All content, tools and scripts provided by BacktestBot are for informational & educational purposes only. Past performance does not guarantee future results.
Smart Money Setup 01 [TradingFinder]Double Order Blocks Proof🔵 Introduction
The Price Action, styled as the "Smart Money Concept" or "SMC," was introduced by Mr. David J. Crouch in 2000 and is one of the most modern technical styles in the financial world. In financial markets, Smart Money refers to capital controlled by major market players (central banks, funds, etc.), and these traders can accurately predict market trends and achieve the highest profits.
In the "Smart Money" style, various types of "order blocks" can be traded. This indicator uses a type of "order block" originating from "BoS" (Breakout of Structure). The most important feature of this indicator is the confirmation of two order blocks.
🟣 Important
For example, after the first "BoS" and the formation of the first Order Block, if a second "BoS" occurs before touching the price of the first Order Block and the formation of the second Order Block, a trading setup with 2 order blocks is formed, which confirms the dominant market trend.
For a better understanding of this subject, see the explanations in the following two images.
Bullish Setup Details :
Bearish Setup Details :
🔵 How to Use
After adding the indicator to the chart, you should wait for the formation of the trading setup. You can observe different trading positions by changing the "Time Frame" and "Pivot Period." Generally, the higher the "Time Frame" and "Pivot Period," the more valid the formed setup is.
Bullish Setup Details on Chart :
Bearish Setup Details on Chart :
You can access the "Pivot Period" input through the settings.

Order Blocks Indicator [TradingFinder] Lightning|CHOCH |OB | BOS🔵 Introduction
In "Price Action," an "Order Block" is essentially an area on the price chart where significant players such as institutional traders have executed their moves by placing noteworthy orders. These points often indicate areas where price either attempts to break through (resistance) or returns when it reaches there (support).
Therefore, when discussing the identification of order blocks, we typically refer to finding points where the price has stalled for a while and has accumulated strength before making a significant move in one direction.
Essentially, order blocks assist traders in understanding where large players with "smart money" have likely placed their bulk orders in the market. Traders use these order blocks as part of their overall analysis to identify probable levels where price may change direction.
This version of the order block indicator is designed for traders, adding many indicators to their charts. The minimal design helps minimize disruptions to user focus.
🔵 Identification of Order Blocks
To identify order blocks, first, a "Level Break" must occur. To identify a "Demand Zone," a "High Level Break" is required, and to identify a "Supply Zone," a "Low Level Break" is needed.
Demand Zone :
Supply Zone :
🔵 "Change of Character" or "Market Shift Structure"
"ChoCh" or "MSS" is the "Break Level" that is contrary to the previous trend. For example, if a "Bearish Level" is established in the market and consecutive "Low Levels" are being broken, the price turns upward, breaking a "High Level." This break is called "ChoCh" or "MSS."
🔵 "Break of Structure"
"Break of Structure," or "BoS" for short, is the "Break Level" in the direction of the current trend. For example, if a "Bullish Level" is established in the market, when the price breaks a "High Level," a "BoS" has occurred.
🔵 Features
🟣 Major Level
This feature helps you easily identify major levels. These levels form when the price breaks another major level.
🟣 Refine Order Block
The "Refinement" feature allows you to adjust the width of the order block based on your strategy. There are two modes, "Aggressive" and "Defensive," in Order Block Refine. The difference between "Aggressive" and "Defensive" lies in the width of the order block. For "Risk Averse" traders, the "Defensive" mode is suitable because it provides smaller stop losses and larger reward-to-risk ratios. For "Risk Taker" traders, the "Aggressive" mode is more suitable. These traders prefer to enter trades at higher prices and this mode, where the width of the order block is greater, is more suitable for this group of individuals.
🔵 How to Use
After adding the indicator to your chart, you will see a visual similar to the image below. Green order blocks are "Demand Zones" and red order blocks are "Supply Zones." The midpoint of the order blocks also indicates 50% of it.
Refine Order Block is defaulted to On and refines the order blocks. If you want the order blocks to remain original, you should set it to Off.
Refine is defaulted to "Defensive" mode. If you want it to be in "Aggressive" mode, you should change its mode through Refine Type.
Displaying "Major Levels" is turned off by default and to display them, you should set "Show High Level" and "Show Low Level" to "Yes." You can use these lines to identify liquidity or determine stop loss and take profit levels.

Inversion Fair Value Gap Screener | Flux Charts💎 GENERAL OVERVIEW
Introducing our new Inverse Fair Value Gap Screener! This screener can provide information about the latest Inverse Fair Value Gaps in up to 5 tickers. You can also customize the algorithm that finds the Inverse Fair Value Gaps and the styling of the screener.
Features of the new Inverse Fair Value Gap (IFVG) Screener :
Find Latest Inverse Fair Value Gaps Across 5 Tickers
Shows Their Information Of :
Latest Status
Number Of Retests
Consumption Percent
Volume
Customizable Algorithm / Styling
📌 HOW DOES IT WORK ?
A Fair Value Gap generally occur when there is an imbalance in the market. They can be detected by specific formations within the chart. An Inverse Fair Value Gap is when a FVG becomes invalidated, thus reversing the direction of the FVG.
IFVGs get consumed when a Close / Wick enters the IFVG zone. Check this example:
This screener then finds Fair Value Gaps across 5 different tickers, and shows the latest information about them.
Status ->
Far -> The current price is far away from the IFVG.
Approaching ⬆️/⬇️ -> The current price is approaching the IFVG, and the direction it's approaching from.
Inside -> The price is currently inside the IFVG.
Retests -> Retest means the price tried to invalidate the IFVG, but failed to do so. Here you can see how many times the price retested the IFVG.
Consumed -> IFVGs get consumed when a Close / Wick enters the IFVG zone. For example, if the price hits the middle of the IFVG zone, the zone is considered 50% consumed.
Volume -> Volume of a IFVG is essentially the volume of the bar that broke the original FVG that formed it.
🚩UNIQUENESS
This screener can detect latest Inverse Fair Value Gaps and give information about them for up to 5 tickers. This saves the user time by showing them all in a dashboard at the same time. The screener also uniquely shows information about the number of retests and the consumed percent of the IFVG, as well as it's volume. We believe that this extra information will help you spot reliable IFVGs easier.
⚙️SETTINGS
1. Tickers
You can set up to 5 tickers for the screener to scan Fair Value Gaps here. You can also enable / disable them and set their individual timeframes.
2. General Configuration
FVG Zone Invalidation -> Select between Wick & Close price for FVG Zone Invalidation.
IFVG Zone Invalidation -> Select between Wick & Close price for IFVG Zone Invalidation. This setting also switches the type for IFVG consumption.
Zone Filtering -> With "Average Range" selected, algorithm will find FVG zones in comparison with average range of last bars in the chart. With the "Volume Threshold" option, you may select a Volume Threshold % to spot FVGs with a larger total volume than average.
FVG Detection -> With the "Same Type" option, all 3 bars that formed the FVG should be the same type. (Bullish / Bearish). If the "All" option is selected, bar types may vary between Bullish / Bearish.
Detection Sensitivity -> You may select between Low, Normal or High FVG detection sensitivity. This will essentially determine the size of the spotted FVGs, with lower sensitivities resulting in spotting bigger FVGs, and higher sensitivities resulting in spotting all sizes of FVGs.

Market Structures Screener | Flux Charts💎 GENERAL OVERVIEW
Introducing our new Market Structures Screener! This screener can provide information about the latest market structures in up to 5 tickers. You can also customize the styling of the screener.
Features of the new Market Structures Screener :
Find Latest Market Structures Across 5 Tickers
Break Of Structure (BOS)
Change of Character (CHoCH)
Change of Character+ (CHoCH+)
Customizable Algoritm / Styling
📌 HOW DOES IT WORK ?
Sometimes specific market structures form and break as the market fills buy & sell orders. Formed Change of Character (CHoCH) and Break of Structure (BOS) often mean that market will change direction, and they can be spotted by inspecting low & high pivot points of the chart.
This screener then finds market structures across 5 different tickers, and shows the latest information about them.
🚩UNIQUENESS
Formed market structures can be strong hints about the current direction and the state of the market, and our screener has the ability to detect Change Of Character structures of the market with higher sensitivity (CHoCH+), so you will miss less hints. This screener will then show the elapsed time of the found BOS, CHoCH and CHoCH+ structures.
⚙️SETTINGS
1. Tickers
You can set up to 5 tickers for the screener to scan market structures here. You can also enable / disable them and set their individual timeframes.

ICT Concept [TradingFinder] Order Block | FVG | Liquidity Sweeps🔵 Introduction
The "ICT" style is one of the subsets of "Price Action" technical analysis. ICT is a method created by "Michael Huddleston", a professional forex trader and experienced mentor. The acronym ICT stands for "Inner Circle Trader".
The main objective of the ICT trading strategy is to combine "Price Action" and the concept of "Smart Money" to identify optimal entry points into trades. However, finding suitable entry points is not the only strength of this approach. With the ICT style, traders can better understand price behavior and adapt their trading approach to market structure accordingly.
Numerous concepts are discussed in this style, but the key practical concepts for trading in financial markets include "Order Block," "Liquidity," and "FVG".
🔵 How to Use
🟣Order Block
Order blocks are a specific type of "Supply and Demand" zones formed when a series of orders are placed in a block. These orders could be created by banks or other major players. Banks typically execute large orders in blocks during their trading sessions. If they were to enter the market directly with a small quantity, significant price movements would occur before the orders are fully executed, resulting in less profit. To avoid this, they divide their orders into smaller, manageable positions. Traders should look for "buy" opportunities in "demand order blocks" areas and "sell" opportunities in "supply order blocks".
🟣Liquidity
These levels are where traders aim to exit their trades. "Market Makers" or smart money usually collects or distributes their trading positions near levels where many retail traders have placed their "Stop Loss" orders. When the liquidity resulting from these losses is collected, the price often reverses direction.
A "Stop Hunt" is a move designed to neutralize liquidity generated by triggered stop losses. Banks often use significant news events to trigger stop hunts and acquire the liquidity released in the market. If, for example, they intend to execute heavy buy orders, they encourage others to sell through stop hunts.
As a result, if there is liquidity in the market before reaching the order block region, the credibility of that order block is higher. Conversely, if liquidity is near the order block, meaning the price reaches the order block before reaching the liquidity area, the credibility of that order block is lower.
🟣FVG (Fair Value Gap)
To identify the "Fair Value Gap" on the chart, one must analyze candle by candle. Focus on candles with large bodies, examining one candle and the one before it. The candles before and after this central candle should have long shadows, and their bodies should not overlap with the body of the central candle. The distance between the shadows of the first and third candles is called the FVG range.
These zone function in two ways :
•Supply and Demand zone: In this case, the price reacts to these zone, and its trend reverses.
•Liquidity zone: In this scenario, the price "fills" the zone and then reaches the order block.
Important Note: In most cases, FVG zone with very small width act as supply and demand zone, while zone with a significant width act as liquidity zone, absorbing the price.
🔵 Setting
🟣Order Block
Refine Order Block : When the option for refining order blocks is Off, the supply and demand zones encompass the entire length of the order block (from Low to High) in their standard state and remain unaltered. On the option for refining order blocks triggers the improvement of supply and demand zones using the error correction algorithm.
Refine Type : The enhancement of order blocks via the error correction algorithm can be executed through two methods: Defensive and Aggressive. In the Aggressive approach, the widest possible range is taken into account for order blocks.
Show High Levels : If major high levels are to be displayed, set the option for showing high level to Yes.
Show Low Levels : If major low levels are to be displayed, set the option for showing low level to Yes.
Show Last Support : If showing the last support is desired, set the option for showing last support to Yes.
Show Last Resistance : If showing the last resistance is desired, set the option for showing last resistance to Yes.
🟣 FVG
FVG Filter : When FVG filtering is activated, the number of FVG areas undergoes filtration based on the specified algorithm.
FVG Filter Types :
1. Very Aggressive : Apart from the initial condition, an additional condition is introduced. For an upward FVG, the maximum price of the last candle should exceed the maximum price of the middle candle. Similarly, for a downward FVG, the minimum price of the last candle should be lower than the minimum price of the middle candle. This mode eliminates a minimal number of FVGs.
2. Aggressive : In addition to the conditions of the Very Aggressive mode, this mode considers the size of the middle candle; it should not be small. Consequently, a larger number of FVGs are eliminated in this mode.
3. Defensive : Alongside the conditions of the Very Aggressive mode, this mode takes into account the size of the middle candle, which should be relatively large with the majority of it comprising the body. Furthermore, to identify upward FVGs, the second and third candles must be positive, whereas for downward FVGs, the second and third candles must be negative. This mode filters out a considerable number of FVGs, retaining only those of suitable quality.
4. Very Defensive : In addition to the conditions of the Defensive mode, the first and third candles should not be very small-bodied doji candles. This mode filters out the majority of FVGs, leaving only the highest quality ones. Show Demand FVG: Enables the display of demand-related boxes, which can be toggled between off and on. Show Supply FVG: Enables the display of supply-related boxes along the path, which can also be toggled between off and on.
🟣 Liquidity
Statics Liquidity Line Sensitivity : A value ranging from 0 to 0.4. Increasing this value reduces the sensitivity of the "Statics Liquidity Line Detection" function and increases the number of identified lines. The default value is 0.3.
Dynamics Liquidity Line Sensitivity : A value ranging from 0.4 to 1.95. Increasing this value enhances the sensitivity of the "Dynamics Liquidity Line Detection" function and decreases the number of identified lines. The default value is 1.
Statics Period Pivot : Default value is set to 8. By adjusting this value, you can specify the period for static liquidity line pivots.
Dynamics Period Pivot : Default value is set to 3. By adjusting this value, you can specify the period for dynamic liquidity line pivots.
You can activate or deactivate liquidity lines as necessary using the buttons labeled "Show Statics High Liquidity Line," "Show Statics Low Liquidity Line," "Show Dynamics High Liquidity Line," and "Show Dynamics Low Liquidity Line".

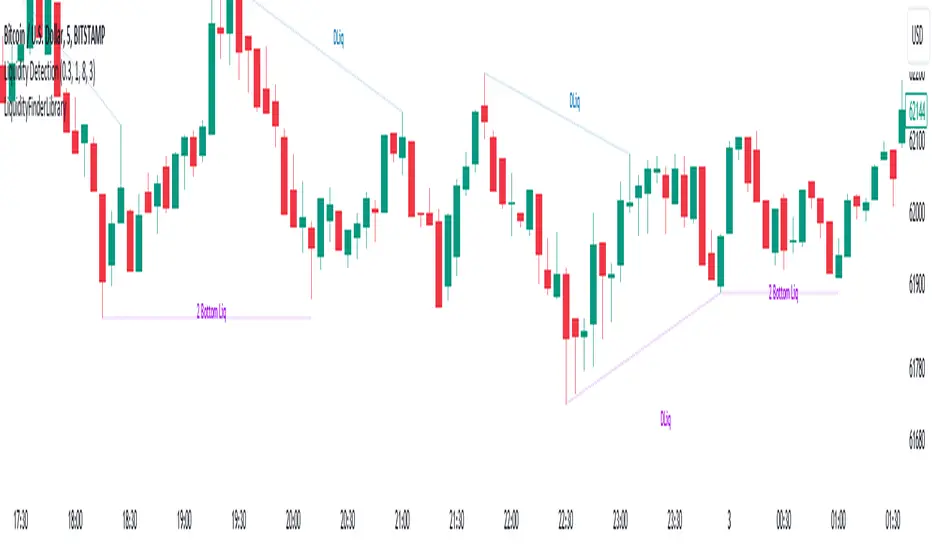
Liquidity Finder🔵 Introduction
The concept of "liquidity pool" or simply "liquidity" in technical analysis price action refers to areas on the price chart where stop losses accumulate, and the market, by reaching those areas and collecting liquidity (Stop Hunt), provides the necessary energy to move the price. This concept is prominent in the "ICT" and "Smart Money" styles. Imagine, as depicted below, the price is at a support level. The general trader mentality is that there is "demand" for the asset at this price level, and this demand will outweigh "supply" as before. So, it is likely that the price will increase. As a result, they start buying and place their stop loss below the support area.
Stop Hunt areas are essentially traders' "stop loss" levels. These are the liquidity that institutional and large traders need to fill their orders. Consequently, they penetrate the price below support areas or above resistance areas to touch their stop loss and fill their orders, and then the price trend reverses.
Cash zones are generally located under "Swings Low" and above "Swings High." More specifically, they can be categorized as support levels or resistance levels, above Double Top and Triple Top patterns, below Double Bottom and Triple Bottom patterns, above Bearish Trend lines, and below Bullish Trend lines.
Double Top and Triple Top :
Double Bottom and Triple Bottom :
Bullish Trend line and Bearish Trend line :
🔵 How to Use
To optimally use this indicator, you can adjust the settings according to the symbol, time frame, and your needs. These settings include the "sensitivity" of the "liquidity finder" function and the swing periods related to static and dynamic liquidity lines.
"Statics Liquidity Line Sensitivity" is a number between 0 and 0.4. Increasing this number decreases the sensitivity of the "Statics Liquidity Line Detection" function and increases the number of lines identified. The default value is 0.3.
"Dynamics Liquidity Line Sensitivity" is a number between 0.4 and 1.95. Increasing this number increases the sensitivity of the "Dynamics Liquidity Line Detection" function and decreases the number of lines identified. The default value is 1.
"Statics Period Pivot" is set to 8 by default. By changing this number, you can specify the period for the static liquidity line pivots.
"Dynamics Period Pivot" is set to 3 by default. By changing this number, you can specify the period for the dynamic liquidity line pivots.
🔵 Settings
Access to adjust the inputs of Static Dynamic Liquidity Line Sensitivity, Dynamics Liquidity Line Sensitivity, Statics Period Pivot, and Dynamics Period Pivot is possible from this section.
Additionally, you can enable or disable liquidity lines as needed using the buttons for "Show Statics High Liquidity Line," "Show Statics Low Liquidity Line," "Show Dynamics High Liquidity Line," and "Show Dynamics Low Liquidity Line."

Liquidity Finder Library🔵 Introduction
You may intend to utilize the "Liquidity" detection capability in your indicators. Instead of writing it, you can import the "Liquidity Finder" library into your code. One of the advantages of this approach is time-saving and reduction in scripting errors.
🔵 Key Features
Identification of "Statics Liquidity"
Identification of "Dynamics Liquidity"
🔵 How to Use
Firstly, you can add the library to your code as shown in the example below :
import TFlab/LiquidityFinderLibrary/1 as Liq
The parameters of the "LLF" function are as follows :
sPP : A float variable ranging from 0 to 0.4. Increasing this number decreases the sensitivity of the "Statics Liquidity Line Detection" function and increases the number of detected lines. The default value is 0.3.
dPP : A float variable ranging from 0.4 to 1.95. Increasing this number increases the sensitivity of the "Dynamics Liquidity Line Detection" function and decreases the number of detected lines. The default value is 1.
SRs : An int variable. By default, it's set to 8. You can change this number to specify the periodicity of static liquidity pivot lines.
SRd : An int variable. By default, it's set to 3. You can change this number to specify the periodicity of dynamic liquidity pivot lines.
ShowHLLs : A bool variable. You can enable or disable the display of "High Statics Liquidity Line".
ShowLLLs : A bool variable. You can enable or disable the display of "Low Statics Liquidity Line".
ShowHLLd : A bool variable. You can enable or disable the display of "High Dynamics Liquidity Line".
ShowLLd : A bool variable. You can enable or disable the display of "High Dynamics Liquidity Line".
🟣Recommendation
You can use the following code snippet to import Liquidity Finder into your code for time-saving.
//import Library
import TFlab/LiquidityFinderLibrary/1 as Liq
//input
SLLS = input.float(0.30 , 'Statics Liquidity Line Sensitivity', maxval = 0.4 ,minval = 0.0, step = 0.01) // Statics Liquidity Line Sensitivity
DLLS = input.float(1.00 , 'Dynamics Liquidity Line Sensitivity', maxval = 1.95 ,minval = 0.4, step = 0.01) // Dynamics Liquidity Line Sensitivity
SPP = input.int(8 , 'Statics Period Pivot') // Statics Period Pivot
DPP = input.int(3 , 'Dynamics Period Pivot') // Dynamics Period Pivot
ShowSHLL = input.bool(true , 'Show Statics High Liquidity Line')
ShowSLLL = input.bool(true , 'Show Statics Low Liquidity Line')
ShowDHLL = input.bool(true , 'Show Dynamics High Liquidity Line')
ShowDLLL = input.bool(true , 'Show Dynamics Low Liquidity Line')
//call function
Liq.LLF(SPP,DPP,SLLS,DLLS,ShowSHLL,ShowSLLL,ShowDHLL,ShowDLLL)
BigBeluga - BacktestingThe Backtesting System (SMC) is a strategy builder designed around concepts of Smart Money.
What makes this indicator unique is that users can build a wide variety of strategies thanks to the external source conditions and the built-in one that are coded around concepts of smart money.
🔶 FEATURES
🔹 Step Algorithm
Crafting Your Strategy:
You can add multiple steps to your strategy, using both internal and external (custom) conditions.
Evaluating Your Conditions:
The system evaluates your conditions sequentially.
Only after the previous step becomes true will the next one be evaluated.
This ensures your strategy only triggers when all specified conditions are met.
Executing Your Strategy:
Once all steps in your strategy are true, the backtester automatically opens a market order.
You can also configure exit conditions within the strategy builder to manage your positions effectively.
🔹 External and Internal build-in conditions
Users can choose to use external or internal conditions or just one of the two categories.
Build-in conditions:
CHoCH or BOS
CHoCH or BOS Sweep
CHoCH
BOS
CHoCH Sweep
BOS Sweep
OB Mitigated
Price Inside OB
FVG Mitigated
Raid Found
Price Inside FVG
SFP Created
Liquidity Print
Sweep Area
Breakdown of each of the options:
CHoCH: Change of Character (not Charter) is a change from bullish to bearish market or vice versa.
BOS: Break of Structure is a continuation of the current trend.
CHoCH or BOS Sweep: Liquidity taken out from the market within the structure.
OB Mitigated: An order block mitigated.
FVG Mitigated: An imbalance mitigated.
Raid Found: Liquidity taken out from an imbalance.
SFP Created: A Swing Failure Pattern detected.
Liquidity Print: A huge chunk of liquidity taken out from the market.
Sweep Area: A level regained from the structure.
Price inside OB/FVG: Price inside an order block or an imbalance.
External inputs can be anything that is plotted on the chart that has valid entry points, such as an RSI or a simple Supertrend.
Equal
Greather Than
Less Than
Crossing Over
Crossing Under
Crossing
🔹 Direction
Users can change the direction of each condition to either Bullish or Bearish. This can be useful if users want to long the market on a bearish condition or vice versa.
🔹 Build-in Stop-Loss and Take-Profit features
Tailoring Your Exits:
Similar to entry creation, the backtesting system allows you to build multi-step exit strategies.
Each step can utilize internal and external (custom) conditions.
This flexibility allows you to personalize your exit strategy based on your risk tolerance and trading goals.
Stop-Loss and Take-Profit Options:
The backtesting system offers various options for setting stop-loss and take-profit levels.
You can choose from:
Dynamic levels: These levels automatically adjust based on market movements, helping you manage risk and secure profits.
Specific price levels: You can set fixed stop-loss and take-profit levels based on your comfort level and analysis.
Price - Set x point to a specific price
Currency - Set x point away from tot Currency points
Ticks - Set x point away from tot ticks
Percent - Set x point away from a fixed %
ATR - Set x point away using the Averge True Range (200 bars)
Trailing Stop (Only for stop-loss order)
🔶 USAGE
Users can create a variety of strategies using this script, limited only by their imagination.
Long entry : Bullish CHoCH after price is inside a bullish order block
Short entry : Bearish CHoCH after price is inside a bearish order block
Stop-Loss : Trailing Stop set away from price by 0.2%
Example below using external conditions
Long entry : Bullish Liquidity Prints after bullish CHoCH
Short entry : Bearish Liquidity Prints after Bearish CHoCH
Long Exit : RSI Crossing over 70 line
Short Exit : RSI Crossing over 30 line
Stop-Loss : Trailing Stop set away from price by 0.3%
🔶 PROPERTIES
Users will need to adjust the property tabs according to their individual balance to achieve realistic results.
An important aspect to note is that past performance does not guarantee future results. This principle should always be kept in mind.
🔶 HOW TO ACCESS
You can see the Author Instructions to get access.
Bezahltes Script

SMC Fake Zones + InsideBarThis indicator is useful for whom trade with "Smart Money Concept (SMC)" strategy.
It helps SMD traders to identify fake or weak zones in the chart, So they can avoid taking position in this zones.
This indicator marks "Asia session" as well as "London and New York's Lunch Time (one hour before London and NY session starts)" zones.
It also marks Inside Bar candles which SMC trades consider as order flow. You can mark every Inside Bar or only those with opposite color via setting options.
*** As we know in SMC rules
1- Supply and Demand zones in "Asia session and Lunch Times" are fake zones for SMC trading and price will engulf them in most of times.
2- "Asia session high and low" has huge liquidity and usually price sweep that in London session.
This indicator will helps traders to visually identify those Fake zones and Asia session liquidity.
* You can change session times based on your time zone in settings.
* You can set options to show all Inside Bars or only with Opposite color in settings.

FVG Detector LibraryLibrary "FVG Detector Library"
🔵 Introduction
To save time and improve accuracy in your scripts for identifying Fair Value Gaps (FVGs), you can utilize this library. Apart from detecting and plotting FVGs, one of the most significant advantages of this script is the ability to filter FVGs, which you'll learn more about below. Additionally, the plotting of each FVG continues until either a new FVG occurs or the current FVG is mitigated.
🔵 Definition
Fair Value Gap (FVG) refers to a situation where three consecutive candlesticks do not overlap. Based on this definition, the minimum conditions for detecting a fair gap in the ascending scenario are that the minimum price of the last candlestick should be greater than the maximum price of the third candlestick, and in the descending scenario, the maximum price of the last candlestick should be smaller than the minimum price of the third candlestick.
If the filter is turned off, all FVGs that meet at least the minimum conditions are identified. This mode is simplistic and results in a high number of identified FVGs.
If the filter is turned on, you have four options to filter FVGs :
1. Very Aggressive : In addition to the initial condition, another condition is added. For ascending FVGs, the maximum price of the last candlestick should be greater than the maximum price of the middle candlestick. Similarly, for descending FVGs, the minimum price of the last candlestick should be smaller than the minimum price of the middle candlestick. In this mode, a very small number of FVGs are eliminated.
2. Aggressive : In addition to the conditions of the Very Aggressive mode, in this mode, the size of the middle candlestick should not be small. This mode eliminates more FVGs compared to the Very Aggressive mode.
3. Defensive : In addition to the conditions of the Very Aggressive mode, in this mode, the size of the middle candlestick should be relatively large, and most of it should consist of the body. Also, for identifying ascending FVGs, the second and third candlesticks must be positive, and for identifying descending FVGs, the second and third candlesticks must be negative. In this mode, a significant number of FVGs are eliminated, and the remaining FVGs have a decent quality.
4. Very Defensive : In addition to the conditions of the Defensive mode, the first and third candlesticks should not resemble very small-bodied doji candlesticks. In this mode, the majority of FVGs are filtered out, and the remaining ones are of higher quality.
By default, we recommend using the Defensive mode.
🔵 How to Use
🟣 Parameters
To utilize this library, you need to provide four input parameters to the function.
"FVGFilter" determines whether you wish to apply a filter on FVGs or not. The possible inputs for this parameter are "On" and "Off", provided as strings.
"FVGFilterType" determines the type of filter to be applied to the found FVGs. These filters include four modes: "Very Defensive", "Defensive", "Aggressive", and "Very Aggressive", respectively exhibiting decreasing sensitivity and indicating a higher number of Fair Value Gaps (FVG).
The parameter "ShowDeFVG" is a Boolean value defined as either "true" or "false". If this value is "true", FVGs are shown during the Bullish Trend; however, if it is "false", they are not displayed.
The parameter "ShowSuFVG" is a Boolean value defined as either "true" or "false". If this value is "true", FVGs are displayed during the Bearish Trend; however, if it is "false", they are not displayed.
FVGDetector(FVGFilter, FVGFilterType, ShowDeFVG, ShowSuFVG)
Parameters:
FVGFilter (string)
FVGFilterType (string)
ShowDeFVG (bool)
ShowSuFVG (bool)
🟣 Import Library
You can use the "FVG Detector" library in your script using the following expression:
import TFlab/FVGDetectorLibrary/1 as FVG
🟣 Input Parameters
The descriptions related to the input parameters were provided in the "Parameter" section. In this section, for your convenience, the code related to the inputs is also included, and you can copy and paste it into your script.
PFVGFilter = input.string('On', 'FVG Filter', )
PFVGFilterType = input.string('Defensive', 'FVG Filter Type', )
PShowDeFVG = input.bool(true, ' Show Demand FVG')
PShowSuFVG = input.bool(true, ' Show Supply FVG')
🟣 Call Function
You can copy the following code into your script to call the FVG function. This code is based on the naming conventions provided in the "Input Parameter" section, so if you want to use exactly this code, you should have similar parameter names or have copied the "Input Parameter" values.
FVG.FVGDetector(PFVGFilter, PFVGFilterType, PShowDeFVG, PShowSuFVG)

FVG Detector [TradingFinder] Fair Value Gap-Imbalance-Mitigated🔵 Introduction
When the market makes a strong move in the form of a "Marubozu" or "Spike" candlestick and consecutive candles move without a retracement, the maximum place where a "FVG" or "Fair Value Gap" is created.
🔵 Definition
To describe this precisely, whenever a move occurs where the current candle does not cover the body of the previous and subsequent candles, a fair value gap is created.
Important : The significant point is that, because there is no equilibrium between buyers and sellers in these conditions, and market power is in the hands of buyers or sellers, the market is likely to move towards these areas.
An example of "FVG" in a price increase where we expect buying on the return to it.
An example of "FVG" in a downward trend where the market will move towards it in a downward direction.
🔵 How to Use
🟣 Bearish FVG
In a downward trend, "orange boxes" are drawn, which are the same and can act as "support" zones along the downward path, and we expect the price to continue its downward trend on return.
🟣 Bullish FVG
In an upward trend, "green boxes" are drawn, which are . They act exactly like support in the upward path, and we expect the price to continue its upward trend on return.
🟣 Auxiliary Definitions
Imbalance : As mentioned above, market power is in the hands of one of the two sides, buyers or sellers, and a non-equilibrium zone is created. It may be completed in whole or in part in subsequent price movements.
Mitigated : If the price returns to the "FVG" area and fills it, we call it "Mitigated," and most "pending" or "profit and loss limits" positions are executed. We will not have a specific reaction on the return of the price.
🔵 Settings
Very Aggressive : In addition to the initial condition, another condition is added. For an upward FVG, the maximum price of the last candle should be larger than the middle candle's maximum price. Similarly, for a downward FVG, the minimum price of the last candle should be smaller than the middle candle's minimum price. In this mode, a very small number of FVGs are eliminated.
Aggressive : In addition to the conditions of the Very Aggressive mode, in this mode, the size of the middle candle should not be small. In this mode, a larger number of FVGs are eliminated.
Defensive : In addition to the conditions of the Very Aggressive mode, in this mode, the size of the middle candle should be relatively large, and the majority of it should be made up of the body. Additionally, to identify upward FVGs, the second and third candles must be positive, and to identify downward FVGs, the second and third candles must be negative. In this mode, a large number of FVGs are eliminated, leaving only those with suitable quality.
Very Defensive : In addition to the conditions of the Defensive mode, the first and third candles should not be very small-bodied doji candles. In this mode, the majority of FVGs are filtered out, leaving only the highest quality ones.
🔵 Features
Show Demand FVG : Displays demand-related boxes, which can be "off" and "on."
Show Supply FVG : Displays supply-related boxes along the path, and can be turned "off" and "on."
🔵 Indicator Advantages
In this indicator, I have implemented 4 types of "filters" that allow you to select one based on the trading symbol, timeframe, etc. From "Very Aggressive" to "Very Defensive" mode, it is possible to select.
In most indicators, all FVGs are displayed, and the chart becomes full of lines. But this unique feature allows the trader to manage the drawing of boxes.
