FullPac4Trader (I.Denis)The script combines the three most important indicators on the chart.
1. A set of six moving averages ( EMA and SMA ), which can be turned on and adjusted at your discretion.
2. Indication of support and resistance levels, calculated according to the Bollinger scheme.
3. Pivot Point and the nearest goals using the Floor method with the possibility of selecting a time period.
The script version is v.1 (beta)
The development of this script will continue. Feedback and suggestions are welcome.
Sma
BANDSTrend indicator. It is based on a simple moving average, the maximum and minimum of this moving average for the period. When the moving average coincides with its maximum for the period , the trend is rising, when the moving average coincides with its minimum for the period, the trend is falling. The optimal periods should be selected for each timeframe and trading instrument.
3GBH - Multiple MA'sIncluded in this indicator:
- Fast/Slow EMA's
- Fast/Slow SMA's
- Fast/Slow WMA's
- Fast/Slow HMA's
- Fast/Slow RMA's
-----
Use of of the type of Moving Averages.
Or use them all.
-----
User-friendly.
You can change all the inputs, they are labelled for ease-of-use.
You can toggle On/Off any or all of the options.
Wide BarsSimple scripts show the wide range bars within in the look back period, visualizing the bigger momentum.
Added four exponential moving averages which define the trend of the instrument.
Wide range candles in the direction of overall trend on higher timeframes; give confluence of higher participation in the same direction.
Note : Decent volume above the average volume with wide range candle adds more value.

LIZ TIME DIMENSION (SMA)Each hourly foot can display the moving average line for the same period of time in the same color.
The average moving line that you want to see is displayed by time leg, as well as the long-term Bollinger band that should be noticed by the time leg.
1. You can get a lot of useful information at a glance by displaying the moving average line of the long-term and period setting that many traders are aware of.
○ The period setting of the moving average line displayed in each time and foot is not fixed as usual, but changed the period by time and foot, and the moving average line of the same color
is the same.
It is a moving average line of time (for example, an hourly average line and a four-hour average line).Therefore, the market price is always the same even if the time to see changes
You can see it on a scale.It doesn't happen when you look at it in five minutes, but when you look at it in four hours, it looks like a downward trend.
○ The sensitivity of the rate to the moving average line displayed is very high.
You can see how rate moves, such as trends, are determined, and you can see reality in abstract chart moves
I can feel it.Purple 24 hours (one day) moving average line with 1 minute to 4 hours of foot, Green 1 week moving average line with 5 minute to day.
The sensitivity to the Blue Monthly Movement Average Line, which is displayed from 5 mins to 5 weeks, and Red One Year Movement Average Line, which is displayed from 1 hour to 5 weeks,
is very high.
Just look at whether the rates are moving up or down the moving average line and you'll be able to decide what to look for.
○ What is the positional relation between the moving average line of seven (eight in addition to the weekly moving average line) in the short, short, medium, medium, long, and long periods?
To make the direction and intensity of the trend easier to recognize, it is colored between moving averages to be visible as short- and medium-term clouds.
The three clouds changed color to warm rising clouds and cold falling clouds, depending on the relation of the moving averages.
·Strong upward trend rates when all clouds are unified in either upward or downward direction and are arranged in the order of short-term, medium-term or long-term clouds
·The thickness of the clouds is strong, and when the thickness is increased, the trend rate is strong.
·Trendless market when clouds overlap or the colors of the clouds are mixed
• Range price when rates are moving back and forth between clouds
You can visually and intuitively understand the market conditions, such as .
○ Short-term, short-term, medium- and short-term positional relationships will indicate the timing of the entry payment and the direction of the long-short.It's also written.
In conjunction with this, the duration for which the background color should be long changes to light warm color and warm color, and the duration for short changes to light cold and cold
color.
2. The long-term Bollinger band is displayed so that you can trade with the higher time base than the time base you see.
○ You can ride on a long-term trend by detecting and entering the trend occurrence of long-term feet with short-term feet.
Buy high prices, sell low prices, relax your trend-follow-style tears, and enable stress-free entries.
○ A light, transparent gray filter is displayed between the long-term foot Bollinger band ±1σ which sets the period suitable for the time and foot.
I understand that while the rate is moving in this zone (called gray zone), it is difficult to trend and the price range is small, so it should not be taken care of.
Yes, you can use this filter to prevent deception when the volatility is not present, and if you are out of the filter, you can use the above sign.
By trading in accordance, you can invest in trend-follow tiles while avoiding losses in range markets.
○ Bollinger bands generally display six of ±1σ, ±2σ and ±3σ, but in this indicator, two are inside ±1σ and two are outside ±3σ.
We have added a total of four bands.The former sets up early entries and the latter sets up new reverse positions, expecting a market shift from overheating.
for tips on how to
○ Expansion period (expansion period) due to characteristics of the Bollinger band is a period when volatility is big for trade, and a squeeze period
(Shrinking period) I understand that the volatility is small and it is not suitable for trade.Also, it's a squeeze period, but it's not
You can seize investment opportunities by making you expect the timing to move from contraction to expansion and by watching.
※Valid time difference by series
1 minute, 5 minutes, 15 minutes, 30 minutes 1 Hour, 4 Hour, Daily, Week (Total 8 Hours)
。This is the top version of the Makenai Chart indicator.
。Bolinger band ±3σ with 200 SMA and 200 SMA as the center band is now displayed in common on each hour leg.
。Changing the setting of the foot short-term moving average line for 5 minutes 15 minutes 30 minutes 1 hour to make the short-term cloud easily twisted and to speed up the trading timing.
。Adding ultra short term and short term clouds, which are much shorter than short term clouds, we responded to the requests of traders who want to deal with the roller coaster market and
cut the profit quickly.
(Select short-term clouds, short-term clouds, and ultra-short-term clouds to be used for entry and settlement according to the trade style and the 'dissociation between price and moving average'
which varies depending on the brand, time, and market value.)
。According to the calculation of another indicator (LIZ ADX+DMI), the background has become gray synchronously for a period of inactivity and non-trading.
(In such a period, it is often difficult to follow the trend because the market price is difficult even for lower-level ones, and often it is difficult to follow the trend.)
·Many indicators are counted in one, so you can also view the free version of your account, which has three indicators to display.
The moving avarage lines are SMA. ( I have another version which has EMA lines.)
If you are interested in the invitation-only indicator, please contact us on private chat.
各時間足で同じ期間の移動平均線が同じ色で表示できます。
時間足によって見たい複数の移動平均線が表示される他、その時間足で意識すべき期間設定された長期ボリンジャーバンドも表示されます。
1.長期間でかつ多くのトレーダーが意識する期間設定の移動平均線が表示される事で
以下の有益な情報を一目で得る事ができます。
○各時間足に表示される移動平均線の期間設定は、通常のように期間を一定にするの ではなく、期間を時間足毎に変え同色の移動平均線は同じ時間の移動平均線
(例えば1時間平均線、4時間平均線というように。)としてあります。
このため、見る時間足が変わっても、相場を常に同じ尺度で眺める事ができます。
「5分足では上昇トレンドに、4時間足では下落トレンドに見える。」
という事が起こりません。
○表示される移動平均線に対するレートの感応度は非常に高く、移動平均線にレ-ト
が差し掛かると抵抗を受け反発したり移動平均線を抜けると、勢いよくトレンドが
発生するなど、レートの動きがどのようにして決まっているかを実感でき、抽象的
だったチャートの動きにリアリティーを感じる事ができます。
特に1分足から4時間足まで表示される紫24時間(1日)移動平均線、5分足から
日足まで表示される緑1週間移動平均線、5分足から週足まで表示される青1ヶ月
移動平均線、1時間足から週足まで表示される赤1年移動平均線に対する感応度は
非常に高く、それぞれの移動平均線の上下どちらでレートが推移しているかを見る
だけで、買い目線売り目線の決定ができます。
○短々期、短期、中短期、中期、中長期、長期、長々期の7本
(週足だけはそれに加え最長期の8本)の移動平均線がどのような位置関係にあるか
によってトレンドの方向と強さが認識しやすいよう移動平均線間に着色し短期雲、
中期雲として意識できるようになっています。
3つの雲は移動平均線の関係によりそれぞれ暖色の上昇雲、寒色の下落雲に色が変わり、
・全ての雲が上昇下落どちらかに統一されで短期雲、中期雲、長期雲という順に並
んでいる時は強い上昇トレンド相場
・雲の傾きがきつく厚みがしっかりしている、厚みが増している時は強いトレンド相場
・雲が重なったり、各雲の色がまちまちの時はトレンドレス相場
・雲と雲の間をレートが行ったり来たりしている時はレンジ相場
など、視覚的直感的に相場の状況が理解できます。
表示が可能な時間足は1分、5分、15分 30分、60分、4時間、1日、1週間(合計8つ)です。
※Makenai Chart Indicator の上位版です。
・200SMA,200SMAを中心バンドとするボリンジャーバンド±3σが各時間足に共通で表示されるようになりました。
・5分15分30分1時間足短期移動平均線の設定を変更し、短期雲がねじれやすくし、決済タイミングを早めました。
・短期雲よりさらに短い、超短期雲・短々期雲を追加し、ジェットコースター相場への対応、早めに利確・損切りしたいトレーダーの要望に対応しました。
(トレードスタイルに応じ、また銘柄・時間足・相場つきによって変わる『価格と移動平均線との解離』に応じ、エントリー・決済に使う短期雲・短々期雲・超短期雲を選択します。)
・別のインジケーター(LIZ ADX+DMI)の計算による、ボラティティーがなくトレードに向かない期間は、同期して背景がグレーになるようになりました。
(LIZ ADX+DMIの詳細はこちらのリンクからご覧になれます。 )
(そのような期間は下位足でも難しい相場つき、レンジやランダム相場になっている事が多いため、トレンドフォローが難しい可能性が高いです。)
・たくさんのインジケーターが1つにカウントされるため、表示できるインジケーター3つの制限がある、無料版のアカウントをお使いの方も表示できます
移動平均線はSMAです。(EMA線がある別のバージョンがあります)
招待専用インジに興味ある方はプライベートチャットに連絡をください。

Moving Average ToolThe Moving Average Tool is the only indicator you will ever need to plot MA lines. It comes loaded with 9 different types of moving averages so traders can lay down any line at any length. There is also an option to plot a trigger line. Features: SMA , SMMA, EMA, LSMA, ZLSMA, HULL, LWMA, VWMA and ALMA. Simply pick an average type and enter the desired length.
All in One StudyHere is my All in One Strategy converted into a Study with Alert Conditions you can use for whatever purpose you wish.
Each condition is set up similarly to the way I had the strategy set up, if you pick the indicators you want to base your alerts on it will alert you only if the check box is true.
You can pick one or more of the indicators if you'd like. I only suggest to pick one at a time so you don't have overlapping buy/sell alerts.
I think everyone will find the message of the market falling alert amusing :-)

SMA 200 Ribbon MTF - Support and ResistanceThe SMA 200 is one of the most important and strongest support/resistance lines on any timeframe. This script pulls the SMA 200 line from multiple timeframes so traders can visually see price action bounce between support and resistance . The current timeframes SMA 200 is displayed in white and turns yellow to signify "pressure". Can be used on higher timeframes to find bull action. This indicator can also be used to filter out pumps and dumps as shown in example 3 and 4.
Example of indicator on 5 min timeframe. Candles bounce along SMA200 lines.
Example of indicator on daily timeframe . Lines turn green and price action pumps. Lines turn red and price action dumps.
Example 3: A clean crossover of lines usually signals a bullish pump.
Example 4: Tangled or messy lines tend to result in a dump as price action struggles to cross resistance. A pullback is required to "clean" the lines.
EMA Band can be turned on using "tickbox" in settings menu.

VWMA / SMA / TEMA DifferenceThis Study try to simulate Weakening and Strengthening trends on Bear(down) or Bull(up) movements.
It looks to VWMA - TEMA trend for Bull / Bear trend and looking for SMA - VWMA trend for Weak / Strong trends.
On default settings Line shows the difference between VWMA - TEMA and Columns show difference between SMA - VWMA. Suggesting to use this script for 5m intervals.
This is a personal work of mine. Using this script and taking decisions regarding to this script is only and only under responsibility of the trader!!!

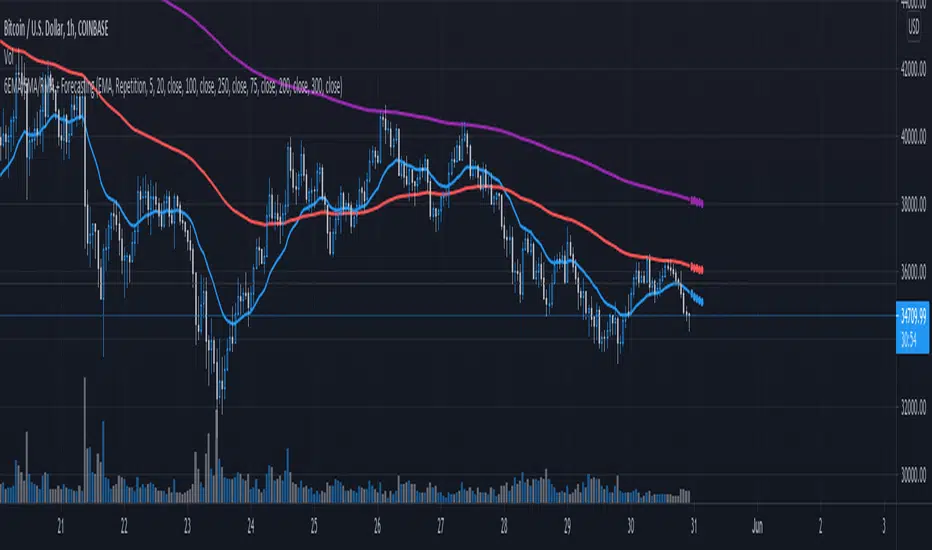
6 EMA SMA RMA + ForecastingDescription:
Hey hi, this Script is a bit simple. Let's start with some definitions.
Moving Average (MA)
In statistics, a moving average is a calculation used to analyze data points by creating a series of averages of different subsets of the full data set. In finance, a moving average (MA) is a stock indicator that is commonly used in technical analysis . The reason for calculating the moving average of a stock is to help smooth out the price data by creating a constantly updated average price . This makes this tool one of the most important for technical analysis .
Forecasting
Forecasting is the process of making predictions based on past and present data and most commonly by analysis of trends . In the same way that the moving average (MA) the forecasting is something highly desirable, in this way we opted to develop an indicator that allows the use of up to 6 moving averages combined with the forecasting.
In addition to having the option of up to 6 moving averages, these can be of different types, being able to choose between up to 3 options (it is proposed to add more options later) which are listed below.
Exponential Moving Average ( EMA )
Simple Moving Average ( SMA )
Running Moving Average (RMA)
In addition to the above, 2 prediction methods were added, which are listed and detailed below.
Repetition. Makes forecast repeating the last candle M times.
Linear Regression ( LR ). Linear Regression does N period LR forecast averaged with length-N Moving Average
Directional Matrix [LuxAlgo]Returns a dashboard showing the direction taken by 4 overlay indicators, SMA (simple moving average), TMA (triangular moving average), WMA (weighted moving average), and REG (linear regression), all using different length periods.
The user can select the minimum and maximum length of these indicators and introduce an increment.
1. Settings
Maximum Length: The end value of sequences of the indicator periods to analyze
Minimum Length: The starting value of sequences of the indicator periods to analyze
Step: Determines the spacing between each indicator periods values
Src: Data source for each of the 4 indicators
1.1 Style settings
Normalized Change Mode: Allows the user to access a different interpretation of the indicator by showing the normalized first differences of each indicator in the dashboard instead of their sign
Dashboard Location: Location of the dashboard on the chart
Dashboard Size: Size of the dashboard on the chart
Text/Frame Color: Determines the color of the frame grid as well as the text color
Bullish Cell Color: Determines the color of cell associated with a rising indicator direction
Bearish Cell Color: Determines the color of cell associated with a decreasing indicator direction
Cell Transparency: Transparency of each cell
2. Usage
Each of the indicators included in the dashboard aim to give an estimate of the underlying trend in the price. Knowing which direction they are taking can help us have a broader view regarding the direction of shorter/longer-term trends. We will later see that this is not the only kind of information that we can get from this indicator.
Rising indicators are represented by blue cells (or the color selected in the Bullish Cell Color setting) while decreasing indicators are represented by red cells (or the color selected in the Bearish Cell Color setting).
The percentage of bullish cells is given in the top-left cell of the dashboard.
2.1 Normalized change mode
Enabling the Normalized Change mode will display the normalized changes returned by the indicators over different length periods. This metric is within a range (0,1), with 1 indicating the highest change over the selected length periods, while 0 indicates the lowest one.
When enabling this mode the color of the cells makes use of a gradient with a color palette ranging from the color selected in the Bearish Cell setting to the color selected in the Bullish Cell setting.
2.1 Other Usage
The direction taken by certain indicators can give more information than one would think. Indeed, the sign of the change of one indicator can often be given by different indicators.
A positive change in a simple moving average indicates that the price is greater than the price p bars ago, where p is the period of the simple moving average.
A positive change in a triangular moving average indicates that a simple moving average of period p is above a simple moving average of period p × 2 , where p is the period of the triangular moving average (note that we assume here that the TMA is given by cascading two SMAs of period p ).
A positive change in a weighted moving average indicates that the price is above a simple moving average of period p+1 , where p is the period of the WMA.
Finally, a positive change in a linear regression indicates that a weighted moving average is above a simple moving average of period p , where p is the period of the linear regression.

Average Band by HarmanUsually, Moving Averages (Simple & Exponential) consider "close" of each candle to form a line for a particular period. In this indicator, we have considered all the parameters (Open, Close, Low & High) of each candle to form a Band or a wave which act as a zone to provide support & resistance. It works well on all the time frames. It perfectly works on lower time frames of 15 min & 5 min for intraday trades and even for scalping. There is a line that moves very near to candles known as "Candle Line" provide support & resistance to each individual candle and a leading line which moves ahead also acts as support & resistance and helps in determining trend direction.
How to use the indicator ?
Indicator consists of 3 components :
1) A Band or wave of 3 lines (upper, middle & lower line)
2) A "Candle Line" which moves along with the candles
3) A Leading line which moves ahead of the candles
Method 1 : When candles are being formed above the candle line (line near to candles) and it crosses the band or wave from below to upside, then long trade can be initiated. Similarly, When candles are being formed below the Candle line and it crosses the band or wave from upside then short trade can be initiated. Stop loss can be maintained below the band for Long trade and above the band for short trade. Candle line can be used to trail the stop loss.
Method 2: If candles moves above and below of the band very often and frequently and candle line is in the middle of candles then it is NO TRADING ZONE. If you still want to trade, then select a higher time frame and check the price movement. If there is a stability in the higher time frame, then take the trade in the higher timeframe with stable movement.
Method 3 : Candle line acts as "First line of Defence". In a uptrend, all the candles are formed above the candle line and in case of down trend, all the candles are formed below the candle line. When a newly formed candle cross the candle line then you can book profit. For Example : In uptrend , candles are being formed above the line, when a new candle started forming below the line and when the complete candle is formed below the line, profit can be booked. Vice-versa in case of downtrend.
Method 4: Direction of leading line, band and candle line helps in determining the trend. If all these three components are in upward direction, price trend is upward and if all these three components are in downward direction, then price trend is downward. When, leading line and band cross each other from opposite direction for consecutive 2-3 times, then price movement is sideways.
Method 5 : Thickness of band play an important role in determining price action. If band is narrow, it means small candles are being formed and no any huge price movement is observed in this period. When band started expanding, it signifies that big candles are begin to form and there is a more price movement than before. Similarly, If contraction of band started, it means that small candles are being formed and there is low price movement as compared to the price movement when Band was expanded. If Band is expanded (wider) and volumes are high, It means the Band will act as strong Support or Resistance than usual. In case, candles and candle line cross the expanded Band, you can enter the Long or Short trade.
Method 6: When the Band, leading line and candle line collides or meet at a single point, then it is either strong support or resistance.
Method 7 : Usage in Scalping : Select the shorter time frame of 1 min or 5 min. If the candles are crossing the band very frequently in 1 min, then select 5 min time frame or wait for few minutes for stability. Now, when candles started forming above the candle line and it crosses the band from below then take a long position and book profit after few candles above the band. Place stop loss below the Band. Similarly, when candles started forming below the candle line and it crosses the band from above, then enter into short trade and book profit after few candles. Place stop loss above the band in the case of short trade.
You can combine above methods to give a sharp edge to your trade and increase the probability of your winning in the trade.
Indicator Settings : Default period selected is 50 for both the Band and leading line. You can change the period to 26 or 100 or 200. Select the period and check the chart, if the indicator looks fine and smooth, then you can use your settings. For most of the time, default settings work perfectly.
Proudly Developed by :
Harmandeep Singh
Graduate in Computer Science with Physics & Mathematics
MBA in Business Marketing and Finance
Experienced Computer programmer & Software developer
Stock Market & Crypto Trader

TDI Hedge Strategy
This is the incomplete version but upon multiple requests, I have released it early. All of the strategy and alert functions are yet to be written and I'll get around to it soon.
This indicator aims to be the best TDI indicator on TradingView. It is a strategy or study. It will have all of the filter, entry, and exit conditions for the strategies around the TDI.
What is implemented
MFI or RSI: the MFI is a much better TDI baseline than the RSI, in my opinion, and very effective
EMA or SMA used for the moving averages on fast, slow, and volatility band
Dynamic timeframe: set a factor of current timeframe and indicator will analyse higher timeframe automatically
Manual timeframe: set a higher timeframe to analyse different to currently viewed
Features for later
conditions for TDI filters/entries/exits
Strategy functions to use built-in strategy tester
BTE signal plot for Backtesting & Trading Engine
alerts
Enjoy!

Moving Average Buy/Sell IndicatorUsing a selected Exponential Moving Average (EMA)/Simple Moving Average (SMA) range, this indicator inserts a Long/Short (buy/sell) indicator overlaid on chart depending on the following conditions:
- LONG/BUY SIGNAL = if SMA value is less than EMA, and both the SMA and EMA are less than the current average price.
- SHORT/SELL SIGNAL = if SMA value is greater than EMA, and both the SMA and EMA are greater than the current average price.
**Intended for use with the 21 and 34 weekly moving average time range. Much more useful for long-term analysis rather than short-term analysis.**

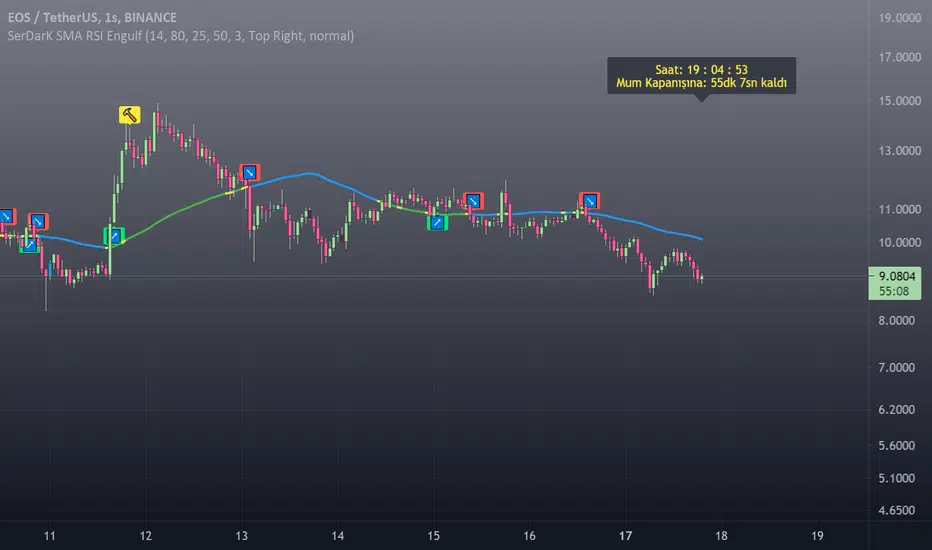
[SerDarK] SMA RSI Engulfing BarENG: This indicator includes the SMA line colored according to the price position, the RSI to identify the bearish or the bullish points, the Engulfing bars, the clock and the information panel showing the countdown to the candle closing.
SMA: default period is set to 50. It can change from the settings.
Definition of SMA line default colors: When the price is below the SMA line, its color is blue. It is green when the price is above the SMA line. It is yellow in RSI alerts and when the price hits the SMA line.
RSI: default period 14 is set. It can be changed in the settings.
🔨 Hammer Emoji: RSI is located at the overbought turnaround point. This sign does not mean that the trend will definitely return.
🚀Rocket Emoji: Tries to catch the "RSI oversold point turn".This sign does not mean that the trend will definitely return.
↗️↘️Up and Down arrows emojis. After the price crosses the SMA line, it indicates that it is closing a candle in that direction.
Engulfing candles: bullish engulfing candle is blue color. Bear engulfing candle is black in color.colors can be changed in settings.
Note that this indicator is only an indicator. It does not give advice on buying or selling.
Enjoy
TUR: Bu indikatör, fiyat konumuna göre renklendirilmiş SMA çizgisi, RSI ile düşüş veya yükseliş noktalarını belirleme, Engulfing (Yutan) barlar , saat ve mum kapanışı için geri sayım gösteren bilgi paneli içermektedir.
SMA: varsayılan periyodu 50 ayarlıdır. Ayarlardan değiştirebilir.
SMA çizgisi varsayılan renklerinin tanımı: Fiyat SMA çizgisi altında iken rengi mavidir. Fiyat SMA çizgisi üstünde iken yeşildir. RSI uyarılarında ve fiyat SMA çizgisine temas ettiğinde sarı renktedir.
RSI: varsayılan periyodu 14 ayarlanmıştır. Ayarlardan değiştirilebilir.
🔨 Çekiç Emojisi: RSI aşırı alım dönüş noktasında bulunur. Bu işaret trendin kesin döneceği anlamına gelmez.
🚀Roket Emojisi: "RSI aşırı satım noktası dönüşünü "yakalamaya çalışır. Bu işaret trendin kesin döneceği anlamına gelmez.
↗️↘️Yukarı ve Aşağı yönlü okl emojileri. Fiyat SMA çizgisini kestikten sonra, o yönde mum kapattığını gösterir.
Engulfing mumları: bullish engulfing (yutan boğa) mumu mavi renktir. Bear engulfing (yutan ayı) mumu siyah renktir. Renkler ayarlardan değiştirilebilir.
Not: Bu indikatörün yalnızca gösterge olduğunu unutmayın. Alma satma tavsiyesi vermez.
Kalan süre etiketi BIST gibi sınırlı süreli sembollerde, gün ve daha üstü periyotlarda doğru çalışmayabiliyor.
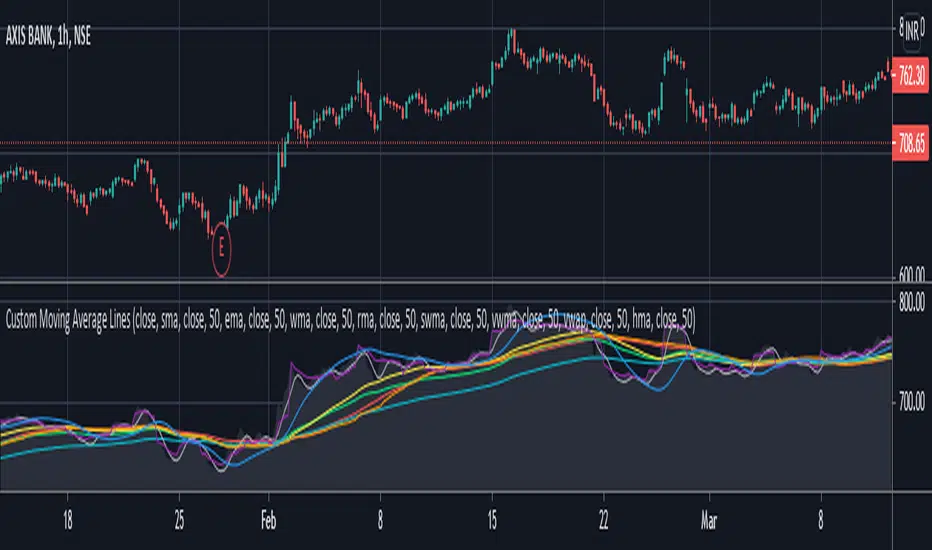
Custom Moving Average LinesHeylo!
This is a script for basic market trend analysis using moving average lines. It features eight lines with eight choices of moving averages and adjustable sources & time periods . The choice of moving averages are stated below:
1. Simple Moving Average (sma)
2. Exponential Moving Average (ema)
3. Weighted Moving Average (wma)
4. Relative Moving Average (rma)
5. Hull Moving Average (hma)
6. Sine-Weighted Moving Average (swma)
7. Volume Weighted Moving Average (vwma)
8. Volume Weighted Average Price (vwap)
Planning on including other formula based indicators soon. Let me know if there can be some improvements made / errors so I can fix it.
Cheers!
Moving Average Crossover with Shading Signals This script uses 3 moving averages (2 simple moving averages and 1 exponential moving average ) to signal long and short opportunities based on moving average crossovers.
A long SMA (Signal SMA2) is used to determine longer term trend. When the EMA crosses above the Slow SMA1 and price is above the Signal SMA2. The space between the moving averages will shade green and the Signal SMA should also be green.
A sell signal occurs when the EMA crosses below the Slow SMA1 and price is below the Signal SMA2. The space between the moving averages will turn red and the Signal SMA should also be red.
A retracement, consolidation, or reversal may be occurring if the shaded color is yellow.
Use the identifying shapes to learn when to open or close positions.

2 Multi-Timeframe Bollinger BandsThis is two separate Bollinger bands in one study. Customizable middle BB line type ( SMA , EMA , VWMA ), legnth, colors, and deviations provided at .5 increments.
Someone else has a very similar Bollinger Band study but the code was hidden, so I figured I would remake as a learning challenge since I'm new to pinescript and this is the best way to learn it imo.
There will be updates to this script in the future but for now it serves its purpose lol. Publishing this version early as I wanted to give some friends access to it
In terms of usage, I like 4h 50 SMA alot . Having two sets of Bollinger bands is nice so you can turn one off or swap between time frames and such. In terms of techniques using both bbands, I haven't really played with it too much yet but simple things like 1h 50sma bbands expanding past the 4h 50sma bbands probably indicate an exaggerated move in that specific time frame, etc etc.
Hope this helps!

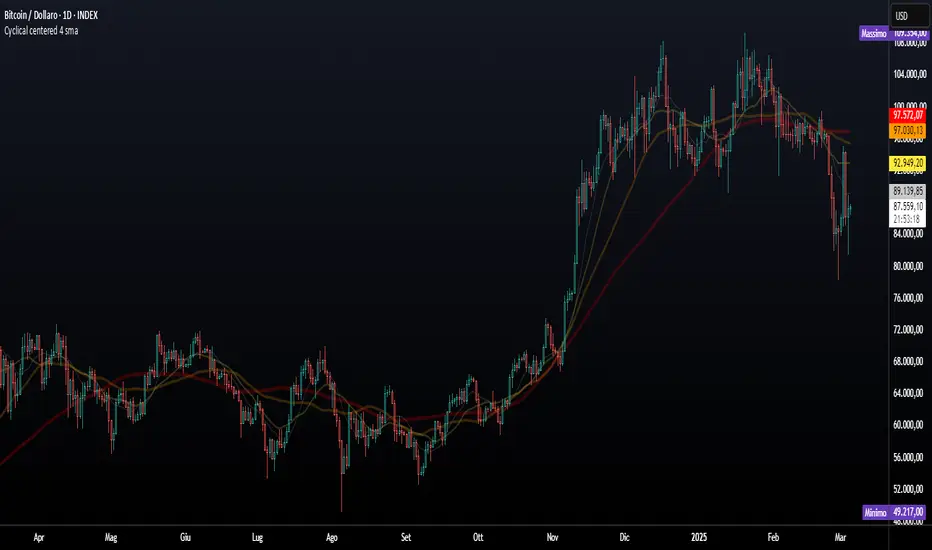
Quad centered moving averages v1This indicator includes four centered moving average!
The missing periods have been reconstructed with a very complex approximation and projection technique!
The hatched areas are approximations of the missing periods projected into the future.
It is possible to set the centering of the averages through the variable "Approximation Lenght" and the ratio between the main average and the underlying in "Period Partition".
Practical example of setting:
"Approximation Lenght" equal to 2 means that the centering will be of half a period.
"Period Partition" makes sure to cascade all averages by dividing them by the same number.
//Once decided the Main Cycle (default 256) we will get the 4 averages:
-red to 128
-orange 64
-yellow 32
-white 16
This is a great tool for cyclical analysis.
It is not possible, due to the pinescript v4 language limit, to set the average under 35 periods and over 1070 periods.
For any bugs contact the creators
Single centered moving average v1This indicator is a centered moving average!
The missing periods have been reconstructed with a very complex approximation and projection technique!
On the chart I loaded a simple 180-period average in blue and our average centered in yellow.
The hatched area is the approximation of the missing periods projected into the future.
It is possible to set the centering of the average through the offset ratio:
2 is half a period behind; 4 is a quarter of a period behind.
This is a great tool for cyclical analysis.
It is not possible, due to the pinescript v4 language limit, to set the average over 1.000 periods.
For any bugs contact the creators

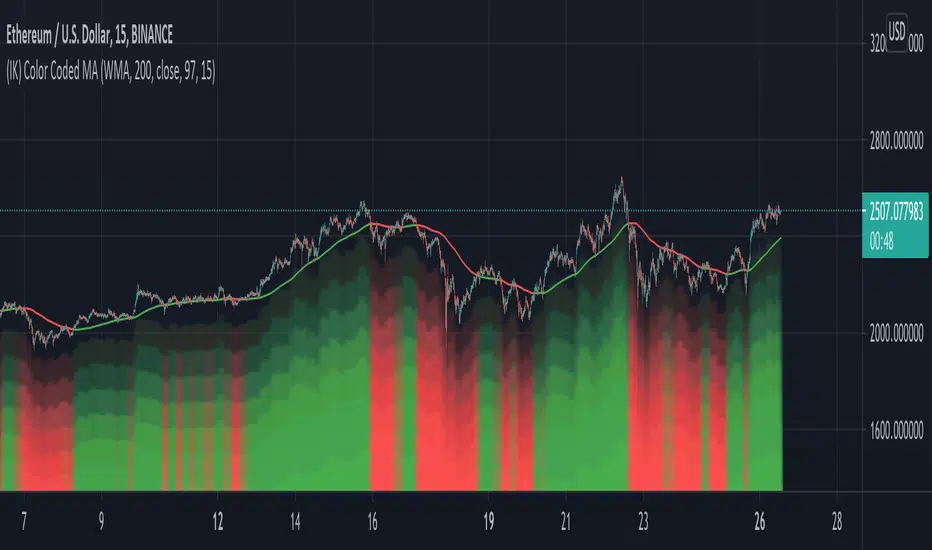
(IK) Color Coded MAJust a simple Moving Average indicator. Choose between SMA, EMA, and WMA, set the length and the source. There are 3 color indicators that represent whether price is above or below the moving average:
- the moving average line itself
- the background of the chart (optional)
- the 'underglow' of price action (optional - set 'underglow strength' to 0 to turn off)
You can customize the colors
I wasn't planning on publishing this, because, again, it doesn't really do anything special, but I've been using it for a little bit now in place of regular MAs, and I really dig the visual effect of the underglow, so I thought I'd share.
Feel free to steal/modify this.
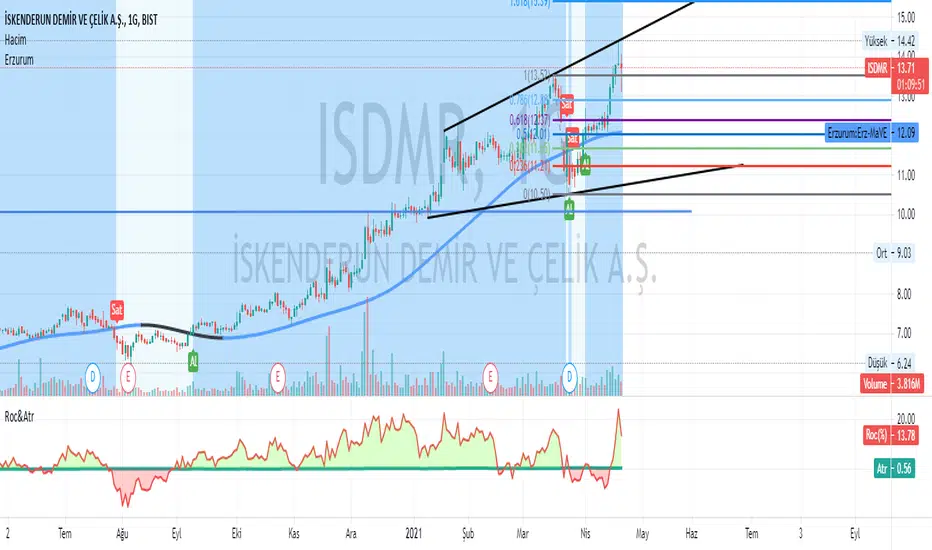
Erzurum Indicators (By DadashKadir)Erzurum Indicators (By DadashKadir)
An indicator in which you will keep track of the buying and selling movements by adding the movements of the three moving averages together. The parameters were determined as Moving Average (SMA), Exponential Moving Average (EMA), Weighted Moving Average (WMA) and Volume Weighted Moving Average (VWMA). Its constant value was taken as WMA. It is used to calculate the averages of 3 - 5 and 7. You can include the standard deviation (STDEV) in these moving averages.
The name of the indicator is taken from our city of Erzurum, the pearl of Eastern Anatolia.
Overlay Indicators (EMAs, SMAs, Ichimoku & Bollinger Bands)This is a combination of popular overlay indicators that are used for dynamic support and resistance, trade targets and trend strength.
Included are:
-> 6 Exponential Moving Averages
-> 6 Simple Moving Averages
-> Ichimoku Cloud
-> Bollinger Bands
-> There is also a weekend background marker ideal for cryptocurrency trading
Using all these indicators in conjunction with each other provide great confluence and confidence in trades and price targets.
An explanation of each indicator is listed below.
What Is an Exponential Moving Average (EMA)?
"An exponential moving average (EMA) is a type of moving average (MA) that places a greater weight and significance on the most recent data points. The exponential moving average is also referred to as the exponentially weighted moving average. An exponentially weighted moving average reacts more significantly to recent price changes than a simple moving average (SMA), which applies an equal weight to all observations in the period.
What Does the Exponential Moving Average Tell You?
The 12- and 26-day exponential moving averages (EMAs) are often the most quoted and analyzed short-term averages. The 12- and 26-day are used to create indicators like the moving average convergence divergence (MACD) and the percentage price oscillator (PPO). In general, the 50- and 200-day EMAs are used as indicators for long-term trends. When a stock price crosses its 200-day moving average, it is a technical signal that a reversal has occurred.
Traders who employ technical analysis find moving averages very useful and insightful when applied correctly. However, they also realize that these signals can create havoc when used improperly or misinterpreted. All the moving averages commonly used in technical analysis are, by their very nature, lagging indicators."
Source: www.investopedia.com
Popular EMA lookback periods include fibonacci numbers and round numbers such as the 100 or 200. The default values of the EMAs in this indicator are the most widely used, specifically for cryptocurrency but they also work very well with traditional.
EMAs are normally used in conjunction with Simple Moving Averages.
" What Is Simple Moving Average (SMA)?
A simple moving average (SMA) calculates the average of a selected range of prices, usually closing prices, by the number of periods in that range.
Simple Moving Average vs. Exponential Moving Average
The major difference between an exponential moving average (EMA) and a simple moving average is the sensitivity each one shows to changes in the data used in its calculation. More specifically, the EMA gives a higher weighting to recent prices, while the SMA assigns an equal weighting to all values."
Source: www.investopedia.com
In this indicator, I've included 6 popular moving averages that are commonly used. Most traders will find specific settings for their own personal trading style.
Along with the EMA and SMA, another indicator that is good for finding confluence between these two is the Ichimoku Cloud.
" What is the Ichimoku Cloud?
The Ichimoku Cloud is a collection of technical indicators that show support and resistance levels, as well as momentum and trend direction. It does this by taking multiple averages and plotting them on the chart. It also uses these figures to compute a "cloud" which attempts to forecast where the price may find support or resistance in the future.
The Ichimoku cloud was developed by Goichi Hosoda, a Japanese journalist, and published in the late 1960s.1 It provides more data points than the standard candlestick chart. While it seems complicated at first glance, those familiar with how to read the charts often find it easy to understand with well-defined trading signals."
More info can be seen here: www.investopedia.com
I have changed the default settings on the Ichimoku to suit cryptocurrency trading (as cryptocurrency is usually fast and thus require slightly longer lookbacks) to 20 60 120 30.
Along with the Ichimoku, I like to use Bollinger Bands to not only find confluence for support and resistance but for price discovery targets and trend strength.
" What Is a Bollinger Band®?
A Bollinger Band® is a technical analysis tool defined by a set of trendlines plotted two standard deviations (positively and negatively) away from a simple moving average (SMA) of a security's price, but which can be adjusted to user preferences.
Bollinger Bands® were developed and copyrighted by famous technical trader John Bollinger, designed to discover opportunities that give investors a higher probability of properly identifying when an asset is oversold or overbought."
This article goes into great detail of the complexities of using the Bollinger band and how to use it.
=======
This indicator combines all these powerful indicators into one so that it is easier to input different settings, turn specific tools on or off and can be easily customised.
