Fibonacci Retracement (S)-Silver
The Automatic Fib Retracement - Silver -0.24% script indicates the 50-61.8% pullback region.
The lines of the upper and lower pivots, the support and resistance areas are also highlighted.
Customisable Fib Length - Time period over which max and min pivots are chosen.
Offsetfib - Automatically offsets the pivots and sell zone as your entry position
will be some time after the upper and lower pivots are set.
Works well when used in combination with an oscillator which highlights Divergence.
A strategy based off buying the 50-618 with a defined stop loss and target can be the basis of your strategy.
This tool will automatically plot those points but a defined Risk Management strategy will always be needed.
Works best in Bearish trends but will work on all timeframes (Bearish correction in an uptrend also possible).
Previous pivots shown but be careful to identify which of the several pivots you are using.
Start at a larger timeframe and move down. (Entries consistent on several timeframes are golden)
Pivots and retracements are dynamic. Be sure to note your entry and targets.
Short


BKT Sisyphus 001Short System.
1) Control back testing period from the inputs
2) Make sure enough initial capital to make trades for the testing period
3) 100% equity to measure the performance of the trading system
4) commission 20 basis points or .2%


Stoch BitfinexSimilar to RSI Bitfinex , but Stoch version.
It applies Stochastic Oscillator to BTC longs/shorts ratio on Bitfinex. You can use the oscillator as you'd use Stoch:
- Divergences
- Oversold/overbought signals
- R/S on the indicator
- Trend indication
- etc
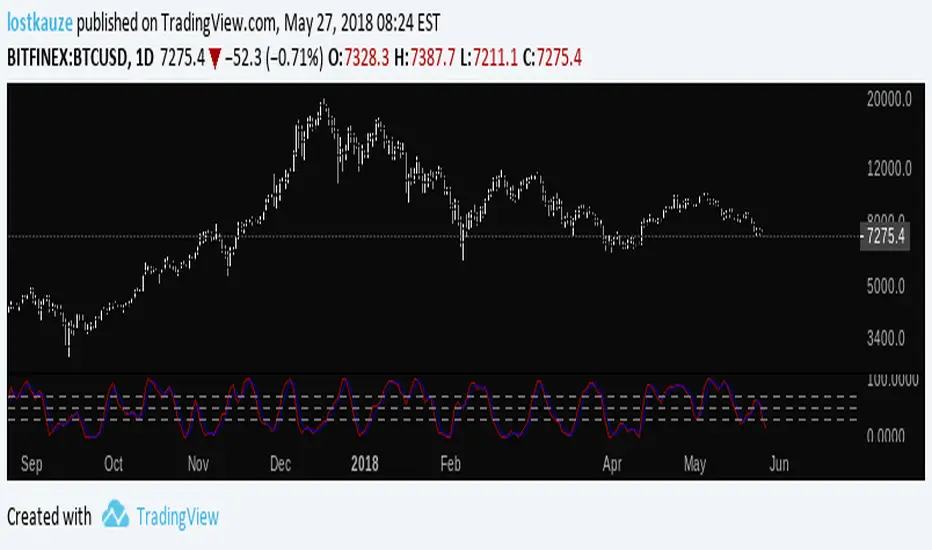
RSI BitfinexRSI applied to BTC longs/shorts ratio on Bitfinex. You can use the oscillator as you'd use RSI:
- Divergences
- Oversold/overbought signals
- R/S on the indicator
- Trend indication
- etc

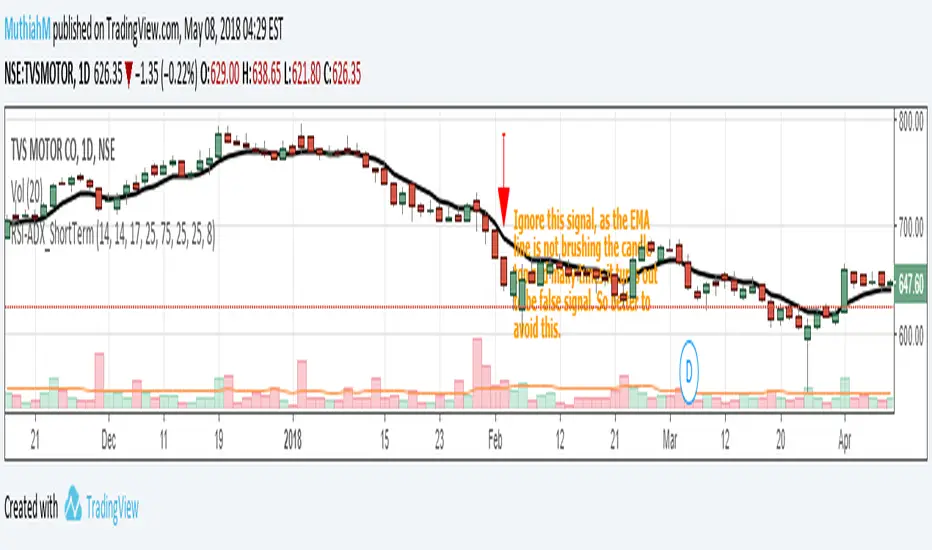
Setup for Short Term Investment using RSI&ADX. High success rateThis is a very simple script which gives reliable signals for buying and selling in short term. I came across this strategy a long time before in some website and coded it here. I had been using this for a long time and made good profits.
Idea is very simple, a buy call is triggered when RSI is greater than 75 and ADX is greater than 25. Sell call is triggered when RSI is lesser than 25 and ADX is again greater than 25. To remove false signals I always use it with EMA(close,8) which is also included as part of the code.
The ideal chart resolution is 1 day, below this the indicator is not reliable. Haven't tested this indicator for anything other than daily chart.
Refer the snapshots for more details.For any queries, please comment or PM me.
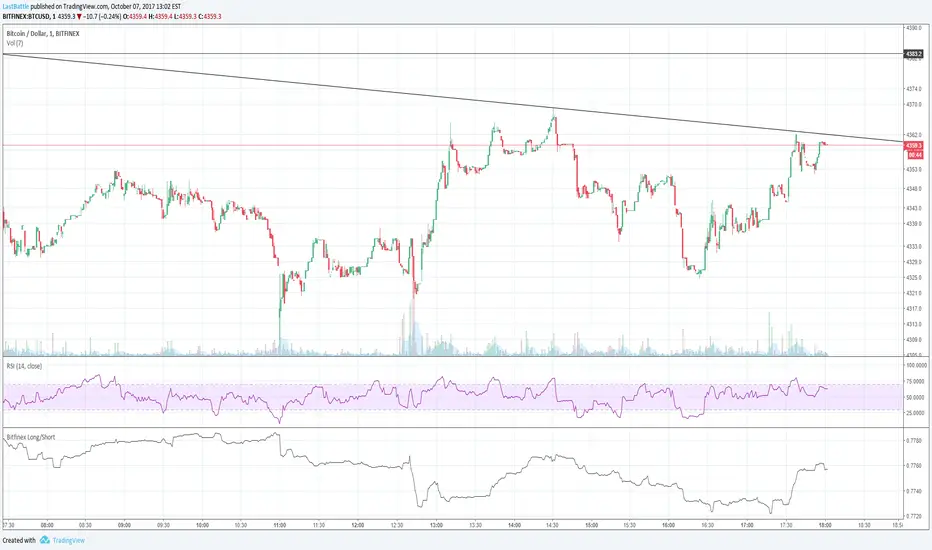
Bitfinex Longs vs. ShortsIt shows amount of longs vs shorts for Bitfinex.
It can be applied to any currency that has a long/short option on Bitfinex.
It works with any other exchange but it pulls short long data from Bitfinex.
Useful for "reading" the market sentiment.
Use it well. Be blessed.

BITFINEX Long to Short RatioShows the ratio of longs to shorts. Above 1.0 means more longs. Below 1.0 means more shorts. A value of 1.0 means equilibrium.

BTC longs vs shorts ratioThis is a simple script showing long / short ratio for BTC using Bitfinex exchange data.

Bitfinex dominionThis indicator will show you which gang is dominating the market : the bearish gang (short masters),
or the bullish gang (long masters).
The bearish gang is drawn in red and the Bullish one is in green color.
If red is above green, that means we have a bearish tendency on the market.
if green goes above red, that means the market is going the bullish way.
It's nice to use it on 1H or 30 minutes intervals.
Here's what I do : When the dominion is changing hands (=a shift in color), then that mean the market
is moving in another direction. I then use my other indicators to make a decision so to create a trade
at the very moment of the dominance change or not...
NB1: make sure you know what you do before using this "what I do" strategy. It can be not suited to
everyone. Trading is a risky business. So don't take words as granted from people like me or others.
The best thing to do is : testing,testing then re-testing while having a good money management.
I've burnt myself many times before.
NB2: Margin trading can be really risky if you use this "what I do" strategy. Because price can go far in
counter direction before getting back to our target price. So you can risk a margin call. So it's better
using this "what I do" strategy on market trading only.

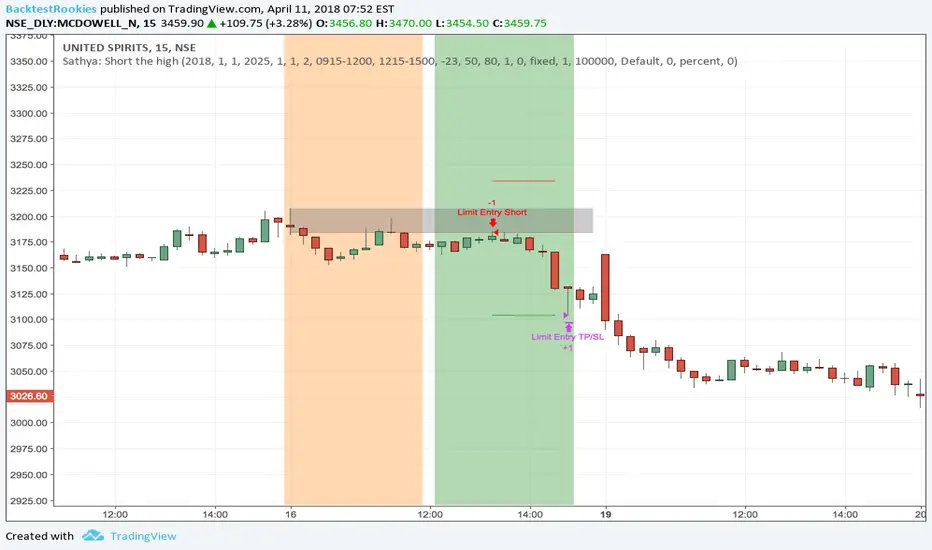
Sathya: Short the highShort the High
This script has been developed as a professional service and is published only for customer verification/acceptance.
If you are interested in development services, either PM me or visit the Backtest-Rookies website (.com)
Summary
This strategy will attempt to take a short position within a time window only after X consecutive up days. Once X consecutive up days have been detected, two windows will open up. The first window tracks the high of the day. The second window will attempt to short the high of the day if price retests it.
Features
Tracking of consecutive up days using intra-day data
Opening a trade window when consecutive up days are detected
Tracking the high of a sub-session (user definable)
Shorting the high during a second sub-session (user definable)
Stop losses and take profits
End of sub-session close out option.
Buffer range from high of the day. So price does not need to retouch the high but can come with x rupees.
Background coloring of sub-sessions so it is easy to track trades
[GU]ShortKiller_v1.2Indicator for getting information about shorts in progress with alert conditions available.


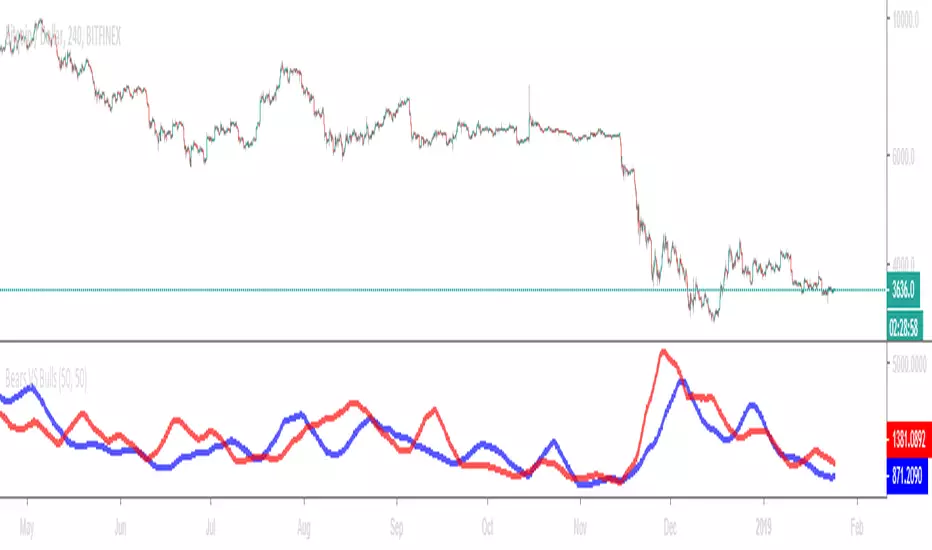
Bears VS BullsThis indicator will work on ANY instrument.
The red line is a moving average of ONLY sellers in the market.
The blue line is a moving average of ONLY buyers in the market.
The period or "length" of the individual moving averages can be adjusted in the indicator settings.
The default, it is set to 50.
Buying and selling trends often provide indications of market moves such as the most recent bottom in Cryptocurrencies.
Feel free to comment and share any indicator concepts or ideas for content you would like to see added to the Technical Indicator Bundle on www.kenzing.com
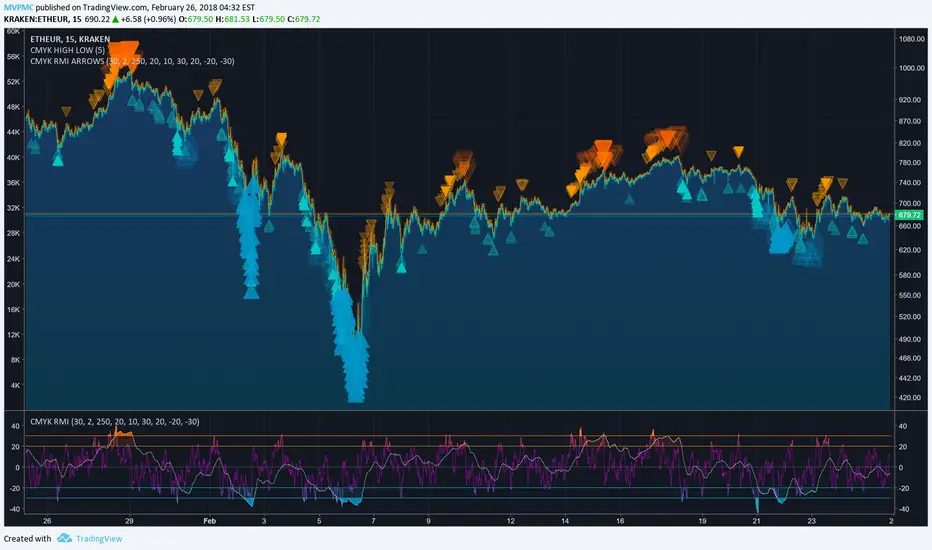
CMYK RMI ARROWS◊ Introduction
I started using this script because of its fast reaction, and good tell for buy/sell moments.
For larger timescales, the overall trend should be taken into account regarding the levels.
In the future i will update this indicator, to automatically adjust those.
This is the Overlay expansion of the Indicator Linked below.
◊ Origin
The Relative Momentum Index was developed by Roger Altman and was introduced in his article in the February, 1993 issue of Technical Analysis of Stocks & Commodities magazine.
While RSI counts up and down days from close to close, the Relative Momentum Index counts up and down days from the close relative to a close x number of days ago.
This results in an RSI that is smoother.
◊ Adjustments
CMYK color theme applied.
Four levels to indicate intensity.
Two Timescales, to overview the broader trend, and fast movements.
◊ Usage
RMI indicates overbought and oversold zones, and can be used for divergence and trend analysis.
◊ Future Prospects
Self adjusting levels, relative to an SMA trend.
Alternative RMI, which functions as an overlay.
◊ ◊ ◊ ◊ ◊ ◊ ◊ ◊ ◊ ◊ ◊ ◊ ◊ ◊ ◊ ◊ ◊ ◊ ◊ ◊ ◊ ◊ ◊ ◊ ◊ ◊ ◊ ◊ ◊ ◊ ◊ ◊ ◊ ◊ ◊ ◊ ◊ ◊ ◊ ◊ ◊ ◊ ◊ ◊ ◊ ◊ ◊ ◊ ◊ ◊ ◊ ◊ ◊ ◊ ◊ ◊ ◊ ◊ ◊ ◊ ◊ ◊ ◊ ◊ ◊ ◊ ◊ ◊ ◊ ◊ ◊ ◊ ◊ ◊ ◊ ◊ ◊ ◊ ◊ ◊ ◊ ◊ ◊ ◊ ◊ ◊ ◊ ◊ ◊ ◊ ◊ ◊ ◊ ◊ ◊ ◊ ◊ ◊ ◊ ◊ ◊ ◊ ◊ ◊ ◊ ◊
░▒▓█ CMYK ◊ RMI █▓▒░
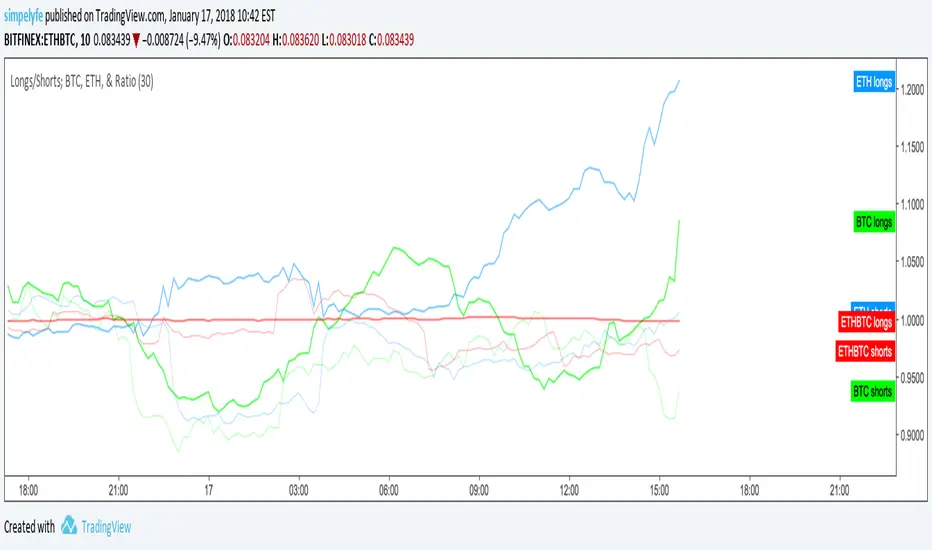
Longs vs. Shorts; BTC, ETH, & RatioLongs vs. Shorts for the following normalized as a ratio of desired period (editable).
ETHUSD
BTCUSD
ETHBTC
[naoligo] 12x MA DT (5, 15, 30 & 60)This indicator is based on "Generic 8x MA Plotter", by @LazyBear.
It is also based on my own indicator "10x MA (H, D, W, M)", which is good for Swing Trading and/or Position.
This one is focused in daytrade and it will plot three Moving Averages based on current time interval (under 5 minutes) and nine based on chosen periods by 5, 15, 30 and 60 minutes. You will be able to see where is, for example, a 50 period's SMA of 15 minutes when using a 2 minutes time interval chart. I find it very useful to analyze, in a snap, possible price ranges and enter/exit points. All reference values are from setups known and used by daytraders.
you can choose between EMA or SMA (default: SMA) for each time interval, that are distributed in:
3x MA current time interval;
3x MA 5 minutes;
2x MA 15 minutes;
2x MA 30 minutes;
2x MA 60 minutes.
I've tried to keep the code as simple as possible, so you can increase the number of MA or modify the type for each time interval.
Cons: Use it wisely, because if you choose to plot all the 12 Moving Averages, it will may consume a lot of your navigator resources.
Enjoy!

ATR+ (Stop Loss Indicator)This script is designed to aid in back-testing and trade execution.
It displays three sets of values - the teal colored value is the current ATR, the green colored value is your stop loss distance (in pips) below the most recent swing low for long trades , and the red colored value is your stop loss distance (in pips) above the most recent swing high for short trades .
You can change the stop loss settings to base your stop loss on a set pip amount or by however many multiples of the current ATR as you wish (eg. 1.5x ATR).
Feel free to ask any questions or edit the script without permission :)
- Matt.

Bitfinex BTC longs vs Short ratioSelf explanatory...
Shows the long / short ratio of trader's positioning in bitfinex exchange.
The higher the ratio, it means there are more longs. The lower the ratio, the more shorts are currently being opened,.
BFXLS - Compare styleDisplays BitFinex longs and shorts on your chart in the same was as if you add them by using TradingView's "compare" function - major advantage is that this works for all pairs that BitFinex supports without having to manually set up your chart each time.
