Horizontal Sessions - B A N K $This is a simple indicator that has been designed to aid intraday trading and has only 1 function;
Information ℹ️
This indicator prints Horizontal Lines in a separate chart pane above/below for the 3 main session killzones in the markets; Asia, London & New York + Optimal Exit Time.
The indicator is only visible up to and including the 1h timeframe.
Settings ⚙️
The default timings are set to perfectly align with each session killzone however the Start & End times for each session can be changed in the settings.
You can change the colour & line thickness of the horizontal lines in the settings.
Sessions

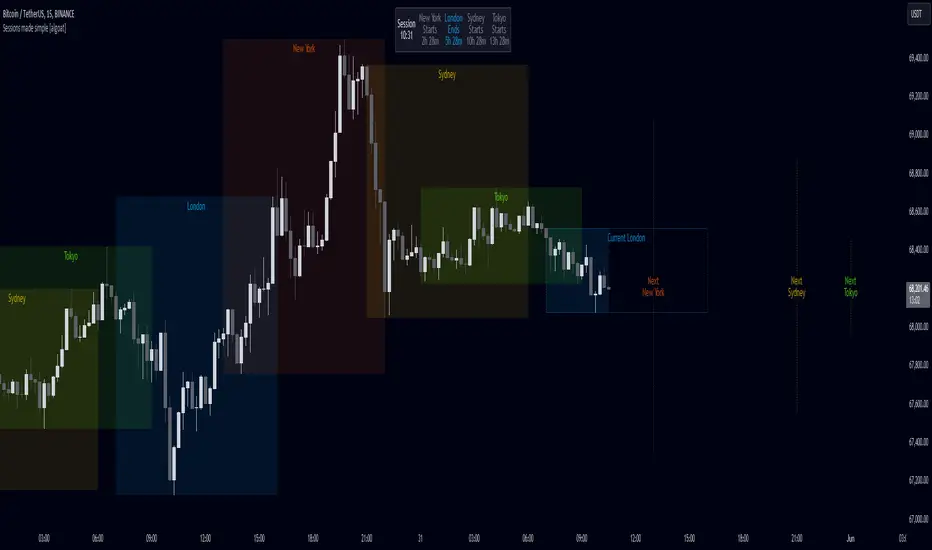
Sessions made simple [algoat]The indicator — by default — provides a clear and concise representation of the four major global trading sessions. Each session is distinctly marked on your trading chart, helping you visualize the specific time periods when these markets are most active. Whether you're a day trader looking to exploit intraday volatility or a long-term investor wanting to understand broader market trends, the Market Sessions feature can be a useful tool in your trading toolkit. The indicator comes with a dashboard, displaying the remaining time until the session end if the session is active and next start if the session is inactive.
Don't forget to align indicator timezone settings according to your region!
⭐ Key Features:
Visual Session Markers
Each of the four trading sessions is fully configurable by visibility, title, time range, and more. The enabled sessions are distinctly marked on the chart with customizable colors, various display options, current sessions' end time and next sessions' start time.
Session Dashboard
The indicator includes a dashboard that displays the remaining time until the session end if the session is active, and the next start time if the session is inactive. This feature provides a quick reference for traders to plan their trading activities.
Timezone Settings
Easily align the indicator's timezone settings with your region by entering your time zone's offset in UTC hours. This ensures that the session times are accurately displayed according to your local time.
Weekend Visibility
Optionally, you can choose to display or hide weekend sessions based on your trading preferences.
Flexible Configuration
The indicator allows for various configurations such as the maximum timeframe for session display, the position of the dashboard, and the text size for better readability.
══════════════════
🧠 General advice
Trading effectively requires a range of techniques, experience, and expertise. From technical analysis to market fundamentals, traders must navigate multiple factors, including market sentiment and economic conditions. However, traders often find themselves overwhelmed by market noise, making it challenging to filter out distractions and make informed decisions. By integrating multiple analytical approaches, traders can tailor their strategies to fit their unique trading styles and objectives.
Confirming signals with other indicators
As with all technical indicators, it is important to confirm potential signals with other analytical tools, such as support and resistance levels, as well as indicators like RSI, MACD, and volume. This helps increase the probability of a successful trade.
Use proper risk management
When using this or any other indicator, it is crucial to have proper risk management in place. Consider implementing stop-loss levels and thoughtful position sizing.
Combining with other technical indicators
Integrate this indicator with other technical indicators to develop a comprehensive trading strategy and provide additional confirmation.
Conduct Thorough Research and Backtesting
Ensure a solid understanding of the indicator and its behavior through thorough research and backtesting before making trading decisions. Consider incorporating fundamental analysis and market sentiment into your trading approach.
══════════════════
⭐ Conclusion
We hold the view that the true path to success is the synergy between the trader and the tool, contrary to the common belief that the tool itself is the sole determinant of profitability. The actual scenario is more nuanced than such an oversimplification. A word to the wise is enough: developed by traders, for traders — pioneering innovations for the modern era.
Risk Notice
Everything provided by algoat — from scripts, tools, and articles to educational materials — is intended solely for educational and informational purposes. Past performance does not assure future returns.
KillZones Hunt + Sessions [TradingFinder] Alert & Volume Ranges🟣 Introduction
🔵 Session
Financial markets are divided into various time segments, each with its own characteristics and activity levels. These segments are called sessions, and they are active at different times of the day.
The most important active sessions in financial markets are :
1. Asian Session
2. European Session
3. New York Session
The timing of these major sessions based on the UTC time zone is as follows :
1. Asian Session: 23:00 to 06:00
2. European Session: 07:00 to 16:30
3. New York Session: 13:00 to 22:00
Note
To avoid overlap between sessions and interference in kill zones, we have adjusted the session timings as follows :
• Asian Session: 23:00 to 06:00
• European Session: 07:00 to 14:25
• New York Session: 14:30 to 22:55
🔵 Kill Zones
Kill zones are parts of a session where trader activity is higher than usual. During these periods, trading volume increases and price fluctuations are more intense.
The timing of the major kill zones based on the UTC time zone is as follows :
• Asian Kill Zone: 23:00 to 03:55
• European Kill Zone: 07:00 to 09:55
• New York Morning Kill Zone: 14:30 to 16:55
• New York Evening Kill Zone: 19:30 to 20:55
This indicator focuses on tracking the kill zone and its range. For example, once a kill zone ends, the high and low formed during it remain unchanged.
If the price reaches the high or low of the kill zone while the session is still active, the corresponding line is not drawn any further. Based on this information, various strategies can be developed, and the most important ones are discussed below.
🟣 How to Use
There are three main ways to trade based on the kill zone :
• Kill Zone Hunt
• Breakout and Pullback to Kill Zone
• Trading in the Trend of the Kill Zone
🔵 Kill Zone Hunt
According to this strategy, once the kill zone ends and its high and low lines no longer change, if the price reaches one of these lines within the same session and is strongly rejected, a trade can be entered.
🔵 Breakout and Pullback to Kill Zone
According to this strategy, once the kill zone ends and its high and low lines no longer change, if the price breaks one of these lines strongly within the same session, a trade can be entered on the pullback to that level.
Trading in the Trend of the Kill Zone
We know that kill zones are areas where high-volume trading occurs and powerful trends form. Therefore, trades can be made in the direction of the trend. For example, when an upward trend dominates this area, you can enter a buy trade when the price reaches a demand order block.
🟣 Features
🔵 Alerts
You can set alerts to be notified when the price hits the high or low lines of the kill zone.
🔵 More Information
By enabling this feature, you can view information such as the time and trading volume within the kill zone. This allows you to compare the trading volume with the same period on the previous day or other kill zones.
🟣 Settings
Through the settings, you have access to the following options :
• Show or hide additional information
• Enable or disable alerts
• Show or hide sessions
• Show or hide kill zones
• Set preferred colors for displaying sessions
• Customize the time range of sessions
• Customize the time range of kill zones

Trading SessionsThis Indicator can show the following sessions:
-2 Asian Ranges
-Pre Frankfurt Session
-Frankfurt Session
-London Session
-Pre New York Session
-New York Session
-NYSE Session
-Post NYSE Session
-NYSE Power Hour
-NYSE ETH
For every session it's possible to draw a line on session open price
For the 2 asian Ranges and the NYSE ETH it's possible to draw a line on 50% price
The indicator also can show these elements:
-Daily Session Breaks (changes the background of first hour of every day candle)
-Weekly Session Breaks (changes the background of first hour of every week candle)
-Daily Highs & Lows (draws lines on highs & lows of every day)
Every session duration and time are editable
Every color is editable
Every element can be hidden or shown

KillZones & Sessions [TradingFinder] Volume | Asia, London & NY🔵 Introduction
🟣 Session
The forex market operates 24 hours a day, 5 days a week, with only Saturdays and Sundays being off; traders often focus on one of the forex trading sessions instead of trying to trade in all markets 24 hours a day.
Trading sessions are time intervals during which a specific financial market is active and trades are conducted. The Asia, London, and New York sessions are the most important trading sessions throughout the 24-hour period, during which a significant amount of money and liquidity enters the market.
🟣 Kill Zone
Traders in financial markets profit from the difference between the price at which they buy or sell and the current market price. Traders have different time horizons for trading.
Among these, some traders engage in daily or even hourly trading and must operate during times when the market has desirable trading volumes and significant price movements.
Kill zones are segments of a session with higher trading volumes and price fluctuations compared to the rest of the session.
🔵 How to Use
🟣 Session Time
The "Asia Session" consists of two sessions: "Sydney" and "Tokyo." The beginning of this session, according to the "UTC" time zone, is at 23:00 and ends at 06:00. Similarly, the beginning of the "Asia KillZone," according to the "UTC" time zone, is at 23:00, and it ends at 03:55.
The "London Session" consists of two sessions: "Frankfurt" and "London." The beginning of this session, according to the "UTC" time zone, is at 07:00, and it ends at 14:25. Similarly, the beginning of the "London KillZone," according to the "UTC" time zone, is at 07:00, and it ends at 09:55.
The beginning of the "New York am" session, according to the "UTC" time zone, is at 14:30, and it ends at 19:25. Similarly, the beginning of the "New York am KillZone," according to the "UTC" time zone, is at 14:30, and it ends at 16:55.
The beginning of the "New York pm" session, according to the "UTC" time zone, is at 19:30, and it ends at 22:55. Similarly, the beginning of the "New York pm KillZone," according to the "UTC" time zone, is at 19:30, and it ends at 20:55.
Important : To prevent session overlap, the working hours of each session have slightly changed.
🔵 Features
🟣 Simultaneous Session and Kill Zone
With this indicator, you can simultaneously view the kill zone and session. High and low lines are used to indicate sessions, while filled areas with color represent kill zones. If you do not want to see kill zones, you can turn off the display settings.
🟣 Candle, Time, and Volume
Using the "More Info" feature, you can see the number of candles, elapsed time, and traded volume within the colored filled area.
🔵 Settings
•Show More Info: To display "More Info," you need to turn on this feature and turn it off whenever you don't need it.
• You can also customize these settings for each session separately :
o Display or hide session.
o Choose session color.
o Set session time range.
o Display or hide kill zone.
o Set kill zone time range.

Sessions KillZones Library [TradingFinder]🔵 Introduction
"The Forex Trading Sessions" highlight the active periods across different markets where significant trading volume and influence on the forex market are evident. The primary trading sessions globally include the "Asian Session," "London Session," and "New York Session."
A "Kill Zone" refers to a segment within a session characterized by high trading volume and notably sharper price movements. Consequently, there's a higher probability of encountering price action setups within these zones. Traders capitalize on this phenomenon in pursuit of more successful trading outcomes.
If you aim to integrate sessions or kill zones into your indicators or strategies, utilizing this library can amplify the precision and efficiency of your Python script development.
🔵 How to Use
First, you can add the library to your code as shown in the example below:
import TFlab/SessionAndKillZoneLibrary_TradingFinder/1
🟣 Parameters
SessionDetector(Session_Name, Session_Time, KillZone_Time, Session_Show, KillZone_Show, AreaUpdate, MoreInfo, Session_Color, Info_Color) =>
Parameters:
•Session_Name (string)
•Session_Time (string)
•KillZone_Time (string)
•Session_Show (bool)
•KillZone_Show (bool)
•AreaUpdate (string)
•MoreInfo (bool)
•Session_Color (color)
•Info_Color (color)
Session_Name : You must enter the session name in this parameter.
Session_Time : Enter here the start and end time of the session, which should be based on the UTC time zone.
KillZone_Time : Enter the start and end times of the kill zone, which should be based on the UTC time zone, here.
Session_Show : You can control whether or not to show the session using this entry. You must set true to display and false to not display.
KillZone_Show : Using this input you can control whether the kill zone is displayed or not. You must set true to display and false to not display.
AreaUpdate : If you want the session to be determined based on the time and high and low of the session itself, you must enter "Session" and if you want the area to be determined based on the time and high and low of the kill zone, you must enter "Kill Zone".
MoreInfo : If you want more information, you should set this entry to true, otherwise set to false. This information includes the number of candles in the area, the length of time in the area and the volume of transactions in the area.
Session_Color : Enter your desired color to display the session at this section. It is recommended to use bright and sharp colors.
Info_Color : Enter your desired color to display more information in this section.
🔵 Function Outputs
The outputs of this function are direct and indirect.
🟣 Indirect outputs
These outputs include session display, kill zone display, and time and volume information of session or kill zone.
🟣 Direct outputs
There are 8 direct outputs, which are:
Session Time : If the Session is active, it outputs 1, and if the Session is inactive, it outputs 0.
Kill Zone Time : If the Kill Zone is active, it outputs 1, and if the Kill Zone is inactive, it outputs 0.
Open : Session opening price.
High : The highest price of the session.
Low : The lowest price of the session.
Close : The last price of the session.
Low Touch Alert : If "Area Update" is in "Kill Zone" mode, if the price reaches the lowest price of the kill zone in the same session after the end of the kill zone, this output will be true. You can use this output to create an alert.
High Touch Alert : If "Area Update" is in "Kill Zone" mode, if the price reaches the highest price of the kill zone in the same session after the end of the kill zone, this output will be true. You can use this output to create an alert.
Important : To use "Open", "High", "Low" and "Close", "Area Update" must be in "Session" mode.

NY Killzone (Morning, Lunch, Afternoon)Indicator for New York session that splits Morning, Lunch and Afternoon part of the session.
Works on Time Frames of 30m and below.
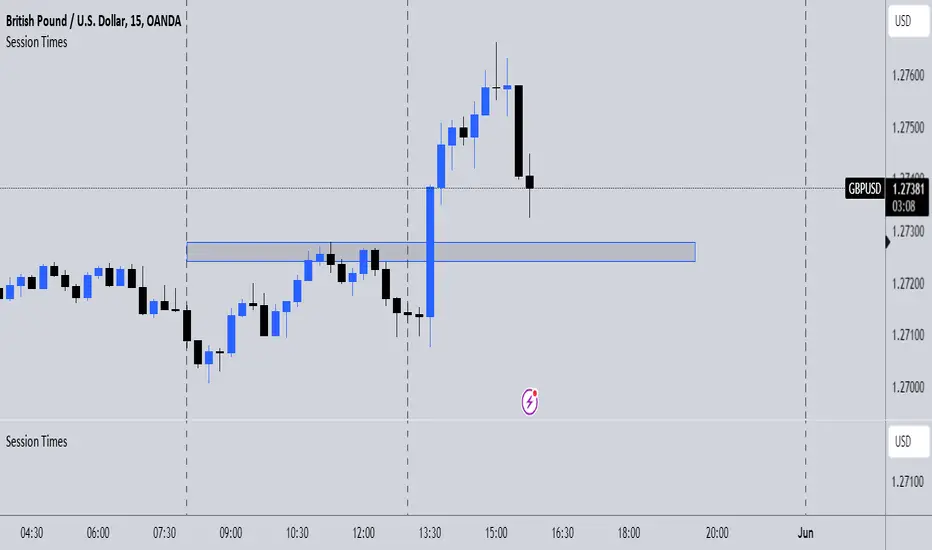
Session TimesDescription:
This indicator simply when enabled will draw dashed lines at each of the session openings. This is based on UTC+1 Time. There will be lines at 00:00 & 08:00 (Asian Session), lines at 08:00 & 13:00 (London Session) and finally lines at 13:00 & 00:00 (New York Session).
Potential Use:
There are many ways you could use this indicator to benefit your trading, but the best way I find is that it makes it clear where the previous highs and lows are of a session, which are potential areas you could trade off. Obviously, there are many other ways you can use this to help you.
How The Script Works:
The way the script works isn't too complicated as it is only a short script. Simply it firstly calculates what are the weekdays (Whenever it isn't Saturday or Sunday). Then from there simply finds the times which I mentioned above, and adds a vertical dashed line there.
Future Updates:
In the future I will mainly be looking to make the indicator more customisable. Firstly, I will look to make it so that the user can adjust the times that the lines are drawn at so it still works wherever you are in the world. I would also like to make it so the user can choose the colour of the lines. If you have any other additions you would like added to this, then feel free to message me.
Relative Average Extrapolation [ChartPrime]Relative Average Extrapolation (ChartPrime) is a new take on session averages, like the famous vwap . This indicator leverages patterns in the market by leveraging average-at-time to get a footprint of the average market conditions for the current time. This allows for a great estimate of market conditions throughout the day allowing for predictive forecasting. If we know what the market conditions are at a given time of day we can use this information to make assumptions about future market conditions. This is what allows us to estimate an entire session with fair accuracy. This indicator works on any intra-day time frame and will not work on time frames less than a minute, or time frames that are a day or greater in length. A unique aspect of this indicator is that it allows for analysis of pre and post market sessions independently from regular hours. This results in a cleaner and more usable vwap for each individual session. One drawback of this is that the indicator utilizes an average for the length of a session. Because of this, some after hour sessions will only have a partial estimation. The average and deviation bands will work past the point where it has been extrapolated to in this instance however. On low time frames due to the limited number of data points, the indicator can appear noisy.
Generally crypto doesn't have a consistent footprint making this indicator less suitable in crypto markets. Because of this we have implemented other weighting schemes to allow for more flexibility in the number of use cases for this indicator. Besides volume weighting we have also included time, volatility, and linear (none) weighting. Using any one of these weighting schemes will transform the vwap into a wma, volatility adjusted ma, or a simple moving average. All of the style are still session period and will become longer as the session progresses.
Relative Average Extrapolation (ChartPrime) works by storing data for each time step throughout the day by utilizing a custom indexing system. It takes the a key , ie hour/minute, and transforms it into an array index to stor the current data point in its unique array. From there we can take the current time of day and advance it by one step to retrieve the data point for the next bar index. This allows us to utilize the footprint the extrapolate into the future. We use the relative rate of change for the average, the relative deviation, and relative price position to extrapolate from the current point to the end of the session. This process is fast and effective and possibly easier to use than the built in map feature.
If you have used vwap before you should be familiar with the general settings for this indicator. We have made a point to make it as intuitive for anyone who is already used to using the standard vwap. You can pick the source for the average and adjust/enable the deviation bands multipliers in the settings group. The average period is what determines the number of days to use for the average-at-time. When it is set to 0 it will use all available data. Under "Extrapolation" you will find the settings for the estimation. "Direction Sensitivity" adjusts how sensitive the indicator is to the direction of the vwap. A higher number will allow it to change directions faster, where a lower number will make it more stable throughout the session. Under the "Style" section you will find all of the color and style adjustments to customize the appearance of this indicator.
Relative Average Extrapolation (ChartPrime) is an advanced and customizable session average indicator with the ability to estimate the direction and volatility of intra-day sessions. We hope you will find this script fascinating and useful in your trading and decision making. With its unique take on session weighting and forecasting, we believe it will be a secret weapon for traders for years to come.
Enjoy

Timeframe Marker - know when timeframes start/end
When you're on a lower timeframe, it's important to know which timeframes are starting/ending.
Timeframe Marker will display a bars that stack notifying you of your chosen timeframes.
For example, if you're on the one minute chart or another low timeframe, you'll be aware of the larger timeframes are about to begin or start.
It's always good to select the lowest timeframe first in ascending order so that the lowest bar is the lowest timeframe and bars that stack on top are larger timeframes.
The default timeframes are:
• 5 minutes (green)
• 15 minutes (yellow)
• 1 hour (orange)
• 4 hour (red)
• daily (blue)
• weekly (purple)
• monthly (gray)
If your chart's timeframe is higher than the timeframe marker you've selected, then it won't display a bar stack for that timeframe as it would normally display on every bar (this is to avoid clutter).
The future timeframe marks basically will offset to future timeframes. Set how many bars forward you'd like to see.

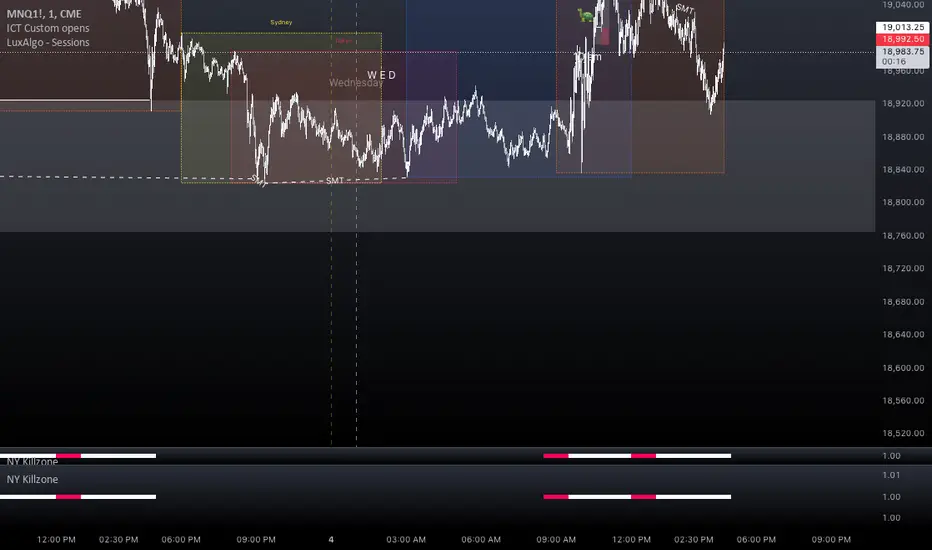
itradesize /\ Time Cycles x Zeussy supplementaryThis is a supplementary script to my previous itradesize /\ Time Cycles x Zeussy script. It should be displayed in a new pane.
This script will display the 30 and 90 AMD Time Cycles, along with the Asia, London, and New York AM & PM sessions in a new pane, based on the times taught by Zeussy.
You have the option to customize which cycles you would like to display, as well as the arrangement of the cycles based on the location of the pane (above or below the current chart).
The script can also be used for backtesting; just uncheck the 'Draw Today's Only' option.
Session timings are as follows:
Asia: 20:00 - 00:00
London: 02:30 - 07:00
NY AM: 07:00 - 11:30
NY PM: 11:30 - 16:00
London Cycles:
- 02:30 - 04:00
- 04:00 - 05:30
- 05:30 - 07:00
AM Cycles:
- 07:00 - 08:30
- 08:30 - 10:00
- 10:00 - 11:30
PM Cycles:
- 11:30 - 13:00
- 13:00 - 14:30
- 14:30 - 16:00
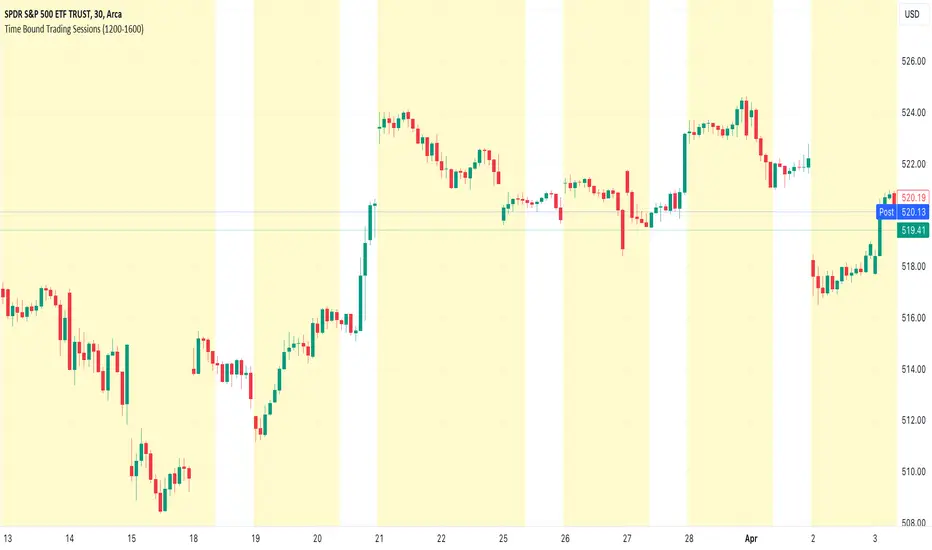
Time Bound Trading SessionsTime Bound Trading Sessions allows to add time bound conditions to your trading sessions given a date range , a time range and/or days of the week .
This indicator can be very handy if you want to control your trading sessions along those three time boundaries, applying them together and/or separately.
Feel free to reuse this code in your own strategy, and leverage the inSession condition as needed.
Features
+ It allows for date range start and/or end to be set.
+ It allows for session time range to be set.
+ It allows for days of the week to be set.
+ It applies chart background color if we are not within the given time bound session parameters.
+ It includes turn on/off functionality.
Settings
Date Range
+ {Start} checkbox: turns on/off start date
+ {Start} date/time
+ {End} checkbox: turns on/off end date
+ {End} date/time
Time Range
+ {Session} checkbox: turns on/off session time range
+ {Session} time range
Days
+ {M} checkbox: turns on/off Mondays
+ {T} checkbox: turns on/off Tuesdays
+ {W} checkbox: turns on/off Wednesdays
+ {T} checkbox: turns on/off Thursdays
+ {F} checkbox: turns on/off Fridays
+ {S} checkbox: turns on/off Saturdays
+ {S} checkbox: turns on/off Sundays
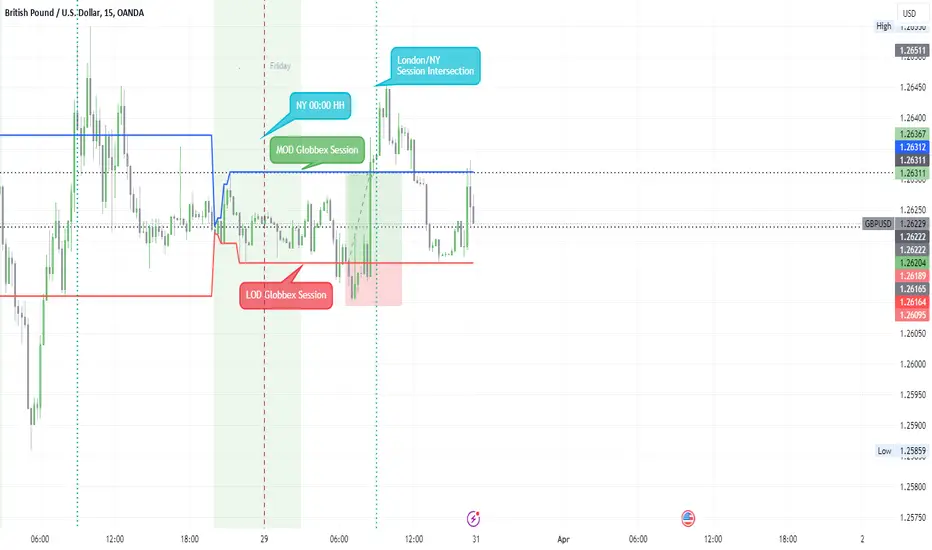
Globbex Session IdTThis indicator allows you to visualize a specific period of time, marking the maximums and minimums they have had.
Additionally, it marks the change of day (NY Time).
The base configuration that the Indicator brings, shows the Globbex session, obtaining the maximum and minimum that it has had.
Marks the London/NY Session Intersection.
Settings
Inputs
Session
Globbex Session Idt
• From HH:MM
• To HH:MM
Globbex Session Check box
o Shows or Hide Session
Display Hour
• Mark - Number of hours after Globbex Session Ends
• We use it to shows the London/NY Session Intersection
Timezone Offset UTC – 4 NY
DIVIDERS
Daily Divider Check box
Style
Background Color checkbox
o Shows or Hide Session
o Can choose the background color
Globbex Low checkbox
o Shows or Hide Low Line
o Can choose the Low Line color
Globbex High checkbox
o Shows or Hide High Line
o Can choose the High Line color
[KVA] Custom Sessions Custom Sessions: Multi-Timeframe Analysis & Key Level Insights
Introduction:
Introducing " Custom Sessions," an innovative Pine Script indicator meticulously crafted to empower traders by offering an advanced level of analysis on various global trading sessions. This tool is designed not just to highlight trading sessions but to delve deeper into the nuances of market movements by analyzing candlestick behavior within those sessions, offering a nuanced view of market trends, liquidity, and potential turning points.
Core Features :
Session Customization : Tailor trading sessions to align with your strategy, focusing on the markets that matter most to you. Whether it's London, New York, Tokyo, Sydney, or Frankfurt, you have the control.
Enhanced Market Insight : Beyond session timing, gain a refined understanding of market dynamics through detailed candlestick analysis within each session, providing a granular view of price action.
Comprehensive Analysis Tools : Alongside session analysis, the indicator includes features like VWAP (Volume Weighted Average Price) and Fibonacci retracement levels, offering a multifaceted approach to market analysis across chosen timeframes.
VWAP : Gain insights into the market's trend and liquidity by viewing the Volume Weighted Average Price calculated for the custom timeframe.
Fibonacci Retracement Levels : Easily identify potential reversal points with automatically plotted Fibonacci levels at 0.236, 0.382, 0.5, 0.618, and 0.782for each candle
Real-Time Updates : As the market moves, so does " Custom Sessions," offering real-time insights that adapt to the unfolding market conditions.
Utilization Guide :
Configure Your Sessions : Begin by setting up the sessions that are most relevant to your trading approach, customizing their times as needed.
Select the Desired Timeframe : Input your preferred higher timeframe to analyze data that is most relevant to your trading strategy.
Dive into the Details : Use the detailed candlestick analysis within sessions to pinpoint potential entry and exit points, supported by VWAP and Fibonacci levels for deeper market insight.
Customize Your View : Adjust the visual aspects of the indicator, including session color coding and which elements to display, tailoring the tool to your preferences.
Acknowledgements :
A special thanks to Aurocks_AIF for their foundational work on "Sessions on Chart" . This project has been an invaluable resource, inspiring the development of " Custom Sessions" and pushing the boundaries of traditional session analysis.
Final Thoughts :
" Custom Sessions" is more than just an indicator; it's a comprehensive analysis tool that brings a new depth to the understanding of market sessions. By offering detailed insights into the behavior of candles within these sessions, along with essential analysis features, this indicator is a must-have for traders seeking to enhance their technical analysis arsenal.
Whether you're a day trader looking to capture short-term movements or a long-term investor seeking broader market insights, this indicator offers valuable data visualization to enhance your trading decisions. By integrating highs, lows, VWAP, and Fibonacci levels into your analysis, you gain a comprehensive view of market behavior across different timeframes and sessions

Sessions Lite [TradingFinder] New York, London, Asia, NYSE Forex🔵 Introduction
A trading session is one of the basic concepts in the financial market that refers to specific time periods. In fact, a session means hours during the day and night, during which traders in a certain part of the world conduct their transactions.
Although the "Forex" and "CFDs" market is open 24 hours a day and it is possible to trade in it, but in some hours the activity in this market decreases so much that many traders prefer not to trade and only watch the market. On the other hand, there are specific times when the market is very busy and dynamic, and many traders tend to trade during these hours of the day and night.
Trading sessions are usually divided into three main categories, which are "Asian", "European" and "North American" sessions. These trading sessions are also called the "Tokyo", "London" and "New York" sessions, respectively. But they also categorized these sessions in more detailed ways such as "Sydney session", "Shanghai session" or "NYSE session".
🔵 Tokyo trading session (Asian session)
After the weekend that happens on Saturday and Sunday, the Forex market starts with the Asian session. In this continent, most of the transactions are done in the Tokyo session, and for this reason, it is usually called the Asian session or the Tokyo session. However, other countries such as Australia, China and Singapore also do a lot of trading in this session.
The Tokyo session has a lower volume of transactions compared to the London and New York sessions, and therefore the liquidity is lower. In this session, most of the Forex currency pairs move in a price range. For this reason, different people use the ups and downs with the trading strategy in the range and get profit.
The low liquidity of the Tokyo session means that trading spreads are also higher during these hours. Besides, most of the transactions of this session are done in the early hours and at the same time as the planned news release.
In the Tokyo or Asia session, the best currency pairs to trade are the "Japanese yen", the "Australian dollar", and the "New Zealand dollar".
"Nikkei" index is also a good option for trading. If you trade in the Tokyo session, you should also be aware of the release of economic news and data from Australian, New Zealand and Japanese financial institutions.
🔵 London trading session (European session)
After the Asian session, it is time for the European session. In this period of time, transactions are very large and many European markets are involved. However, the European session is usually known as the London session.
Because of its specific time zone, London is not only known as the Forex trading center in Europe, but it is also known as the Forex trading center in the world. The London session overlaps with two other major trading sessions in the world, Asia and America. This means that most of the Forex transactions are done in this session. According to the latest statistics, 32% of Forex transactions are related to the London session, which shows that about a third of the activity performed in Forex takes place during this period.
This will increase the volume of Forex transactions and increase liquidity. An event that causes the spread of transactions to decrease. Of course, high liquidity also leads to greater volatility, which is desirable for many traders.
In the European session, the pound and euro currencies and the "DAX", "FTSE100", and "CAC40" indices are known as the best tradable assets. Also, traders of this session should pay attention to the news and data published by the "European Central Bank" and the "Bank of England". The news of countries like Germany, France and Italy are also very important.
🔵 American trading session (New York session)
When the New York session begins, several hours have passed since the end of the Tokyo session, but the European session is in the middle. In this session, they usually affect the financial activities carried out in America, but they also affect other countries such as Canada, Mexico and several South American countries.
The "US dollar" and stock indices such as "S&P", "Dow Jones" and "Nasdaq" are the most important assets that are traded in this session.
The early hours of the American session have a lot of liquidity and volatility due to the overlap with the European session, but with the end of the European session, the activity in the American session also decreases.
You can trade all major Forex currency pairs in the New York trading session. In this session, the "Federal Reserve", as the most important central bank in the world, is the institution that you should pay attention to its news and data.
The trading session indicator is an analytical tool in the financial markets that is used to display and analyze specific trading periods during a day. These indicators are generally useful for determining support and resistance levels during any trading session and for detecting different trading patterns.
For example, usually these indicators display the open and close price levels, the highest and lowest prices during a trading session. Also, you may notice various price patterns such as price channels, price phase phases and market trend changes during different trading sessions using these indicators.
🔵 cause of construction
In particular, the session light indicator version is designed and built for those traders who use many different tools on their chart at the same time. These traders can include "Volume Traders", "ICT traders", "Day Traders" and... These individuals can use "Session Lite" without disturbing the display of their other trading tools such as "Order Blocks", "Liquidity", "Zigzag", "FVG" etc.
But in general, there are several reasons for making tools like trading session indicators in financial markets, some of which include the following :
1. Analysis of specific time frames : Some traders and investors like to consider specific time frames for price analysis and review. For example, analyzing price changes during each trading session can help analyze trading patterns and identify trading opportunities.
2. Recognize different price patterns : Different price patterns may be observed during trading sessions. Trading session indicators can help to make better trading decisions by analyzing these patterns and their strengths and weaknesses.
3. Identifying Support and Resistance Levels : These tools may help to identify support and resistance levels during any trading session which can be helpful in deciding whether to enter or exit the market.
🔵 How to use
The Session Lite indicator displays 8 sessions by default. Asia session, Sydney session, Tokyo session, Shanghai session, Europe session, London session, New York session and New York Stock Exchange (NYSE) session are the sessions that are displayed.
You can activate or deactivate the display of each session by using the tick button next to the name of each session.
Two gray vertical dashes are also displayed by default, which indicate the beginning of the European session and the New York session. This feature is available for all sessions, but it is enabled by default only for these two sessions, and you can activate it for the rest of the session. You can enable or disable the display of this line by using the Start Session tick key.
Likewise, the information table is displayed by default, which includes the open or closed information of each session and the start and end times of each session. These timings are based on the UTC time zone.
Accordingly, the schedule of trading sessions is as follows :
Asia session from 23:00 to 06:00
Sydney session from 23:00 to 05:00
Tokyo session from 00:00 to 00:06
Shanghai session from 01:30 to 06:57
European session from 07:00 to 16:30
London session from 08:00 to 16:30
New York session from 13:00 to 22:00
New York Stock Exchange (NYSE) session from 14:30 to T 22:00
Important note : the beginning of the European session coincides with the opening of the Frankfurt market.
🔵 Settings
• In the settings section, there are customization capabilities according to the type of use of each user. The settings related to showing or not showing the box of each session, the start indicator of each session, setting the start and end time of the session and choosing the desired color to display each session are among the things that can be set from this section.
• At the end of the settings, you will see the "Info Table" option; By disabling this option, the "sessions" clock table displayed on the upper right side will be disabled.

Session breakThis indicator will show future lines before each session start. It will only show London session and US session start.
You can change the color of the lines and time as per day light savings.

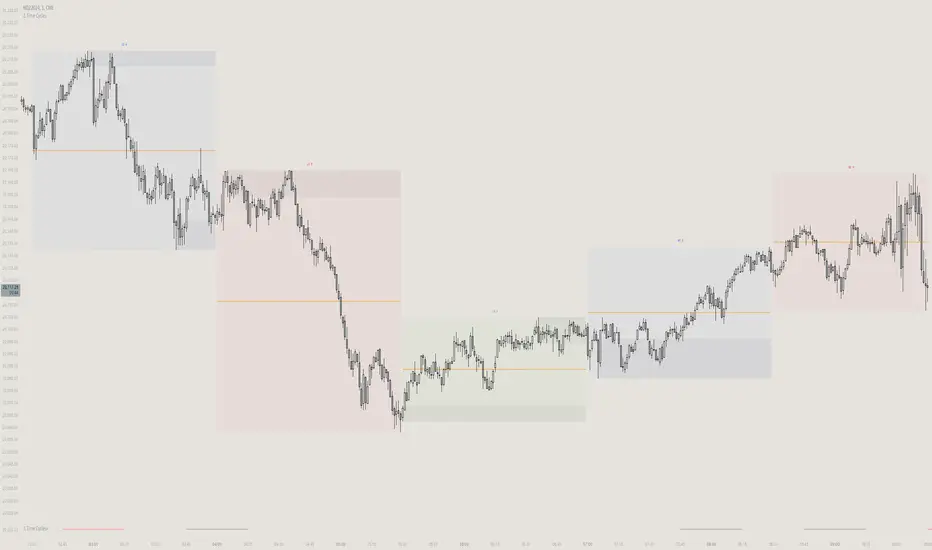
Session Levels Predictor [LuxAlgo]The "Session Levels Predictor" indicator predicts the maximum/minimum levels that will be made within a user-specified session. Hit rate percentages are displayed to measure how often a specific level has been hit.
🔶 USAGE
The indicator can be used to estimate the expected maximum/minimum levels within a specified session, these are directly displayed at the start of a session. This operation can be useful to set take profits/stop losses levels when we expect to exit within a specific session.
Users can display up to 3 upper and lower extremities on their chart (by default only 2 upper and lower extremities are displayed), with their distance from the session opening price being determined by the user-set percentile setting, values closer to 100 will return levels farther away from the session opening price.
Predicting maximum/minimum levels effectively allows obtaining support/resistance levels for the user-defined session, with a breakout probability indicating how easy it can be for the price to reach the estimated levels. These levels can be extended outside the specified session, allowing to test their relevancy as support/resistance levels to prices outside the specified sessions.
🔶 DETAILS
To predict maximum/minimum levels made within a session we keep a record of the distance between a session's maximum/minimum value and the session opening price (opening price when the session starts).
By using the percentile_nearest_rank() on our recorded distances we draw levels from the session opening price. If a level is hit between 2 sessions, this is saved for further calculations.
Lastly, a % hit rate of these levels is shown at the sessions open, indicating the probability that these levels could be hit before the next session.
🔹 array.percentile_nearest_rank()
Returns the value for which the specified percentage of array values (percentile) is less than or equal to it, using the nearest-rank method.
For example, taking the 75th percentile from our recorded distances between the maximum session level and session opening price will return a new distance where 75% of the recorded distances are lower.
The same goes for the green session's open - low levels
🔶 SETTINGS
Session: User-defined session interval, uses the symbol timezone.
Percentile (1, 2, 3): K-th percentile used to estimate session max/min levels, higher values will return more distant levels.
Max Population: Maximum amount of recorded distance data for the calculation of percentiles.
🔹 Style
Extend Middle Line: Toggle to extend the blue Middle Line to the next session - Default disabled

Session Sweeps [LuxAlgo]The Session Sweeps indicator combines ICT-based features for a complete trading methodology involving market sessions, market structure, and fair value gaps to find optimal entry conditions for trading price action.
Traders frequently tend to place stop/limit orders at the high and low points of major trading sessions such as Asian (Tokyo), European (London), and North American (New York), resulting in the establishment of liquidity pools at those particular levels. The Session Sweeps indicator is crafted to recognize and underscore occurrences of session sweeps or liquidity sweeps during these major trading sessions.
🔶 USAGE
Default settings utilize major forex trading sessions, yet users can select their preferred opening and closing times, rename the sessions, or adjust the colors. It's important to note that the specified times for each session align with the respective local timezones: Asian (Tokyo) UTC+9, European (London) UTC, and North American (New York) UTC-5.
If the price briefly crosses either the highest or lowest point of a market session. These movements, aiming at triggering stop losses, suggest potential shifts in the market direction. Detecting such movements is the fundamental purpose and core functionality of the script.
🔹Market Structure Shifts
A Market Structure Shift refers to a change in market direction, either from an uptrend to a downtrend or vice versa. A part of a common entry model when using session sweeps is waiting for the formation of a CHoCH after a session sweep.
🔹Fair Value Gaps
A Fair Value Gap (FVG) holds particular appeal for price action traders, emerging when there are inefficiencies or imbalances in the market, often a result of uneven buying and selling activity. The underlying concept of FVGs is that the market tends to revisit these inefficiencies before resuming its trajectory in alignment with the initial impulsive move.
After the formation of a CHoCH traders can enter a position when the price enters the area of a Fair Value Gap (FVG).
🔹Setup Examples
This entry setup is commonly used by ICT traders and is shared for informational & educational purposes only.
Long Positions (5-Minute Timeframe):
Wait for the previous session's low to be swept.
Look for a Bullish Choch.
Find a Bullish FVG formed by or before the Choch.
Entry Point: At the FVG.
Take Profit (TP): At the session high or aim for a 1:2 Risk-Reward Ratio.
Stop Loss (SL): At the session low or nearest Swing Low.
Take partial profits at intermediate swings, but don’t shift SL prematurely.
Short Positions (5-Minute Timeframe):
Wait for the previous session's high to be swept.
Look for a Bearish Choch.
Find a FVG formed by or before the Choch.
Entry Point: At the FVG.
Take Profit (TP): At the previous session's low or aim for a 1:2 RR.
Stop Loss (SL): At the session high or nearest Swing High.
Take partial profits at intermediate swings, but don’t shift SL prematurely.
🔶 SETTINGS
🔹Session Sweeps
Buyside Sweep Zones, Color, and Margin: toggles the visibility of bullside sweep zones, customizes the associated color, and sets the margin value defining the range of a bullside sweep zone.
Sellside Sweep Zones, Color, and Margin: toggles the visibility of sell-side sweep zones, customizes the associated color, and sets the margin value defining the range of a sell-side sweep zone.
Sweep Margin Length: specifies the maximum allowed length of a sweep zone invalidation, the length over which the price slightly invalidated the margin range.
Detect Sweeps Once per Session: if enabled will detect only once a sweep zone within a session.
Hide Fake Sweep Zones, and Color: controls the visibility and color of the fake sweep zones.
🔹Sessions
Session (Asia, London, New York AM, and New York PM), Start Time, and End Time: enables or disables the visibility of the named market session range, and customization of the session hours.
Color: color customization option of the named session.
Extend Max/Min: extends the highest and lowest price levels of the named session until the end of the next enabled session. This option is recommended to be enabled when sweep zone detection is activated to observe the relationship between the sweep zone and previous session extreme levels.
Extend Mid: extends the mean price levels of the named session until the end of the next enabled session. The extended line may serve as potential support and resistance levels.
Fill: enables/disables background coloring of the named session.
New York DST | London DST: enabling this option initiates Daylight Saving Time (DST) for New York or London. Note: Daylight Saving Time is not applied to the Asian (Tokyo) session.
Sessions Extreme Lines | Sessions Names: toggles the visibility of the highest and lowest price levels, as well as the names, for all market sessions.
Session Lines Width: sets the width of the lines for all sessions.
Session Fill Transparency: sets the background color transparency of the range for all sessions.
🔹Market Structure Shifts
Market Structure Shifts: toggles the visibility of market structure shifts, also known as change of character (CHoCH).
Detection Length: specifies the detection length.
Market Structure Shifts; Bull & Bear: color customization options.
🔹Fair Value Gaps
Fair Value Gaps: toggles the visibility of the fair value gaps.
Fair Value Gap Width Filter: specifies the filtering multiplier; additional details can be found in the tooltip of the respective input option.
Bullish & Bearish Imbalance: color customization options.
🔹Sessions Tabular View
Sessions Tabular View: toggles the visibility of the tabular view of the sessions, displaying date &time, status, and countdown counter.
Hide if not Forex Market Instrument: checks the market and automatically enables/disables the option based on the market instrument.
Table Text Size & Position: size and placement customization options
🔶 LIMITATIONS
Please be aware that fair value gap filtering cannot be applied to the initial 144 candles (with a fixed-length ATR) as the ATR value necessary for filtering won't be available during this period.
🔶 RELATED SCRIPTS
Buyside-Sellside-Liquidity
Sessions
Liquidity-Voids-FVG
Thank you to our community for the recommendation of this script. To explore additional conceptual scripts and related content, we invite you to visit >>> LuxAlgo-Scripts .

Sessions [TradingFinder] New York, London, Tokyo & Sydney ForexTiming is one of the influential factors in a trader's position. This indicator categorizes transactions into three sessions (Asia, Europe, and America). Five significant trading cities (New York, London, Frankfurt, Tokyo, and Sydney) are selectable.
I recommend using the tool on a 5-minute time frame, but it is usable on all time frames.
Settings:
• Trading sessions: Display or hide each trading session as needed.
• Color: Change the color of each box.
• Session time intervals: The default is based on the main working hours for each time interval and can be adjusted.
• Information table: Delete or display additional information table.
Information Table:
• Trading sessions
• Opening and closing times of each trading session
How to Use:
Initiating trading sessions involves entering with increased liquidity, and the market usually experiences significant movements. Many trading strategies are based on "time" and "session openings." This tool empowers traders to focus intensely on each time interval.
These trading sessions are crucial for all Forex, stock, and index traders:
The total price ceiling and floor in the Asia session (Tokyo and Sydney) are crucial for traders in the European session.
The European session starts with Frankfurt, and an hour later, London begins, collectively forming the European session.
The dashboard provides additional information, displaying hours based on UTC.
Customization options are considered in all sections so that everyone can apply their own settings.
Important: Default times are the most accurate for each region, and in most indicators, this time is not correctly selected. Therefore, the level of influence and time intervals are specified at the beginning of each session. If you are using another indicator, match its default time to the announced time and share the results with me in the comments.

VWAP RangeThe VWAP Range indicator is a highly versatile and innovative tool designed with trading signals for trading the supply and demand within consolidation ranges.
What's a VWAP?
A VWAP (Volume Weighted Average Price) represents an equilibrium point in the market, balancing supply and demand over a specified period. Unlike simple moving averages, VWAP gives more weight to periods with higher volume. This is crucial because large volumes indicate significant trading activity, often by institutional traders, whose actions can reflect deeper market insights or create substantial market movements. The VWAP is also often used as a benchmark to evaluate the efficiency of executed trades. If a trader buys below the VWAP and sells above it, they are generally considered to have transacted favourably.
This is how it works:
Multiple VWAP Anchors:
This indicator uses multiple VWAPs anchored to different optional time periods, such as Daily, Weekly, Monthly, as well as to the highest high a lowest low within those periods. This multiplicity allows for a comprehensive view of the market’s average price based on volume and price, tailored to different trading styles and strategies.
Dynamic and Fixed Periods:
Traders can choose between using dynamic ranges, which reset at the start of each selected period, and specifying a date and time for a particular fixed range to trade. This flexibility is crucial for analyzing price movements within specific ranges or market phases.
Fixed ranges allow VWAPs to be calculated and anchored to a significant market event, the beginning of a consolidation phase or after a major news announcement.
Signal Generation:
The indicator generates buy and sell signals based on the relationship of the price to the VWAPs. It also allows for setting a maximum number of signals in one direction to avoid overtrading or pyramiding. Be sure to wait for the candle close before trading on the signals.
Average Buy/Sell Signal Lines:
Lines can be plotted to display the average buy and sell signal prices. The difference between the lines shows the average profit per trade when trading on the signals in that range. It's a good way to see how profitable a range is on average without backtesting the signals. The lines will also often turn into support and resistance areas, similar to value areas in a volume profile.
Customizable Settings:
Traders have control over various settings, such as the VWAP calculation method and bar color. There are also tooltips for every function.
Hidden Feature:
There's a subtle feature in this indicator: if you have 'Indicator values' turned on in TradingView, you'll see a Sell/Buy Ratio displayed only in the status line. This ratio indicates whether there are more sell signals than buy signals in a range, regardless of the Max Signals setting. A red value above 1 suggests that the market is trending upward, indicating you might want to hold your long positions a bit longer. Conversely, a green value below 1 implies a downward trend.

Daye Quarterly Theory ~ DQT [Liquidity_Pro]Thanks
This indicator puts the time-based research of trader Daye on your chart. Daye studied the ICT killzones and macro times and presented his findings, as “Quarterly Theory” on YouTube. Thank you Daye for sharing!
This indicator is not the first, so S/O to @toodegrees, @a1tmaniac and @joshuuu for their own excellent Quarterly Theory indicators. Last but not least, huge thanks go to ICT for his trading innovation and generous free price action education and to @twingall for his insight, attention to detail and great teamwork coding this indicator.
Daye’s Quarterly Theory
First, the fundamental concept is that all units of time can be divided by four into quarters -- just as we look at the year’s corporate reporting cycle of Q1, Q2, Q3, and Q4.
Dividing the day by four, into six hour quarters and again into 90 minute quarters and again into 22.5 minute ‘Micro’ quarters we reach the smallest unit shown by this indicator. Apply it to your NQ1! or ES1! charts and you may see remarkable confluence with the ICT macro times!
Why would we want to do this? It helps us understand, visualize and predict ICT’s PO3 concept:
• A - Accumulation (required for a cycle to occur)
• M - Manipulation
• D - Distribution
• X - Reversal/Continuation
The bottom line - we want to sell after a manipulation (M) up, or buy after a manipulation down and Quarterly Theory plots times on your chart where this may occur. Every asset is different, so back-test and research it.
Note, this indicator always shows Q1 as the accumulation quarter (by color), but the order is not fixed and instead of AMDX may appear as XAMD, where Q1 is the Reversal/Continuation quarter. We may eventually offer an update to this indicator which would automatically transpose the quarter colors for you.
The Quarters
Yearly:
• Q1 - Jan, Feb, Mar
• Q2 - Apr, May, Jun
• Q3 - Jul, Aug, Sep
• Q4 - Oct, Nov, Dec
Monthly (starts with the first month’s Monday regardless of the date):
• Q1 - Week 1, first Monday of the month
• Q2 - Week 2, second Monday of the month
• Q3 - Week 3, third Monday of the month
• Q4 - Week 4, fourth Monday of the month
Weekly (Daye ignores Friday and Sunday’s price action):
• Q1 - Mon
• Q2 - Tue
• Q3 - Wed
• Q4 - Thu
Daily (times are all EST / New York):
• Q1 - 18:00 - 00:00 Asia
• Q2 - 00:00 - 06:00 London
• Q3 - 06:00 - 12:00 NY AM
• Q4 - 12:00 - 18:00 NY PM
90 Minute:
• Q1 - 18:00 - 19:30
• Q2 - 19:30 - 21:00
• Q3 - 21:00 - 22:30
• Q4 - 22:30 - 00:00
Micro (22.5 minute quarters, DQT only displays Micros on 7 minute TF or lower)
• Q1 - 18:00 - 18:22:30
• Q2 - 18:22:30 - 18:45
• Q3 - 18:45 - 19:07:30
• Q4 - 19:07:30 - 19:30
About the DQT Indicator
This indicator plots the quarterly time boxes in a panel which can be placed above or below your chart. It allows you to add labels with the opening time and dates and also place time of day markers which can be useful for anyone who wants to mark lunch, and of the trading day or perhaps a favorite ICT macro time. It also works on GOLD (CAPITALCOM), DXY (TVC), currencies and stocks in Regular Trading Hour (RTH) mode.
Note the way that the indicator displays quarters is affected by the time frame you are viewing and as a result you may notice imperfections. Also, the indicator is not tuned to work with every broker, so for example with DXY, you will see the TVC feed is displayed nicely but other feeds are not.
Settings
The DQT indicator offers a great deal of flexibility to customize the display of quarters aesthetically. But it’s designed to work out-of-the-box on both light and dark background charts. It's set up to only show 90 minute and micro quarters initially, but in the settings, you can turn on the daily, weekly, monthly, and yearly quarters. Remember you will only see the Micros on the 7 minute TF or lower.
Lastly, the DQT indicator works well with our DOB indicator allowing you to visualize the confluence of high timeframe PDAs or POIs with manipulation quarters.
If you find our indicators useful, please boost, comment and share -- it's very motivational for us to develop them further and publish new ones!

chrono_utilsLibrary "chrono_utils"
📝 Description
Collection of objects and common functions that are related to datetime windows session days and time ranges. The main purpose of this library is to handle time-related functionality and make it easy to reason about a future bar checking if it will be part of a predefined session and/or inside a datetime window. All existing session functionality I found in the documentation e.g. "not na(time(timeframe, session, timezone))" are not suitable for strategy scripts, since the execution of the orders is delayed by one bar, due to the script execution happening at the bar close. Moreover, a history operator with a negative value that looks forward is not allowed in any pinescript expression. So, a prediction for the next bar using the bars_back argument of "time()"" and "time_close()" was necessary. Thus, I created this library to overcome this small but very important limitation. In the meantime, I added useful functionality to handle session-based behavior. An interesting utility that emerged from this development is data anomaly detection where a comparison between the prediction and the actual value is happening. If those two values are different then a data inconsistency happens between the prediction bar and the actual bar (probably due to a holiday, half session day, a timezone change etc..)
🤔 How to Guide
To use the functionality this library provides in your script you have to import it first!
Copy the import statement of the latest release by pressing the copy button below and then paste it into your script. Give a short name to this library so you can refer to it later on. The import statement should look like this:
import jason5480/chrono_utils/2 as chr
To check if a future bar will be inside a window first of all you have to initialize a DateTimeWindow object.
A code example is the following:
var dateTimeWindow = chr.DateTimeWindow.new().init(fromDateTime = timestamp('01 Jan 2023 00:00'), toDateTime = timestamp('01 Jan 2024 00:00'))
Then you have to "ask" the dateTimeWindow if the future bar defined by an offset (default is 1 that corresponds th the next bar), will be inside that window:
// Filter bars outside of the datetime window
bool dateFilterApproval = dateTimeWindow.is_bar_included()
You can visualize the result by drawing the background of the bars that are outside the given window:
bgcolor(color = dateFilterApproval ? na : color.new(color.fuchsia, 90), offset = 1, title = 'Datetime Window Filter')
In the same way, you can "ask" the Session if the future bar defined by an offset it will be inside that session.
First of all, you should initialize a Session object.
A code example is the following:
var sess = chr.Session.new().from_sess_string(sess = '0800-1700:23456', refTimezone = 'UTC')
Then check if the given bar defined by the offset (default is 1 that corresponds th the next bar), will be inside the session like that:
// Filter bars outside the sessions
bool sessionFilterApproval = view.sess.is_bar_included()
You can visualize the result by drawing the background of the bars that are outside the given session:
bgcolor(color = sessionFilterApproval ? na : color.new(color.red, 90), offset = 1, title = 'Session Filter')
In case you want to visualize multiple session ranges you can create a SessionView object like that:
var view = SessionView.new().init(SessionDays.new().from_sess_string('2345'), array.from(SessionTimeRange.new().from_sess_string('0800-1600'), SessionTimeRange.new().from_sess_string('1300-2200')), array.from('London', 'New York'), array.from(color.blue, color.orange))
and then call the draw method of the SessionView object like that:
view.draw()
🏋️♂️ Please refer to the "EXAMPLE DATETIME WINDOW FILTER" and "EXAMPLE SESSION FILTER" regions of the script for more advanced code examples of how to utilize the full potential of this library, including user input settings and advanced visualization!
⚠️ Caveats
As I mentioned in the description there are some cases that the prediction of the next bar is not accurate. A wrong prediction will affect the outcome of the filtering. The main reasons this could happen are the following:
Public holidays when the market is closed
Half trading days usually before public holidays
Change in the daylight saving time (DST)
A data anomaly of the chart, where there are missing and/or inconsistent data.
A bug in this library (Please report by PM sending the symbol, timeframe, and settings)
Special thanks to @robbatt and @skinra for the constructive feedback 🏆. Without them, the exposed API of this library would be very lengthy and complicated to use. Thanks to them, now the user of this library will be able to get the most, with only a few lines of code!

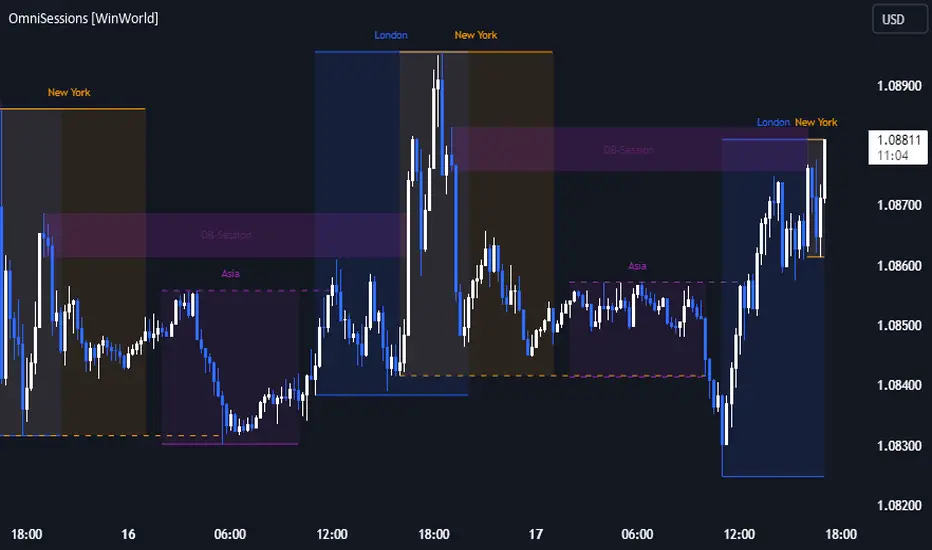
OmniSessions [WinWorld]The indicator shows the range of 4 most popular sessions (New York, Tokyo, London, Sydney). Sessions are used to identify zones with maximum volatility, as well as to find entry points. Session boundaries can act as POI no worse than OrderBlock.
In addition to sessions, you can use settings with KillZones - a range within a session that has potentially high volatility.
Silver Bullet is a more advanced range that allows you to identify the potential for maximum volatility. Excellent entry points can be obtained on the sweep of the range or from the nearest orderblock. We will explain it a bit deeply below.
Why use sessions?
During specific sessions big financial instutions from specific parts of the world enter the market, and this fact alone let us find the most "liquid" sessions in order to catch the best price movements. If talking about orderblocks, it is just a point of interest (more precisely, it is actually a zone of interest), which usually is a zone where the signficant amount of limit orders lies, and when price enter such zone, it immediately shows a strong reaction with either breakout from this zone or it bounces against this zone.
How is this indicator different from others?
There a lot of orderblocks indicator out here publicly available, but huge portion of them doesn't take into calculation important smart money concepts, such as valid pullbacks, for example. Valid pullbacks is a concept of price movement, which lets us indentify quite precisely price's impulses. Based on this impulses, we search our orderblocks. This approach allows to catch the most relevant and highly liquid orderblocks, which present traders with best trade entry opportunities, because usually, when entering with these orderblocks, you follow the moves of big money players, and that gives trader an edge in trading. None of open-source indicators uses such approach ( we've studied all of them ). Also an important notice: no public code is utilized in this indicato whatsoever. We've build our own flexible session mechanism, which allows you to quickly change between different type of sessions and also choose which session to use. And the big thing is our own alorithm to deal with asset, trading sessions of which are quite exotic (such as DAX and MEOX indexes, which close and open at different times of the day, which makes it hard for indicator to catch by default), so with indicator you can enjoy trading by sessions with no "bugs".
And the most user-desired and important thing: we've implemented feature to set winter and summer seasons for sessions, and this solves life-long struggle of traders to set correct trading session time, when forex exchanges switch trading hours, so now you don't need to info which our summer or winter is traded by, but just switch between seasons by one button in our indicator. And we can proudly state, no sesions indicator in the TradingView has such feature , so feel free to use it now on our indicator.
How orderblocks are built?
When London, New York or Asia ends, we find the closest orderblocks above and below closed session's high and low respectively. We do it by finding so called valid pullbacks ( was explained above ), then searching for valid fair value gap (FVG), that is inside of some valid pullbacks, and if we find it, then the orderblock is established and you will live orderblock and fair value gap (FVG) box ( both are colored in closed session's colour ).
How are orderblocks and FVG displayed on the chart?
Live orderblock and FVG are displayed as boxes on the chart, that are plolonged each bar if price didn't reach the orderblock.
Some important details:
When price touches FVG, FVG then is modified to reflect how much of untouched FVG is left. You will see it as decreasing of FVG box size in live mode. If price fully takes over FVG, FVG deletes;
When price touches orderblock, orderblock stops being prolonged and stays on the chart and is considered as worked-out.
These featues allow you to fully see live orderblocks and FVGs (if they exist) and already worked-out orderblocks to see how useful they were in the history.
Is that it?
No, because our indicator also shows sessions sweeps, which is historically a good indication that price grabbed the liquidity of previously closed sessions and now has enough "power" to do big movements, which is a good thing for traders, because it allows them to catch big movements and profit big.
Ok, we've covered the basics, now let's talk about what exactly this indicator can do.
OmnISessions is all-in-one sessions' indicator, that cointain:
Sessions (Automatic adaptation to your time zone)
Kill Zones
Silver Bullets
Session Sweeps
Order Blocks (Session, Killzone, SilverBullet)
Easily switch between summer and winter seasons
Now you don't need to look for opening and closing times of stock exchanges: the algorithm itself adjusts the session times according to your timezone. Just change the seasonality: winter/summer and the session times will be clearly displayed on your chart.
A quick view of the settings:
Show: Sessions, KillZones or SilverBullet
Season selection: Winter/Summer
Session Color Selection
Visuals:
Show/Hide session name - displays session name (ex.: London, New York, Silver Bullet and etc.) on the chart;
Show/Hide session box - displays session range as box with coloured background on the chart;
Show/Hide High/Low sessions - displays two horizontal lines for higher and lower borders of the session;
Show/Hide OrderBlocks - displays worked-out orderblocks in the history with live orderblocks and their fair value gaps (FVGs);
Show/Hide live Session High/Low - displays higher and lower border of the session as lines, that are prolonged each bar even after the session ends;
Show/Hide Session Sweeps - displays session sweeps of higher and lower border as dotted line;
Dividers (alternative session display):
Horizontal Divider
Backgrounder coloring
Customization: choose the display type: Sessions, Killzones or Silver Bullet.
The indicator displays orders that are above or below the previous session boundaries.
Below are Killzones with Order Blocks:
And this is Silver Bullet with Order Blocks:
Overall, you can clearly see that orderblocks, sessions sweeps and different type of sessions in one indicator allow you to fully utilize your time and mental energy, because finding orderblocks with valid pullbacks by hand is quite time-costly task, but finding them on different type of sessions, while not knowing trading hours of current trading session, is the true hell of work. OmniSessions indicator performs all of these calculations by itself, so you can focus on finding the best entries, while checking the situation on different sessions at the same time.
We hope that you will find great use of OmniSessions!