TREX
TREX or TPA indicator by SOTTI
// The basic version and start of this indicator was set by my good friend Mr Shayan Karimi and we have room to learn from him and this text is here to make this happen.
//This indicator is taken from Master Saeed khakestar indicator
//Trigger price action -- True Range Exchange -- TPA - TRex
how to use this indicator:
this indicator for price action system and use full for student of master saeed khakestar
you can use tp1 for stop loss and tp3,7,15 for target you finde a flag limit on this area and set your tp or target
and use th or tr for price how much can be run and live use for price how much runned
TP1 = ATR time
PI.SL = TP1 + ENG.sl = pivot stop loss
ENG.sl = 0.25* TP1 = triger price actions stop loss
TP3 = 3*TP1
TP7 = 7*TP1
TP15 = 15*TP1
TH -> tavan harkati
TR -> True range average
LIVE -> live range candel
TP1 = توان حرکتی تایم که در ان هستیم
PI.SL = توان حرکتی تایم + میزانی که از نفوذ هار در امان باشیم
ENG.sl = یک چهارم ای تی ار تایم
TP3 =سه برابر تارگت اول
TP7 = هفت برابر تارگت اول
TP15 = پانزده برابر تارگت اول
TH -> توان حرکتی
TR -> میانگین توان حرکتی
LIVE -> میران حرکت کندل لایو
TH.long = گام بلند حرکتی
TH.small = گام کوتاه حرکتی
In den Scripts nach "央行:下调个人住房公积金贷款利率0.25个百分点" suchen

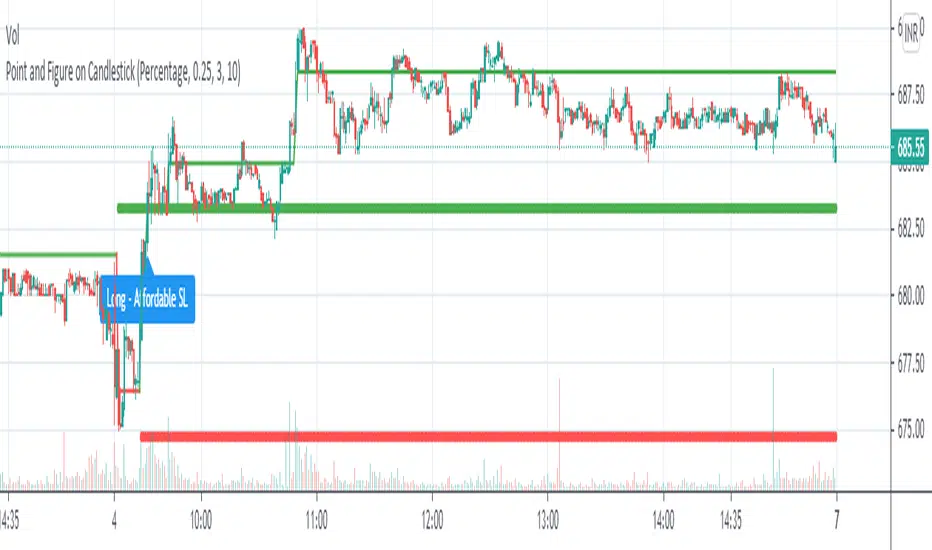
Point and Figure on Candlestick ChartLive plotting of Point and Figure chart on a candlestick chart. With its own construction engine, it plot "X" and "O" column using a line chart. It plots the "X" column with green color and the "O" column with red color. Color of the line chart change from green to red when the column reversed from "X" to "O". It plot "Double Top Buy" and "Double Bottom Sell" level which help to do candlestick pattern analysis along with Point and Figure chart. Works on all timeframes with given parameters.
Options :
Box Size Assignment Method : Select a method to construct Point and Figure chart. There are two options "Fix" and "Percentage". The default value is "Percentage".
Box Size : The size of box. Minimum price movement to plot a new box. Smaller box size shows greater price movement and Bigger box size shows more filtered price movement compare to smaller box size. The default value is "0.25%"
Reversal Size : Minimum boxes required for column reversal. The default value is "3".
Stoploss Size In Box : To get affordable trade give the number of boxes for stop loss.
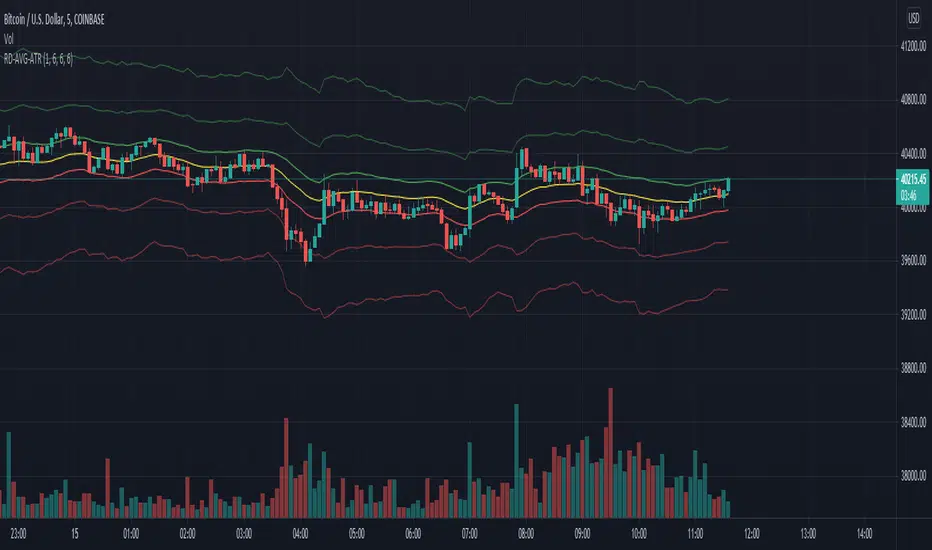
RexDog Average with ATRBam-- look what Rex did. A RexDog Average with ATR bands-- he's going insane. Simple but powerful.
This indicator includes the RexDog average but provides you with the ability to plot (and customize) both above and below ATR calculated bands.
With this indicator you can display all 3 or any combination of the bands: the RexDog Avg, Adding ATR Upper or the Subtracting ATR Below.
To remove a plot or customize color and line size go to the style options.
Before we get detailed with this version you can customize the default average factor of the RexDog Avg (default is 6). More tips on this below.
How This Works
Just as with the RexDog Average we take the 6 ATR data points (200, 100, 50, 24, 9, 5). We then create an average by dividing by 6. But wait there's more...
With this indicator you can customize independently the above and below bands via a float value for precision. 6 is the default (you can customize by increments at 0.25 or input value you like 1-20).
Now this works opposite how you might think but you'll get it once you start changing the numbers. For instance, editing the above band lowering the ATR factor will raise the band.
RexDog Avg Factor
With this release you are able to change the default average factor (6) to anything you want. You'll find though going too high or low from the default won't get the best results. The default increment change is 0.1 but you can enter any float value you like between 1-20.
The Original RexDog Average Overview
Yes, simple—the RexDog Average is a bias moving average indicator. The purpose is to provide the overall momentum bias you should have when trading an instrument. It works across all markets and all timeframes.
Usage:
Price above the RexDog AVG = long momentum bias
Price below the RexDog AVG = short momentum bias
With the ATR addition most likely your usage will be similar to Bollinger Bands. While not the same as in deviations much of the same principles might apply, especially with customization.
*Note: we have banned the word “trend” in the RexDog Trading Method.
Additional Usage Advice:
If price rips through the average your momentum bias should probably change. 80% of the time when price moves through the RexDog Average it will come back and test the area around average within 1-2 bars. 20% of the time it does not. The momentum is so strong in that direction so look for a 50-70% tests of the bar that impulse through the RexDog Average.
If you are using the RexDog Trading Method by default if the price is above the average and you are short you are in a fade trade. The momentum trade would be long. Of course reverse if price is below.
On multiple time frames. Of course, one timeframe can be long bias and a lower timeframe can be short bias. Which one do you use? Both—if your in a short trade using lower timeframe and with the bias of the average your in a momentum trade—but on the higher timeframe your aware you are essential fading the overall momentum.
Background:
Rex and I searched high and low for one simple thing. A moving average (or combination of some) that we could use to form our momentum bias that worked for all timeframes and all markets we trade.
We tried and tested them all. Even went down the path of ribbons and various other types of hybrid EMA /MA derivatives. Nothing had a high enough accuracy or mathematically was reliable that we could say with a high probability that it was on the right side of the momentum.
We almost stopped and landed on using the true and tested 200 MA—but we found through extensive tests that using the 200MA or EMA you’re often late to the party. Look you don’t need to be the first one in the trade but having a heads up sure helps.
To quote one of the best financial movies of the modern era—Margin Call:
“There are three ways to make a living in this business: be first, be smarter, or cheat… it sure is a hell of a lot easier to be first”. The RexDog Average used properly enables you to be first or damn near close.
Under the Hood:
This is so simple most reading this will discount it. You might even scoff and berate Rex for wasting your time. But you would be wrong. The RexDog Average has been tested across all markets—FOREX, Crypto, Equities, Futures (even tick charts), and even the Penguin population in Antarctica.
The RexDog Average is an average of 6 simple moving averages: 200, 100, 50, 24, 9, 5.
Yes, that’s it.
Bollinger Bands + RSI Alerts for 3commas/DCA botHey Folks !
This is in indicator that generates buy alerts combining Bollinger Bands and RSI.
RSI validates the BB signal by confirming we are not in an oversold area.
Interval: 3m to 15m
Recommended settings for 3commas DCA bot
- TP/TTP: 0.3%/0.1%,
- Base Order: Your choice ,
- Safety Order: 1.2 * Your choice of base order
- Safety Order Volume Scale: 1.2,
- Safety Order Step Scale: 1.5,
- Price Deviation to Open Safety Order (% from initial order): 0.25%,
- Max Safety Trades Count: 7
- DO NOT USE STOP LOSS
> Create Alert with Buy Alert and link it to "Message for deal start signal"

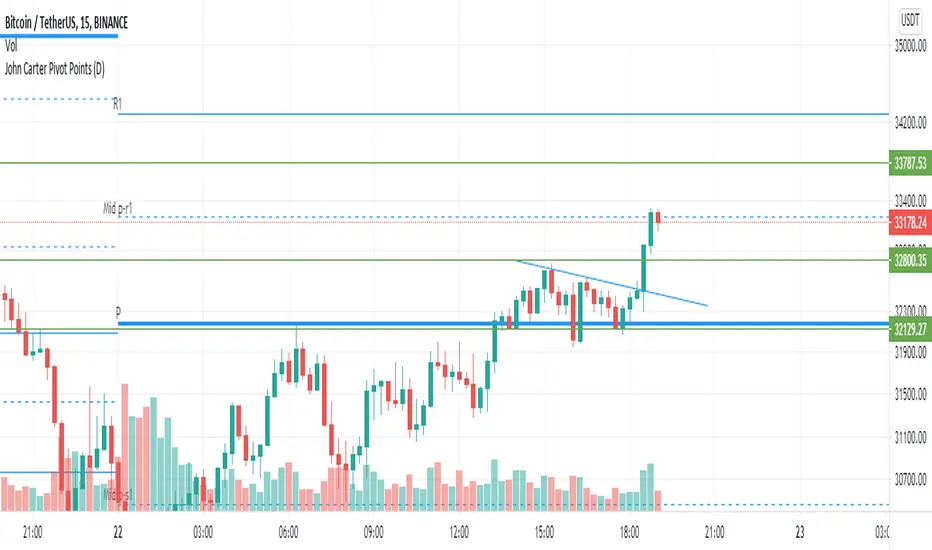
John Carter Pivot Points
This script is based on John Carter Mastering The Trade book. Pivot calculation is based on the previous day high, low, and close.
What Are the Trading Rules for Pivot Buys on Trending Days?
Sells are reversed.
1. Each day I update the appropriate pivot levels on the charts to reflect the previous day’s action. On Mondays, I also
update the weekly pivots, and on the first trading day of a new month, I update the monthly pivots.
2. The first pivot play is done in conjunction with the gap, if there is one. If there is a gap down, then I buy a decline into
the closest pivot level. If there isn’t a playable gap (more than 10 YM points or 1 ES point), then I will wait until
9:45 a.m. eastern to initiate the first play.
3. If the volume on the five-minute ES chart is more than 25,000 contracts, then I’ll wait for the markets to penetrate a
pivot level and move up at least a quarter of the way to the next pivot level. Once this happens, I will then set up a
bid to buy the first retracement back to the violated pivot level.
4. I enter my trades with limit orders only. I place orders “just in front of” the pivot. For the YM, I use 3 points; for the
ES, 0.25 point; for the NQ, 0.50 point; for the TF, 0.20 point; and for individual stocks, 5 cents. For example, if I’m
trading the YM and the pivot level is 10,000, then I would buy a decline to 10,003 and short a rally to 9997
.Sometimes the pivot will be an odd number, such as 1117.38 on the ES. In this case, I always round in the direction of
the trade. So, if I’m bidding for a long, I will round 1117.38 to 1117.50, and my bid will be 1117.75. If I’m offering a
short, I will round 1117.38 down to 1117.25 and place my offer at 1117.00. My stops and targets, then, would be “just
in front of” these appropriate long and short levels.
5. Once filled, I place an order to close the first half at the next pivot level and the second half at the pivot level after
that, using the same “just in front of” parameters.
6. I place a stop at 20 points for the YM, 2 points for the ES, 4 points for the NQ, and 1.50 points for the Russell. For
stocks, I will use a stop based roughly on the price of the stock. If the stock is under $10 a share, I will use a stop of
20 cents. If it is between $10 and $20, I will use a stop of 30 cents; if it is between $20 and $30, I will use a stop of
40 cents, and so on, adding another 10 cents for each $10 increment in price. (A $75 stock would have an 80-cent
stop, for example.)
7. If the first target is hit, I will then move up the stop to my entry-level pivot, minus the “just in front of” fractions
discussed in rule 3. For example, if I get in a YM long at 10,003 and the pivot is at 10,000, then my new stop would
be 9997 once the first target is hit.
8. If I am in a trade at the market close and neither my stop nor my target has been hit, I will close out my position “at the
market” at 4:10 p.m. eastern for futures, and at 3:58 p.m. eastern for stocks.
9. I don’t initiate any new positions after 3:30 p.m. eastern, but I will manage existing positions into the close.
10. The markets rarely have a sustained move above R3 or below S3. If I trade to those levels, I will always fade the
move.
11. After two losers in a row, I’m done with pivots for the day.
What Are the Trading Rules for Pivot Buys on Choppy Days?
Once again, sells are the same, just reversed. The rules for choppy days are identical except for the targets. On choppy days, I
just focus on the YM and the ES. My first target is mechanical: 10 points for the YM and 1 point for the ES on half of my
position. Once this is hit, I will trail up my stop in the same way I would for a trending trade. The second target becomes the
“just in front of” level for the actual next pivot level
Custom GAP UP scanner for NIFTY StocksThe security function can be called 40 times in a codescript. We can therefore scan about 40 stocks out of NIFTY 50 stocks with a single script.
This code can be modified to search for other scripts by changing the condition function
condition() => open > (close * 1.0025)
Only stocks which have gap up of 0.25% or more will be reported.

|AG| VWAP ANALYSIS|AG| VWAP ANALYSIS
The volume-weighted average price (VWAP) is a trading benchmark used by traders that gives the average price security has traded throughout the day, based on both volume and price.
It is important because it provides traders with insight into both the trend and value of the security.
VWAP is calculated by adding up the $ traded for every transaction (price multiplied by the number of shares traded) and then dividing by the total shares traded.
A detailed formula and calculations could be found here:
-> fanf2.user.srcf.net
Actually, TradingView has an option for Anchored Vwap is a really good implementation for specific analysis.
The following script takes into account the #Time_Period_Change and plots the VWAP calculation.
The #Time_Period Available for this script are:
-> Day
-> Week
-> Monthly
-> Quarter
-> Year
1. The option that we have is the SOURCE:
-> HLC3 (High, Low, Close)/3 is the right way to calculate VWAP.
-> But I included other traditional options:
-> open, high, low, close, hl2, hlc3, ohlc4
2. The option of Turn ON/OFF VWAP
-> Timeframe selection:
-> All, 1. Day, 2. Week, 3. Month, 4. Quarter, 5. Year, 6. >=Weekly, 7. >=Montlhy
-> With this, we could select the time for plotting the VWAP. And some cool features such as >= that we are going to plot different Timeframes VWAP calculations.
-> Vwap Label:
-> We could select if show labels or not
3. The option of Turn ON/OFF Previous VWAP Level
-> VWAP of one selected Time Period is going to end with a final price this level most of the time is retested and gives us a good opportunity for entry into one trade.
Or could be used as Stop Loss.
-> Timeframe selection:
-> 1. Day, 2. Week, 3. Month, 4. Quarter, 5. Year, 6. >=Weekly, 7. >=Montlhy, 8. >=Daily
-> Factor
-> The factor options lead as increment the extension of the previous time period.
-> Example: D is the normal time period and with factor, we change from 1D to 2D in order to extend previous levels of VWAP.
->The Factor option is only available in 1. Day and 2. Week. With a Min Value of 1 and a Maximum Value of 50.
-> Labels:
-> We could select if show labels or not
4. The option of Turn ON/OFF Standard Deviation Bands
-> Label:
-> We could select if show labels or not
-> Timeframe selection:
-> 1. Day, 2. Week, 3. Month, 4. Quarter, 5. Year
5. The option of Turn ON/OFF Previous Standard Deviation
-> Timeframe selection:
-> None, 1. Day, 2. Week, 3. Month, 4. Quarter, 5. Year, 6. >=Weekly, 7. >=Montlhy, 8. Quarter & Year
-> STDEV LEVEL
-> Since there are different options for Standard Deviation I included 4 options
-> 1
-> 2
-> 3
-> User Selection
-> In this option we could select any NUMBER for STVDEV 0.25 of step.
-> Label:
-> We could select if show labels or not
6. The Lockback Setting
-> This Script also includes an option to only plot a certain amount of days back.
The main reason in order to have a more clear chart.
-> We could select between:
-> PLOT ALL
-> CUSTOM
-> If we select Custom Then we could select the Number of Days Back that is going to be plotted.
7. Color Theme
Here we select the color (Visual Desing)
-> Color Theme
-> Text Color
-> Here I use the recent input.color option added for TradingView making the color selection really simple
8. Time Period Highlighter
-> In this option, we could select one time period in order to plot one tiny background and identify the change in the time period.
-> Timeframe selection:
-> 1. Day, 2. Week, 3. Month, 4. Quarter, 5. Year
9. Label Offset
-> Finally, this option leads us to change the position of the labels into the X-axis by default 20.
This script has many options the combinations and the possibilities of making different analyses are bast.
Here some examples of what we could make:
DEFAULT SETTING:
PREVIOUS VWAP FOR TIME PERIOD >= WEEK
(work good as S&D levels)
PREVIOUS VWAP Week WITH A FACTOR OF 4
STANDARD DEVIATION BANDS - DAY
STANDARD DEVIATION BANDS - WEEK
STANDARD DEVIATION BANDS - MONTH
STANDARD DEVIATION BANDS - QUARTER
STANDARD DEVIATION BANDS - YEAR
PREVIOUS STANDARD DEVIATION - DAY SDTV 3
PREVIOUS STANDARD DEVIATION - WEEK SDTV 3
USING STANDARD DEVIATION BANDS - WEEK
WITH LOCKBACK -> PLOT ALL
WITH CUSTOM 30 DAYS
I think the options possibilities of analysis using #VWAP are truly awesome.
I like the relationship that one previous VWAP has with Standard Pivot Points.
Good Luck,
Anderson,

Hull FisherThis strategy has a Fisher-Transform indicator applied to the highs and lows of a Hull moving average instead of the price. It also has a Commodity Channel Index to help with entry/exit. Each part of the strategy can be turned on and off, for example turn off CCI or HMA so they are not used in the order opening/exiting. The base of the strategies entry and exit logic is the fisher transform line, if it crosses over outside the lines or either side of zero (adjustable in settings).
This example on ETHBTC Daily chart has common crypto exchange commission 0.25% added. Please adjust that setting to suit your pair/broker. For example a Forex pair does not have that much commission so reduce it for Forex charts.
Can be applied to any time frame or trading instrument.

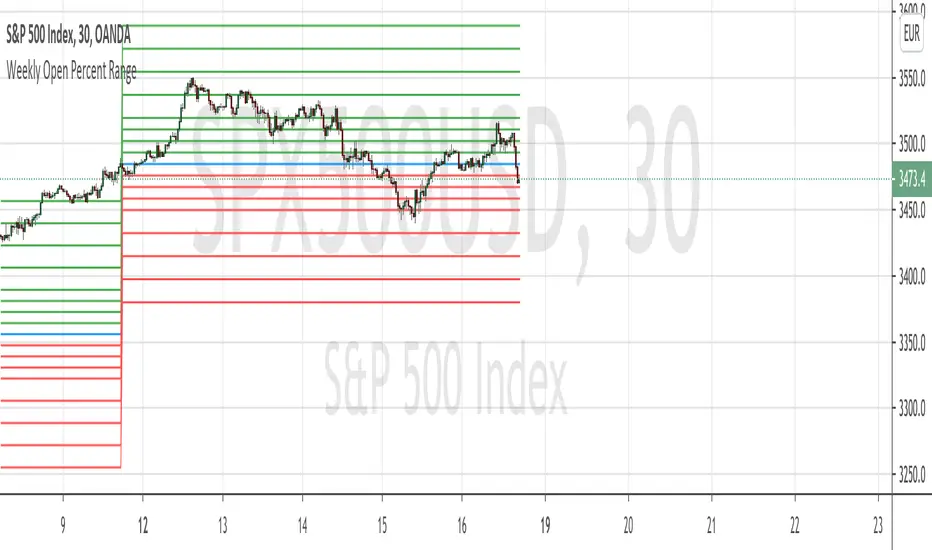
Weekly Open Percent RangeA simple take on finding percentage gain/drop range in a week for ranging or trending market instrument.
This script is hard coded to plot 0 to 3%, -3% range for the week base on instrument weekly open price.
Best to use with measured volatility indicator to gauge the movement of price. Anytime the price goes above the range level then it is likely to be trending. Highly volatile instruments will not find this indicator useful. It is best for heavy instruments like Forex or Indices where range % in a week in a non-volatile move is really quite small that these act as resistances and support.
Range Levels:
3%
2.5%
2%
1.5%
1%
0.75%
0.5%
0.25%
0%
-.25%
-.5%
-.75%
-1%
-1.5%
-2%
-2.5%
-3%
The next step for this indicator is to consider volatility range of instrument and to include this in the percentage zone levels instead of hard coding these.
Easy System 420In this strategy, 15 indicators are used, each giving its results as a numerical value, which then is added or subtracted from the total points, gathered from all 15 indicators.
Many thanks to RafaelZioni for his great work making the EasySys1 script which i modified to create this script.
Onchart is drawn some of the indicators, but not all, a info panel is drawn showing the value each indicator has calculated. The info panel can be turned on or off.
Many of the indicator settings can be changed by user, and this is recommended, to tune the strategy to users chosen pair/timeframe.
Therefore any pair or timeframe can be used, the strategy tester results showing possible results, remember to set commission to match your broker. example chart settings here have common crypto exchange commission value: 0.25%
indicator list : SAR + STT + ZigZag + ROC + DMI + CCI + Weis + SMA + AO + MOM + Hist + BB + Ichimoku + HMA

Ultimate VWAP Bands- Ultimate VWAP Bands is a script that helps to decide and further clarify areas of oversold and overbought conditions.
- For example, when the price is in the lowest band it is extremely oversold relative to the VWAP . Hence it should be considered a good place to buy with a high risk to reward payoff.
- Each band is set at a fixed offset away from the VWAP . The "VWAP Band Multiplier" adjusts this and is a key part of the script. This allows the indicator to be adjusted based on the assets volatility . For example, with Crypto. A multiplier of 1 would be strongly advised. Whilst a multiplier of 0.1-0.25 would be useful for currency pairs.
- This indicator can be used for all manners of trading. However, it is most effective when used for scalping and swing trading.

Hull Moving Average vs CandleA Hull moving average is applied to the chart with settings for user to change the period of the Hull MA.
And a value of a previous candle is compared to the HMA. If the HMA is above the previous candle value, then the strategy will buy.
If below, it will sell. The default setting for the HMA is 50 and the Candle is D1 (Daily timeframe)
So basically if the HMA value is greater than yesterdays candle open, buy. ( i use open as a price source to avoid repainting)
This example is put onto ETHBTC chart and currency changed from default to BTC and Equity set to 1 BTC and commission set to 0.25%
The ETHBTC chart seems to follow good old moving average more than other pairs.
The strategy can be used on any pair and timeframes.
A good idea for setting the HMA period is:
small timeframe=big period, big timeframe=small period.
range from period=3 to period=200 is about right, for charts from 4H to 1 minute.
This HMA strategy is fairly simple, best to use other sources of information in combination with moving averages.
And strict money management, risk/reward control is very important to any trading strategy.
Not intended as stand alone strategy but has potential for bot use, i will publish a study version soon, for use with alerts and API bots.

Filter Amplitude Response Estimator - A Simple CalculationIn digital signal processing knowing how a system interact with the frequency content of an input signal is extremely important, the mathematical tool that give you this information is called "frequency response". The frequency response regroup two elements, the amplitude response, and the phase response. The amplitude response tells you how the system modify the amplitude of the frequency components in the input signal, the phase response tells you how the system modify the phase of the frequency components in the signal, each being a function of the frequency.
The today proposed tool aim to give a low resolution representation of the amplitude response of any filter.
What Is The Amplitude Response Of A Filter ?
Remember that filters allow to interact with the frequency content of a signal by amplifying, attenuating and/or removing certain frequency components in the input signal, the amplitude (also called magnitude) response of a filter let you know exactly how your filter change the amplitude of the frequency components in the input signal, another way to see the amplitude response is as a tool that tell you what is the peak amplitude of a filter using a sinusoid of a certain frequency as input signal.
For example if the amplitude response of a filter give you a value of 0.9 at frequency 0.5, it means that the filter peak amplitude using a sinusoid of frequency 0.5 is equal to 0.9.
There are several ways to calculate the frequency response of a filter, when our filter is a FIR filter (the filter impulse response is finite), the frequency response of the filter is the absolute value of the discrete Fourier transform (DFT) of the filter impulse response.
If you are curious about this process, know that the DFT of a N samples signal return N values, so if our FIR filter coefficients are composed of only 5 values we would get a frequency response of 5 values...which would not be useful, this is why we "pad" our coefficients with zeros, that is we add zeros to the start and end of our series of coefficients, this process is called "zero-padding", so if our series of coefficients is: (1,2,3,4,5), applying zero padding would give (0,0...1,2,3,4,5,...0,0) while keeping a certain symmetry. This is related to the concept of resolution, a low resolution amplitude response would be composed of a low number of values and would not be useful, this is why we use zero-padding to add more values thus increasing the resolution.
Making a Fourier transform in Pinescript is not doable, as you need the complex number i for computing a DFT, but thats not even the only problem, a DFT would not be that useful anyway (as the processes to make it useful in a trading context would be way too complex) . So how can we calculate a filter amplitude response without using a DFT ? The simple answer is by taking the peak amplitude of a filter using a sinusoid of a certain frequency as input, this is what the proposed tool do.
Using The Tool
The proposed tool give you a 50 point amplitude response from frequency 0.005 to 0.25 by default. the setting "Range Divisor" allow you to see the amplitude response by using a different range of frequency, for example if the range divisor is equal to 2 the filter amplitude response will be evaluated from frequency 0.0025 to 0.125.
In the script, filt hold the filter you want to see the frequency response, by default a simple moving average.
The position of the frequency response is defined by the "Show Amplitude Response At Bar Number" setting, if you want the frequency response to start at bar number 5000 then enter 5000, by default 10000. If you are not a premium set the number at 4000 and it should work.
amplitude response of a simple moving average of period 14, res = 2.
By default the amplitude response use an amplitude scale, a value of 1 represent an unchanged amplitude. You can use Dbfs (decibel full scale) instead by checking the "To Decibels (Full Scale)" setting.
Dbfs amplitude response, a value of 0 represent an unchanged amplitude.
Some Amplitude Responses
In order to prove the accuracy of the proposed tool we can compare the amplitude response given by the proposed tool with the mathematical function of the amplitude response of a simple moving average, that is:
abs(sin(pi*f*length)/(length*sin(pi*f)))
In cyan the amplitude response given by the proposed tool and in blue the above function. Below are the amplitude responses of some moving averages with period 14.
Amplitude response of an EMA, the EMA is a IIR filter, therefore the amplitude response can't be made by taking the DFT of the impulse response (as this ones has infinite length), however our tool can give its frequency response.
Amplitude response of the Hull MA, as you can see some frequencies are amplified, this is common with low-lag filters.
Gaussian moving average (ALMA), with offset = 0.5 and sigma = 6.
Simple moving average high-pass filter amplitude response
Center of gravity bandpass filter amplitude response
Center of gravity bandreject filter.
IMPORTANT!: The amplitude response of adaptive moving averages is not stationary and might change over time.
Conclusion
A tool giving the amplitude response of any filter has been presented, of course this method is not efficient at all and has a low resolution of 50 points (the common resolution is of 512 points) and is difficult to work with, but has the merit to work on Tradingview and can give the frequency response of IIR filters, if you really need to see the frequency response of a filter then i recommend you to use the function freqz from the scipy package.
I still hope you will enjoy using this tool to have a look at the amplitude responses of your favorite moving averages.
I'am aware of the current situation, however i'am somehow feeling left out from the pinescript community, let me know via PM if i have done something to you and i'll do my best to fix any problems i might have caused (or i might be being parano xD)

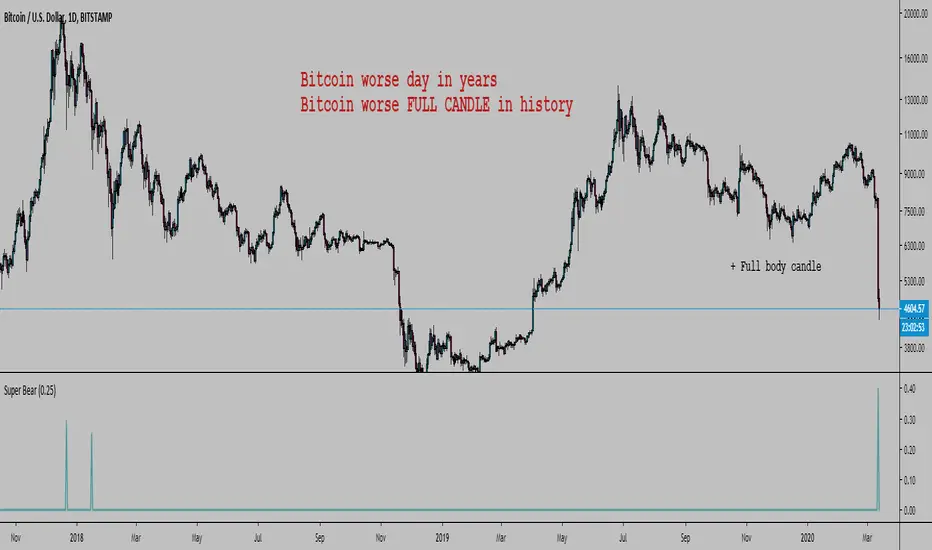
Bitcoin Worse DaysHello, here is a simple script to scan for BTC worse days.
In input you tell the script what are the minimum percent drops to look for.
By default it is 0.3, here I set it at 0.25 or it would not show anything except the 12 March (which is 40.07%).
The indicator has a precision of 1% I think.
It does not look at how low the body closed, it will show all days that closed below where they opened looking at how far below the high of the day the low was.
It can also work on any timeframe.
Here were the previous worse days from the late 2017 crash start of the bear market:
You could modify the script and look for the worse bodies with open - close instead of high - low
You could also add a filter to only look at days where the body is > 90% the whole candle (in this case it's got to be about 99%)
We can look back at BTC past a bit
Every bear market started with a large drop so we can expect...
As you can see we can look at the weekly chart too:
I won't lie, I am pretty happy. Russia, China bat eating community, and Greta were a big help. Thanks guys.
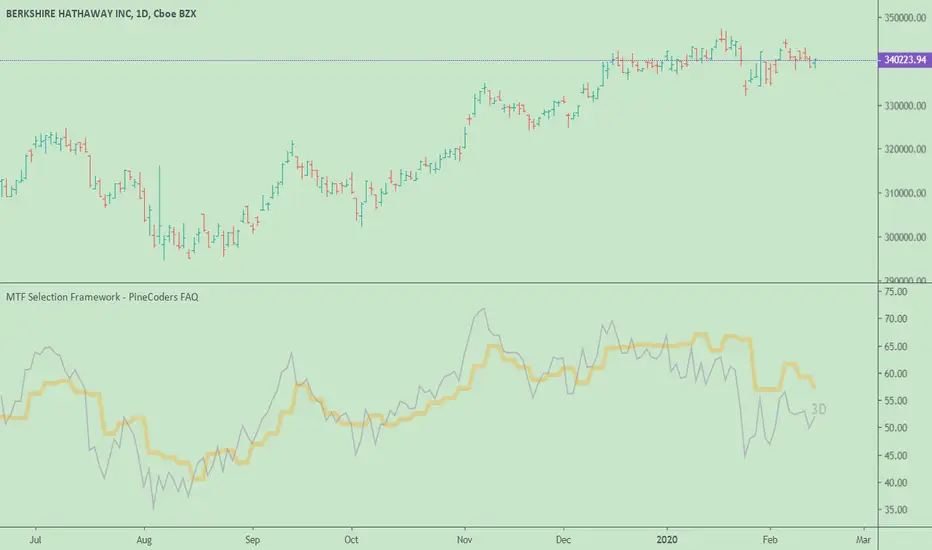
MTF Selection Framework - PineCoders FAQOur MTF Selection Framework allows Pine coders to add multi-timeframe capabilities to their script with the following features:
► Timeframe selection
The higher timeframe can be selected using 3 different ways:
• By steps (60 min., 1D, 3D, 1W, 1M, 1Y).
• As a multiple of the current chart's resolution, which can be fractional, so 3.5 will work.
• Fixed.
► Non-repainting or Repainting mode can be selected.
► Smoothing of the HTF line
Can be turned on/off and a smoothing factor allows the user to select the degree of smoothing he requires.
The framework is used here to create a higher timeframe version of a simple RSI line, but it can be used to access HTF information for almost any signal.
Functions used
f_resInMinutes()
Converts the current timeframe.multiplier plus the TF into minutes of type float.
• In Pine, the timeframe.multiplier is an integer representing the resolution, but a value of 1 can mean one day or one minute. This function converts that information in a standard fractional float minutes format that can then be used by the other functions in the framework.
• If the chart's current resolution is 15 seconds, the function will return 0.25 . If the chart's resolution is one day, it will return 1440 .
f_tfResInMinutes(_resolution)
Returns resolution of _resolution period in minutes.
• This function does the same as f_resInMinutes() , but on the target resolution supplied as a parameter in the timeframe.period string format.
f_resNextStep(_res)
Given a current resolution in fractional float minutes, returns its corresponding stepped HTF in the timeframe.period string format.
• This allows the implementation of the step HTF selection mode.
f_multipleOfRes(_res, _mult)
Given a current resolution in fractional float minutes and a fractional multiplier, returns a multiple of the resolution as a string in "timeframe.period" format usable with "security()".
• A multiple like 3.5 is allowed.
• Note that with seconds resolutions, the result returned is constrained by the discrete seconds resolutions available on TV.
f_htfLabel(_txt, _y, _color)
Used to display a label showing either:
• A warning when the chart's resolution is not lower than the HTF.
• The HTF resolution currently used.
The y position used to position the label will require adaptation to the signal you are using. For use in "overlay = true" mode, a technique that works well is commented out in the code.
Look first. Then leap.
Hancock - Filtered Volume OBVThis idea was taken from "Trading Systems and Methods - 2013".
"The decision to remove low volume days, or intervals, means that a series of low volume days that results in a collective change will be ignored. If you have decided that removing those days makes sense, then measure the daily or intraday volume against a threshold created using the average volume minus one or two standard deviations of the volume.
Using a 1 standard deviation filter will remove the lowest 16% of the days; a 2 standard deviation filter removes 32% of the days. This type of filter is best applied to a volume index, such as On-Balance Volume. For example, we find that the average volume on the New York Stock Exchange is 1.5 billion shares, and 1 standard deviation of the volume is 0.25 billion shares. We decide that the volume filter is 2 standard deviations; therefore, any day with volume below 1.0 billion shares will be ignored." - Trading Systems and Methods, 2013.
This has a signal line ema which is subtracted from the volume filtered OBV to produce a simple oscillator giving signals above or below the 0 line.
Happy Trading
Hancock

ATR-ranged Donch on 15min// This is a simple Mean Reversion & Breakout Indicator.
// A Donchian Channel is plotted. A threshold equal to 0.25 of Daily ATR.
// If price reverses from this threshold, then it can be taken as possible Mean Reversion.
// If price crosses the previous Donchian levels, it can be taken as a possible breakout.
// Typical of such strategy is the whipsaw effect when price movement is just flat.
// I have marked the region where the lower and higher thresholds are closer to be an indicative of whipsaw.
// But it is not really effective to avoid whipsaw.

CPR WidthThe indicator shows the width of the Central Pivot Range. Frank Ochoa call it It Pivot Range Histogram in his book.
Use it in conjunction with the Central Pivot Range indicator.
Below is the interpretation of the reading.
CPR Width > 0.5 - Sideways or Trading Range Day,
CPR Width > 0.75 - increases the likelihood of sideways trading behavior,
CPR Width < 0.5 - Trending type of day,
CPR Width < 0.25 - increases the likelihood of a trending market.
The above reading only increases the likely-hood of the possibility and not always right.

Turbo Scaler - The Art Of Being (too) EarlyIntroduction
Fast smooth indicators that produce early signals can sound utopic but mathematically its not a huge deal, the effect of early outputs based on smooth inputs can be seen on differentiators crosses, this is why i propose this indicator that aim to return extra fast signals based on a slightly modified max-min normalization method. The indicator introduce inherent smoothing without having an huge impact on the indicator reactivity.
The Indicator
The indicator is based on max-min normalization (like the stochastic oscillator) however instead of using the highest/lowest of the input we use the highest and lowest of the moving average of the input. This process using as input the closing price and the moving average closing price will return two lines, and because of the nature of max-min normalization we can see that the trigger line (in orange) produce earlier crosses. length control the highest/lowest period while smooth control the output lines smoothness (50 by default).
alpha control the scaling amount, with higher values of alpha creating more constrained scale, when alpha = 1 the scale is in a range of (0,1) while lower values of alpha can make the output move more freely.
alpha = 0.25
alpha = 1
Higher values of alpha create earlier signals.
Downsides Of Early Crosses
Of course such indicator make us exposed to the trend as seen below.
We can nonetheless protect ourselves against such cases scenarios by lowering alpha.
lowering alpha allow to catch movements of the trend without loosing much reactivity at the cost of an increased umber of trades.
Possible Uses
The proposed indicator allow for an high number of uses because of its scale, reactive nature...etc. A method that allow us to go with the main trend is by taking into account the crosses between the lines and the sign of the lines, for example :
The first signal (green) happen when the main line (in blue) crossover the trigger (orange) while both are > 0, the same happen with the second signal however both lines are < 0. This method can use certain levels instead of the sign (main line crossover trigger while both > 0.7...etc).
This method is great for the indicator because such cases scenarios does not happen a lot with ranging markets, we can clearly that when trending the trigger can have the tendency to be flat and higher than 0 thus allowing for the main line to produce those signals.
Conclusion
I have presented a super reactive crosses indicator based on max-min normalization with the ability to both be smooth and produce early entries/exits signals, different methods have been presented in order to allow for different setups using this indicator.
The introduction of the alpha parameter allow for more control which is what those kind of indicators needs. I hope you find an use to it :)
Support Me
Making indicators sure is hard, it takes time and it can be quite lonely to, so i would love talking with you guys while making them :) There isn't better support than the one provided by your friends so drop me a message.

TSP Volume Change Big Small// Better Display of Volume change
// green candle : Big volume change
// red Candle : Small volume change
// Default for BTC m5
// Big volume are limited up to $limup% 5%
// Pump : Volume over $limgreen% 2%
// Flat : Very Small Volume under $limdo% 0.2%
// Adjust based on volatility / TF
// BTC/USD 1h : 4,2,0.25

CMYK XIAM OPEN◊ Introduction
This is project XIAM, a work in progress.
Recently i came across the repainting problem.
Since then i haven't seen any bot-code that makes > 5% profit in two weeks with 0.25% fees/trade.
People who make good bots either bluff or don't share the code.
they let you rent it.
I aim to understand, learn it, write it myself. And share my findings with whoever shares with me.
◊ Origin
Based on RMI (RSI with momentum) and SMA, and values derived from those.
◊ Usage
Currently an investigative script.
◊ Theoretical Approaches
Philosophy α :: Cleansignal
:: Cleaning up the signal, from irregularities that cause unpredictable results.
Merging available tickers of a pair into one.
Merging available tickers of different coins into one in the correct proportion. (eg. Crypto market cap)
Removing Jitter, and smoothing signal without delay.
Philosophy β :: Rythmic
:: Syncing into the rythm's, to never miss the que, and trade on every theoretical low/high
Searching Amplitude, Period, Phase Shift, Frequency's of the carrier waves.
Marking Acrivity/inactivity of the carrier waves.
Partial Fractal repetition asses-able with above data?
Philosophy γ :: consequential
:: Seeking for Indicatory events and causal relations
Probability / reward.
Confirmation and culmination.
...
◊ Community
Wanna share your findings ? or need help resolving a problem ?
CMYK :: discord.gg
AUTOTVIEW :: discordapp.com

Spotting HammersThis script can be used to spot hammers on the charts, I try to avoid false positives by ignoring candles which have less than 0.25% price difference between open and close.

Estimate exchange/broker fee commission from trade volumeThis script is used to estimate how much an exchange/broker makes off a particular pair/symbol. If Coinbase(GDAX) has a 0.25% taker fee and a 0.15% maker fee per trade and you estimate the average commission fee at 0.19% then you simple input that, and how many periods you'd like to know the total fee for (30 periods on the 1 day chart = last 30 days, 28 periods on 4 hour chart = last 7 days, etc).
This is for broad estimates of a single pair and only works well on exchanges that show only the volume on that exchange (stock markets may be less useful for this tool).
THIS TOOL IS TO PROVIDE A BROAD ESTIMATE , NOT AN EXACT FIGURE!
// percentage fee rate is entered as a percent: 3.5=3.5%, not 350%.
// pbtc , the one for calculating the USD value of fees that are in bitcoin, uses the price at time fees were realized. IE chart is on
// 1 day interval and XBARFEE is set at 4, then PBTC gives the USD value as if the exchange sold all btc at the end of each day for
// 4 days. i.e.:
// Day 1: BTCUSD= $5000 fees=1.5, Day 2: BTCUSD = $5000 fees=3.0, Day 3 BTCUSD = $10,000 fees=1.0, Day 4 BTCUSD = $20,000 fees=1.0
// PBTC would NOT show (1.5+ 3 + 1 + 1) = 6.5 * $20k = $130,000. It would do: (1.5*5000)+(3*5000)... = $52,500.
