Stochastic binary option styleUsing Time Frames For Trend – You can also use different time frames to determine trends with stochastic. To do this you will need to use two different time frame charts, I like to use the weekly/daily or daily/hourly combination depending on the asset. Weekly/daily works well with stocks and indices while I prefer the shorter time frame for currency and commodities. This is how it works; stochastic on the longer term chart sets trend, stochastic on the shorter term chart gives the signal. If, on the weekly chart, stochastic is pointing up then you would trade bullish signals on the daily charts. Or if using the daily/hourly combo the stochastic on the daily would set trend while signals would come from the hourly chart.
Green color bar and background means k is > d, the crowd is bullish (trend is bullish, a bullish crossover is happened), red is the contrary (bears are the leaders)
Credit to Michael Hodges
In den Scripts nach "weekly" suchen

Ultimate Moving Average Package (17 MA's)Included is the:
VWAP
Current time frame 10 EMA
Current time frame 20 EMA
Current time frame 50 EMA
Current time frame 10 SMA
Current time frame 20 SMA
Current time frame 50 SMA
Daily 10 EMA
Daily 20 EMA
Daily 50 EMA
Daily 50 SMA
Daily 100 SMA
Daily 200 SMA
Weekly 100 SMA
Weekly 200 SMA
Monthly 100 SMA
Monthly 200 SMA
All Daily/Weekly/Monthly MA's can be seen on intraday charts. Current time frame MA's change depending on your time frame. Obviously you dont need all 17 on your chart but you can pick the ones you like and disable the rest.

Consensio Vision MA - Tribute to Late Dean Tyler JenksA wonderful mentor, fearless leader and incredibly humble man, father alike and world renowned bitcoin influencer also known for the invention of robust money management system named consensio moving averages, Tribute to Late Dean Tyler Jenks who made this possible.
Explanation
this indicator make use of three simple moving averages, idea is to incrementally invest little by little in the bull market when all moving average is moving up
A more in-depth guide for consensio is available here
How to use this indicator?
This indicator plots weekly moving average on daily and/or hourly time frame, the basic idea is to see how smaller time frame like daily and hourly trend reacts to larger time frame like weekly moving averages and what are the possible support and resistance area on these smaller time frame and also to arrive at better entry points while doing that.
The name Consensio Vision is chosen cuz.. it's a free reminder to never loose long-term vision (in this case weekly trend) of where you're going
Consensio Vision MA - Tribute to Late Dean Tyler Jenks
Lucid's Principles Of Investing - These are principles foretold by Late dean tyler jenks.. he goes on to saying that those 12 principles will keep you out of trouble or will identify trouble or will identify your human behavioral problems
1. CASH IS KING - in terms of my investing principles is very simple cash is king, I would rather be in cash than any other asset class, unless an asset class is trending to the upside (or bull market) the cash is king
2. Market doesn't move in straight line - all asset classes trimmed up and down, as tyler goes on to say he dont believe in buy and hold strategy, i'm giving you the tools to get you out of market so you dont have drive down bear events like 2009 crash, he further suggests you sould react (or make decision) before a 10% drop in market.
3. Timeframe - trends are short days or weeks intermediate weeks or months and long months or years so principle number three is don't just talk about something is in a trend be precise are you talking about a short-term trend an intermediate term trend or a long-term trend...
just saying something is in a trend is irresponsible, you've got to identify your time frame
4. Wait! Bear market is different - cash is king and unless asset class is trending up there are times that you want to take advantage of a trend that is down but it is not the equivalent of investing in a trend that is up it is far more dangerous far more difficult it can be done but that's not one of the main principles, (also check rule number 7 as both are related)
5. Only long-term trends are investments - word trading is not really an investment term trading means buying or selling it has nothing to do with what you're attempting to achieve in terms of either speculation gambling investing ... those are not opportunities for investing because they're short or they're intermediate.. that doesn't mean that you can't speculate and have that turn into a position trade and have it turn into a possible swing trade and then have it turn in to an investment however be prepared once you've made an investment where that investment in a short or an intermediate term time frame to move against you
6. Never invest in a FOMO (fear of missing out)- loss of money loss of cash loss of wealth is not equivalent to a loss of opportunity
it is 100 times more important than a loss of opportunity
7. understand the importance of Percentage - a 50% gain is not an inverse equivalence of a 50% loss that is the single most important rule or principle that Lucid uses in determining when to get into or out of an investment and it goes back to number six that a loss of money is not equivalent to a loss of opportunity
8. all long-term trends are fundamentally based, repeat all long-term trends are fundamentally based
9. number nine is a corollary but it's separate all short and intermediate term trends are not fundamentally based, long term trends are not affected by news are not affected by headlines are not affected by company announcements or country announcements they are affected in the short in the intermediate term and therefore your probability of success goes way up as your timeframe frame goes longer
10. Fundamental vs technical - technical tools are invaluable in identifying trends fundamental tools are not invaluable in identifying trends - that's why technical analysis is so important it gives you something that fundamental analysis will never give you in time so technical a pro active mechanism or money management tool and fundamental is a lagging indicator hoever its what drives the market in log term
11. Profitability based on time aka VISION- I see even very sophisticated investors doing is they let the technical tools give them a signal on the short-termer intermediate-term and they believe because it's the tool that they're using that it's giving them an equivalent probability of success and it is not!
it's probability of success at the short-term is less than at the intermediate term and is less than at the long-term
12. the last one long-term trends are more important than intermediate which are more important than short term, tyler developed a scale where he ranks
long-term trend 5,
intermediate term trend 3,
short-term with a 1
(note: if you add both 3 & 1 its still smaller then 5)
if you add together my intermediate term weighting of 3 and the short term weighting of 1 that you do not equal the long term weighting of 5 that means that both the short and the intermediate term can be going in a direction but that does not negate the direction of the long term trend it's a simple way of looking at it and I use the word in number 12 important not simply to mean importance in terms of the weighting system but the probability of success of each of those 3
so if you're using a short term 15 minute 30 minute one hour signals or probability of success drops dramatically and therefore you've got to factor in where your stops are relative to that probability when you're in a long term trend a five waiting you don't need to use stops when you're in an intermediate term trend you've got to use stops and when you're in a short term trend you've got to use closed stops
official website- lucidinvestmentstrategies.com

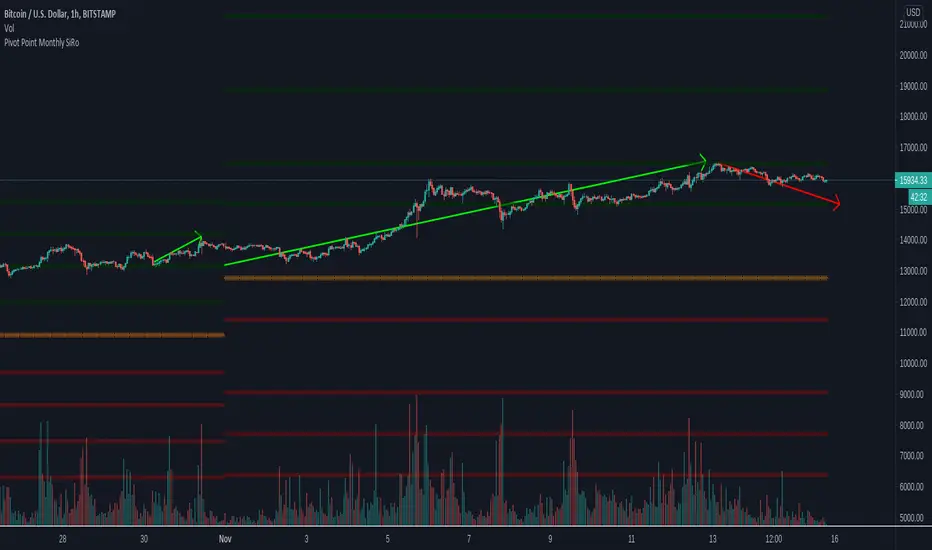
Pivot Point Monthly - bitcoin by Simon-RoseMonthly Version:
I have written 3 Indicators because i couldn't find what i was looking for in the library, so you can turn each one on and off individually for better visibility.
This are Daily, Weekly and Monthly Pivot Points with their Resistance and Support Points
and also on the Daily with the range between them.
I will also publish some Ideas to show you how to use them if you are not familiar with the traditional pivot points strategy already.
Unlike the usually 3 support & resistances i added 4 of them, specifically for trading bitcoin (on traditional markets this level of volatility usually never gets touched)
Here you can see which lines are what for reference, as the Feature to label lines is missing in Pinescript (if you have a workaround pls tell me ;) )
This is the basic calculation used :
PP = (xHigh+xLow+xClose) / 3
R1 = vPP+(vPP-Low)
R2 = vPP + (High - Low)
R3 = xHigh + 2 * (vPP - Low)
R4 = xHigh + 3 * (vPP - Low)
S1 = vPP-(High - vPP)
S2 = vPP - (High - Low)
S3 = xLow - 2 * (High - PP)
S4 = xLow - 3 * (High - PP)
If you have any questions or suggestions pls write me :)
Happy trading
Cheers
Daily Version:
Weekly Version:
Pivot Points Daily - bitcoin by Simon-RoseDaily Version:
I have written 3 Indicators because i couldn't find what i was looking for in the library, so you can turn each one on and off individually for better visibility.
This are Daily, Weekly and Monthly Pivot Points with their Resistance and Support Points
and also on the Daily with the range between them.
I will also publish some Ideas to show you how to use them if you are not familiar with the traditional pivot points strategy already.
Unlike the usually 3 support & resistances i added 4 of them, specifically for trading bitcoin (on traditional markets this level of volatility usually never gets touched)
Here you can see which lines are what for reference, as the Feature to label lines is missing in Pinescript (if you have a workaround pls tell me ;) )
This is the basic calculation used :
PP = (xHigh+xLow+xClose) / 3
R1 = vPP+(vPP-Low)
R2 = vPP + (High - Low)
R3 = xHigh + 2 * (vPP - Low)
R4 = xHigh + 3 * (vPP - Low)
S1 = vPP-(High - vPP)
S2 = vPP - (High - Low)
S3 = xLow - 2 * (High - PP)
S4 = xLow - 3 * (High - PP)
If you have any questions or suggestions pls write me :)
Happy trading
Cheers
Weekly Version:
Monthly Version:

Overlay Higher Timeframe EMA 10Plot the daily and weekly EMA 10 on any timeframe.
The Daily EMA 10 is useful for helping a trader decide whether the price is overextended without switching back to the daily timeframe and losing focus. It will change colour to indicate which order the EMA 10 and EMA 20 is in.
The Weekly EMA 10 is useful for helping a trader decide whether to take a trade based on long term momentum. If it is over the current price then the market has more momentum to the downside and if it is under then the market has more momentum to the upside. It will also change colour depending on which order the EMA 10 and EMA 20 is in. The weekly is often forgotten in trade planning.
You can switch the Daily and the Weekly on and off independently and change styles if you wish.

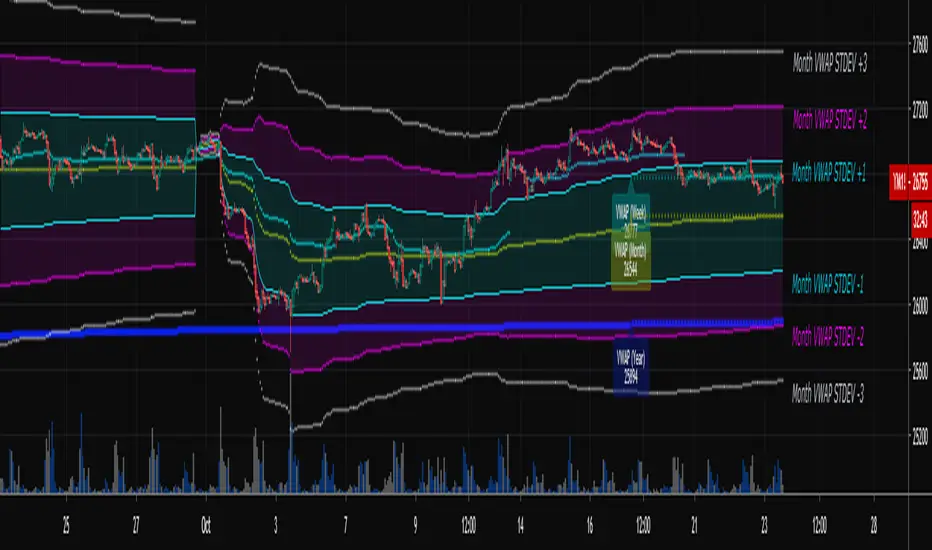
Multi-Timeframe VWAPShows the Daily, Weekly, Monthly, Quarterly, and Yearly VWAP.
Also shows the previous closing VWAP, which is usually very near the HLC3 standard pivot for the previous time frame. i.e. The previous daily VWAP closing price is usually near the current Daily Pivot. Tickers interact well with the previous Daily and Weekly closing VWAP.
Enabling the STDEV bands shows 3 separate standard deviation levels, defaulted at 1, 2, and 3. The lookback period for the bands is always changing with each new bar, since the standard deviation is calculated from the current bar to the beginning of the period. This is different from bollinger bands, as the lookback is constant (usually 20 periods is the textbook default).
The STDEV bands interval of interest can be changed from Day (D), Week (W), Month (M), Quarter (Q), Year (Y).
Tickers tend to bounce very well on Daily, Weekly, and Yearly VWAP (Yes... Year). Use this code and observe the Year VWAP on several major symbols through the past few years and eyes will be opened.
Relative Strength of 2 securities - Jayy This is an update of the Relative Strength to index as used by Leaf_West.. 4th from the top. my original RS script is 3rd from the top.
In this use of the term " Relative Strength" (RS) what is meant is a ratio of one security to another.
The RS can be inerpreted in a fashion similar to price action on a regual security chart.
If you follow his methods be aware of the different moving averages for the different time periods.
From Leaf_West: "on my weekly and monthly R/S charts, I include a 13 EMA of the R/S (brown dash line) and
an 8 SMA of the 13 EMA (pink solid line). The indicator on the bottom of the weekly/monthly charts is an
8 period momentum indicator of the R/S line. The red horizontal line is drawn at the zero line.
For daily or 130-minute time periods (or shorter), my R/S charts are slightly different
- the moving averages of the R/S line include a 20EMA (brown dash line), a 50 EMA (blue dash line) and
an 8 SMA of the20 EMA (pink solid line). The momentum indicator is also slightly different from the weekly/monthly
charts – here I use a 12 period calculation (vs 8 SMA period for the weekly/monthly charts)."
Leaf's website has gone but I if you are interested in his methods message me.
What is different from my previous RS: The RS now displays RS candles. So if you prefer to watch price action of candles to
a line chart which only plots the ratio of closes then this will be more interesting to you.
I have also thrown in a few options to have fun with.
Jayy

SuperTrend Oscillator v3Version 3: Improved aesthetically, complete turnaround for the strategy with which to use this indicator.
Once again, thanks to BlindFreddy and ChrisMoody for the bits of code that were assembled into this indicator.
Make the chart yours using the share button for the indicator with barcolors functionality.
Changes from v2 and looking forward: Indicator now uses a 14 length SuperTrend with no ATR multiplier. This my preferred use and I'd be grateful to hear your case for a different length/multiplier. Removed the Bollinger Bands and retracement dots due to these being gimmicky and marginally useful. There may be a version 4 should a similar concept using a rate of change analysis turn out to be useful. I have also tried -in vain- to plot internal trend peaks as horizontal S/R levels. Please pm if you are willing to help in that respect.
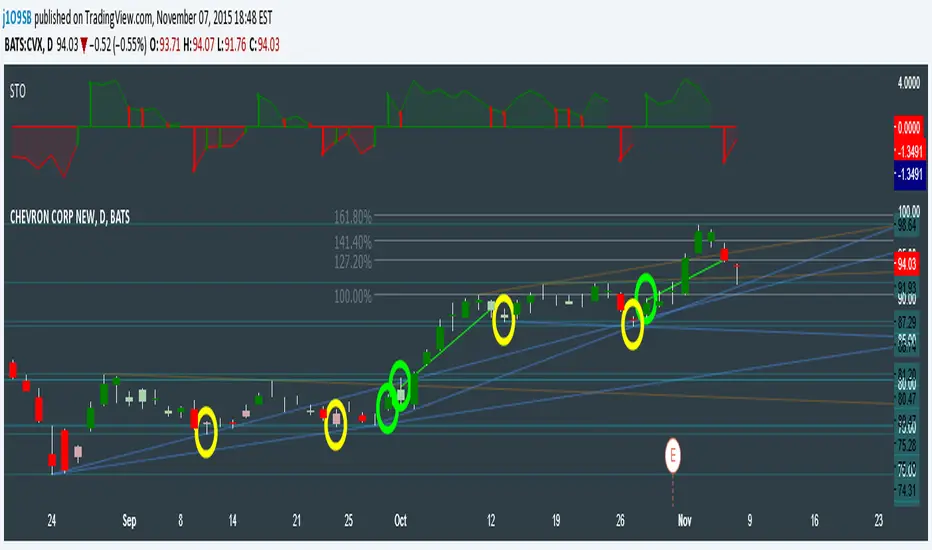
Strategy: The indicator will display the trend as a red/green area. It measures the spread between the closing price and the SuperTrend line, much like a CCI (close and ma). When the area contracts warning bars of the opposite trend color will warn of a reversal. When this happens, these areas will either be defended, reviving the trend, or will break, causing a trend flip. SuperTrend is unique in that breaks are typically large candles, and that its levels, especially on Weekly, Daily, Hourly, Minute timeframes, these levels will be defended (think similar to a 200sma or a 21ema). The STO making new highs within (internal) a trend is an overextension sign.
CVX Example: This is not a full analysis of CVX's stock , just an example potential trades. On the posted chart I used a weekly and a daily STO.
Long 1:The weekly showed warnings and then flipped. The daily made a double bottom, showed warnings and then flipped the daily STO at trendline support.
Long 2:The weekly still shows an uptrend, the daily made a weak break to downtrend and reversed back upwards at trendline support, forming a double bottom. Note the conservative exit when the STO made an internal new high.
Long 3: looking forward on CVX stock , the current downtrend made a weak break and is showing sings of reversal (pin bar) at horizontal support. Go long on flip of the daily (conservative) or flip of the hourly (aggressive).
SuperTrend OscillatorVersion 3: Improved aesthetically, complete turnaround for the strategy with which to use this indicator.
Once again, thanks to BlindFreddy and ChrisMoody for the bits of code that were assembled into this indicator.
Make the chart yours using the share button for the indicator with barcolors functionality.
Changes from v2 and looking forward: Indicator now uses a 14 length SuperTrend with no ATR multiplier. This my preferred use and I'd be grateful to hear your case for a different length/multiplier. Removed the Bollinger Bands and retracement dots due to these being gimmicky and marginally useful. There may be a version 4 should a similar concept using a rate of change analysis turn out to be useful. I have also tried -in vain- to plot internal trend peaks as horizontal S/R levels. Please pm if you are willing to help in that respect.
Strategy: The indicator will display the trend as a red/green area. It measures the spread between the closing price and the SuperTrend line, much like a CCI (close and ma). When the area contracts warning bars of the opposite trend color will warn of a reversal. When this happens, these areas will either be defended, reviving the trend, or will break, causing a trend flip. SuperTrend is unique in that breaks are typically large candles, and that its levels, especially on Weekly, Daily, Hourly, Minute timeframes, these levels will be defended (think similar to a 200sma or a 21ema). The STO making new highs within (internal) a trend is an overextension sign.
CVX Example: This is not a full analysis of CVX's stock, just an example potential trades. On the posted chart I used a weekly and a daily STO.
Long 1:The weekly showed warnings and then flipped. The daily made a double bottom, showed warnings and then flipped the daily STO at trendline support.
Long 2:The weekly still shows an uptrend, the daily made a weak break to downtrend and reversed back upwards at trendline support, forming a double bottom. Note the conservative exit when the STO made an internal new high.
Long 3: looking forward on CVX stock, the current downtrend made a weak break and is showing sings of reversal (pin bar) at horizontal support. Go long on flip of the daily (conservative) or flip of the hourly (aggressive).

Momentum of Relative strength to Index Leaf_West styleMomentum of Relative Strength to index as used by Leaf_West. This is to be used with the companion Relative Strength to Index indicator Leaf_West Style. Make sure you use the same index for comparison. If you follow his methods be aware of the different moving averages for the different time periods. From Leaf_West: "on my weekly and monthly R/S charts, I include a 13 EMA of the R/S (brown dash line) and an 8 SMA of the 13 EMA (pink solid line). The indicator on the bottom of the weekly/monthly charts is an 8 period momentum indicator of the R/S line. The red horizontal line is drawn at the zero line.
For daily or 130-minute time periods (or shorter), my R/S charts are slightly different - the moving averages of the R/S line include a 20EMA (brown dash line), a 50 EMA (blue dash line) and an 8 SMA of the20 EMA (pink solid line). The momentum indicator is also slightly different from the weekly/monthly charts – here I use a 12 period calculation (vs 8 SMA period for the weekly/monthly charts)." Leaf's methods do evolve and so watch for any changes to the preferred MAs etc..

Relative strength to Index set up as per Leaf_WestRelative Strength to index as used by Leaf_West. If you follow his methods be aware of the different moving averages for the different time periods. From Leaf_West: "on my weekly and monthly R/S charts, I include a 13 EMA of the R/S (brown dash line) and an 8 SMA of the 13 EMA (pink solid line). The indicator on the bottom of the weekly/monthly charts is an 8 period momentum indicator of the R/S line. The red horizontal line is drawn at the zero line.
For daily or 130-minute time periods (or shorter), my R/S charts are slightly different - the moving averages of the R/S line include a 20EMA (brown dash line), a 50 EMA (blue dash line) and an 8 SMA of the20 EMA (pink solid line). The momentum indicator is also slightly different from the weekly/monthly charts – here I use a 12 period calculation (vs 8 SMA period for the weekly/monthly charts)." Leaf's methods do evolve and so watch for any changes to the preferred MAs etc..

CM_Pivot Points Daily To IntradayNew Pivots Indicator With Options for Daily, 4 Hour, 2 Hour, 1 Hour, 30 Minute Pivot Levels!
Great for Forex Traders! - Take a Look at Chart with Weekly, Daily, and 4 Hour levels. Weekly Pivots Indicator is separate - Link is Below.
Plot one Pivot Level or Multiple at the Same Time via Check Boxes in the Inputs tab.
Defaults to 4 Hour Pivot Levels - Adjust in Inputs Tab.
S3 and R3 are turned off by Default - You can Activate Them In The Inputs Tab.
These Intraday Options were Requested By Users Using My CM_ Pivots Point Custom Indicator that Plots Daily, Weekly, Monthly, Quarterly, and Yearly Pivot Levels. Link is Below.
Now Both Longer-Term Traders and Shorter Term Traders Have All The Pivot Levels They Need. From Yearly Levels All The Way Down to 30 Minute Levels!
***The Candles On The Chart Are Custom Heikin-Ashi Paint Bars. Link is Below
CM_ Pivot Points Custom
Daily, Weekly, Monthly, Quarterly, Yearly Pivot Levels
Heikin-Ashi Paint Bars

CM_Pivot Points_CustomCustom Pivots Indicator - Plots Yearly, Quarterly, Monthly, Weekly, and Daily Levels.
I created this indicator because when you have multiple Pivots on one chart (For Example The Monthly, Weekly, And Daily Pivots), the only way to know exactly what pivot level your looking at is to color ALL S1 Pivots the same color, but create the plot types to look different. For example S1 = Bright Green with Daily being small circles, weekly being bigger circles, and monthly being even bigger crosses for example. This allows you to visually know exactly what pivot levels your looking at…Instantly without thinking. This indicator allows you to Choose any clor you want for any Pivot Level, and Choose The Plot Type.

MACD Trend Count ScoreThis indicator aims to confirm trends in an asset's price. This confirmation is achieved by counting the MACD bars in a calculation using the chosen timeframe. Positive and negative bars are considered in the calculation of the strength index, which indicates the current trend of that asset.
This Delta index summarizes the predominance of positive or negative bars in the MACD histogram over weekly, bi-weekly, monthly, bi-monthly, and quarterly periods, and, depending on the timeframe used, its result allows one to indicate the intensity of the current trend, according to the results it shows within the following ranges:
Acima de +60 → Strong Raise.
Entre +20 e +60 → Moderate High.
Entre -20 e +20 → Neutral.
Entre -60 e -20 → Moderate Low.
Abaixo de -60 → Strong Low.

CRUX-3 Macro Regime Index"CRUX-3 Macro Regime Index"
Description:
CRUX-3 Macro Regime Index is a higher-timeframe macro indicator designed to evaluate how crypto markets are performing relative to traditional equities. It compares Bitcoin, Ethereum, and the broader altcoin market (TOTAL3) against the S&P 500 using Z-score normalization to highlight periods of relative outperformance or underperformance.
The indicator incorporates liquidity-based regime detection using Bitcoin dominance and stablecoin dominance to classify market environments as Risk-On, BTC-Led, or Risk-Off. Background shading visually highlights these regimes, helping users identify broader macro conditions rather than short-term trade signals.
CRUX-3 is intended for macro context, regime awareness, and allocation bias decisions, not for precise trade entries or timing.
How to Use:
Weekly timeframe recommended for best results
Rising Z-scores indicate crypto outperforming equities
ETH/SPX typically acts as an early rotation signal
TOTAL3/SPX confirms broader altcoin participation
Regime shading reflects liquidity conditions, not price forecasts
Regime Definitions:
Risk-On: BTC dominance and stablecoin dominance declining
BTC-Led: BTC dominance strong while stablecoin dominance eases
Risk-Off: BTC dominance and stablecoin dominance rising
Notes:
Forward regime bands are statistical reference guides based on historical behavior
This indicator does not predict future prices or market direction
Best used alongside price charts and other macro tools
Disclaimer:
This indicator is for educational and informational purposes only. It does not constitute financial advice, investment advice, or trading recommendations.
Recommended Settings:
Timeframe: Weekly (1W)
Z-Score Lookback: 52
Forward Regime Bands: Enabled

VWAP-Anchored MACD [BOSWaves]VWAP-Anchored MACD - Volume-Weighted Momentum Mapping With Zero-Line Filtering
Overview
The VWAP-Anchored MACD delivers a refined momentum model built on volume-weighted price rather than raw closes, giving you a more grounded view of trend strength during sessions, weeks, or months.
Instead of tracking two EMAs of price like a standard MACD, this tool reconstructs the MACD engine using anchored VWAP as the core input. The result is a momentum structure that reacts to real liquidity flow, filters out weak crossovers near the zero line, and visualizes acceleration shifts with clear, high-contrast gradients.
This indicator acts as a precise momentum map that adapts in real time. You see how weighted price is accelerating, where valid crossovers form, and when trend conviction is strong enough to justify execution.
It uses gradient line coloring to show bullish or bearish momentum, histogram shading to highlight energy shifts, cross dots to mark valid crossovers, optional buy/sell diamonds for execution cues, and candle coloring to display trend strength at a glance.
Theoretical Foundation
Traditional MACD compares the difference between two exponential moving averages of price.
This variant replaces price with anchored VWAP, making the calculation sensitive to actual traded volume across your chosen period (Session, Week, or Month).
Three principles drive the logic:
Anchored VWAP Momentum : Price is weighted by volume and aggregated across the selected anchor. The fast and slow VWAP-EMAs then expose how liquidity-corrected momentum is expanding or contracting.
Zero-Line Distance Filtering : Crossover signals that occur too close to the zero line are removed. This eliminates the common MACD problem of generating weak, directionless signals in choppy phases.
Directional Visualization : MACD line, signal line, histogram, candle colors, and optional diamond markers all react to shifts in VWAP-momentum, giving you a clean structural read on market pressure.
Anchoring VWAP to session, weekly, or monthly resets creates a systematic framework for tracking how capital flow is driving momentum throughout each trading cycle.
How It Works
The core engine processes momentum through several mapped layers:
VWAP Aggregation : Price × volume is accumulated until the anchor resets. This creates a continuous, liquidity-corrected VWAP curve.
MACD Construction : Fast and slow VWAP-EMAs define the MACD line, while a smoothed signal line identifies edges where momentum shifts.
Zero-Line Distance Filter : MACD and signal must both exceed a threshold distance from zero for a crossover to count as valid. This prevents fake crossovers during compression.
Visual Momentum Layers : It uses gradient line coloring to show bullish or bearish momentum, histogram shading to highlight energy shifts, cross dots to mark valid crossovers, optional buy/sell diamonds for execution cues, and candle coloring to display trend strength at a glance.
This layered structure ensures you always know whether momentum is strengthening, fading, or transitioning.
Interpretation
You get a clean, structural understanding of VWAP-based momentum:
Bullish Phases : MACD > Signal, histogram expands, candles turn bullish, and crossovers occur above the threshold.
Bearish Phases : MACD < Signal, histogram drives lower, candles shift bearish, and downward crossovers trigger below the threshold.
Neutral/Compression : Both lines remain near the zero boundary, histogram flattens, and signals are suppressed to avoid noise.
This creates a more disciplined version of MACD momentum reading - less noise, more conviction, and better alignment with liquidity.
Strategy Integration
Trend Continuation : Use VWAP-MACD crossovers that occur far from the zero line as higher-conviction entries.
Zero-Line Rejection : Watch for histogram contractions near zero to anticipate flattening momentum and potential reversal setups.
Session/Week/Month Anchors : Session anchor works best for intraday flows. Weekly or monthly anchor structures create cleaner macro momentum reads for swing trading.
Signal-Only Execution : Optional buy/sell diamonds give you direct points to trigger trades without overanalyzing the chart.
This indicator slots cleanly into any momentum-following system and offers higher signal quality than classic MACD variants due to the volume-weighted core.
Technical Implementation Details
VWAP Reset Logic : Session (D), Week (W), or Month (M)
Dynamic Fast/Slow VWAP EMAs : Fully configurable lengths, smoothing and anchor settings
MACD/Signal Line Framework : Traditional structure with volume-anchored input
Zero-Line Filtering : Adjustable threshold for structural confirmation
Dual Visualization Layers : MACD body + histogram + crosses + candle coloring
Optimized Performance : Lightweight, fast rendering across all timeframes
Optimal Application Parameters
Timeframes:
1- 15 min : Short-term momentum scalping and rapid trend shifts
30- 240 min : Balanced momentum mapping with clear structural filtering
Daily : Macro VWAP regime identification
Suggested Configuration:
Fast Length : 12
Slow Length : 26
Signal Length : 9
Zero Threshold : 200 - 500 depending on asset range
These suggested parameters should be used as a baseline; their effectiveness depends on the asset volatility, liquidity, and preferred entry frequency, so fine-tuning is expected for optimal performance.
Performance Characteristics
High Effectiveness:
Assets with strong intraday or session-based volume cycles
Markets where volume-weighted momentum leads price swings
Trend environments with strong acceleration
Reduced Effectiveness:
Ultra-choppy markets hugging the VWAP axis
Sessions with abnormally low volume
Ranges where MACD naturally compresses
Disclaimer
The VWAP-Anchored MACD is a structural momentum tool designed to enhance directional clarity - not a guaranteed predictor. Performance depends on market regime, volatility, and disciplined execution. Use it alongside broader trend, volume, and structural analysis for optimal results.

BB & MTF EMAs + DPOC/WPOC v0.1This indicator combines multiple trend and support/resistance tools into a single overlay with specific customization for the Indian Standard Time (IST) session.
Features Included:
Bollinger Bands: 20-period SMA Basis, 1.5 StdDev.
4 Multi-Timeframe EMAs:
EMA 1: 9 Length (1m timeframe)
EMA 2: 20 Length (3m timeframe)
EMA 3: 50 Length (15m timeframe)
EMA 4: 200 Length (15m timeframe)
Session POCs (IST):
Daily POC (DPOC): Calculated 05:30-05:29 IST. Extends for full 24h session.
Weekly POC: Calculated from Monday 05:30 IST Open. Extends for full 7-day week.
Controls:
Toggle visibility for all individual components.
"Show Historical" toggle for pivots to see past levels or keep charts clean.
2 days ago
Release Notes
Description:
This indicator combines multiple trend and support/resistance tools into a single overlay with specific customization for the Indian Standard Time (IST) session.
Features Included:
Bollinger Bands: 20-period SMA Basis, 1.5 StdDev.
4 Multi-Timeframe EMAs:
EMA 1: 9 Length (1m timeframe)
EMA 2: 20 Length (3m timeframe)
EMA 3: 50 Length (15m timeframe)
EMA 4: 200 Length (15m timeframe)
Session POCs (IST):
Daily POC (DPOC): Calculated 05:30-05:29 IST. Extends for full 24h session.
Weekly POC: Calculated from Monday 05:30 IST Open. Extends for full 7-day week.
Controls:
Toggle visibility for all individual components.
"Show Historical" toggle for pivots to see past levels or keep charts clean.

OFM Key LevelsDaily and Weekly Levels Only
Daily Levels Calculated from RTH Sessions
Weekly Levels Calculated ETH

Key Levels v1Key Levels
This comprehensive multi-timeframe indicator provides traders with key price levels and opening ranges across multiple timeframes, designed to identify significant support/resistance zones and market structure.
KEY FEATURES:
📦 Monthly Range Box
- Automatically draws a box capturing the high and low of the first 9 hours of each new month
- Box extends until the next month begins
- Includes an optional mid-line showing the 50% level of the range
- Fully customizable colors, line styles, and background opacity
📊 Multi-Timeframe Open Lines
The indicator plots horizontal lines at the open price of:
- Midnight Open (00:00 session start)
- 4-Hour Open (updates every 4-hour candle)
- Daily Open (true daily candle open)
- Weekly Open (start of trading week)
- Monthly Open (start of new month)
- Yearly Open (start of new year)
🎯 Smart Label System
- Automatic label combining when multiple timeframe opens overlap at the same price
- Clean text labels positioned ahead of current price to avoid obstruction
- Labels show combined timeframes (e.g., "Monthly Open / Weekly Open")
⚙️ Customization Options
Each timeframe open line includes:
- Toggle on/off independently
- Custom color selection
- Line style options (Solid, Dashed, Dotted)
- Organized settings grouped by timeframe for easy navigation
🔧 Technical Implementation
- Uses request.security() for accurate higher timeframe data
- Works on any chart timeframe
- Lines extend 10 bars beyond current price for clear label visibility
- Efficient overlap detection prevents duplicate labels
IDEAL FOR:
✓ Identifying key institutional levels
✓ Trading range breakouts
✓ Multi-timeframe analysis
✓ Support and resistance zones
✓ Session-based trading strategies
All settings are organized chronologically from shortest to longest timeframe for intuitive configuration.

All Macro LevelsA comprehensive overlay indicator that displays key macro-level support and resistance zones using widely-followed moving averages across multiple timeframes.
Features
Bull Market Support Band (BMSB)
- Weekly 20 SMA and 21 EMA with customizable fill
- A popular indicator for identifying bull market trends - price holding above the band typically signals strength
Daily 12/21/25 EMA Bands
- Three daily EMAs (12, 21, 25) with fill between the outer bands
- Useful for tracking short-term momentum and trend direction
Long-Term Weekly Moving Averages
- 100-Week MA - Intermediate cycle support
- 200-Week MA - Major cycle support level
- 300-Week MA - Deep value zone
- Each MA can be configured as SMA or EMA
Customization
- Toggle each indicator group on/off independently
- Full color customization for lines, fills, and labels
- Adjustable line widths
- Optional custom symbol input to display levels from a different asset
- Real-time labels showing current values at chart edge
Use Cases
- Identify macro support/resistance levels
- Spot potential buy zones during corrections
- Confirm bull/bear market conditions
- Multi-timeframe analysis on a single chart

Market Trend & Breadth Checklist [Kulturdesken]Description
Concept & Inspiration This indicator serves as a disciplined "Pre-Flight Checklist" for swing traders, combining two powerful methodologies into one objective dashboard.
The Foundation (@kulturdesken): The core checklist structure is inspired by the workflow of @kulturdesken, utilizing the QQQE (Nasdaq 100 Equal Weighted Index). By focusing on the equal-weighted index rather than the market-cap weighted QQQ, we avoid distortions caused by mega-cap stocks and gauge the true price trend of the average stock.
The Enhancement (StockBee): To further filter out "hollow rallies," we integrated Pradeep Bonde’s (StockBee) "Market Monitor" logic. This adds a layer of analysis based on the Total US Universe (Wilshire 5000) to ensure market breadth is expanding, not just price.
Why StockBee Logic Was Added While QQQE tells us if the average price is trending, the StockBee logic tells us if the market structure is healthy. We added the "Universe" checks (Total US Market Breadth) because price trends can sometimes be deceptive during low-volume corrections.
By incorporating the Market Monitor concept (specifically checking if the % of stocks above their 50-day Moving Average is rising), this tool acts as a "Traffic Light." It prevents the trader from entering aggressive long positions even if QQQE is green, provided the underlying participation (Market Breadth) is weak.
How It Works (The 7 Checks)
1. Price Momentum (Kulturdesken): QQQE > Rising 5 SMA
Verifies short-term momentum is aggressive (Price > 5SMA) and the 5SMA itself is curling up.
2. Daily Trend Structure: Daily Buy Signal
Verifies a "stacked" bullish alignment where Price > 10 SMA > 20 SMA.
3. Macro Trend: Weekly Buy Signal
Verifies the Weekly Price > 10 WMA > 20 WMA (Weighted Moving Averages).
4. Universe Breadth (StockBee/McClellan): Summation Uptrend
We aggregate Nasdaq + NYSE data to create a "Total Universe" McClellan Summation Index.
Check: Is the Summation Index rising? (Indicates long-term money flow entering the system).
5. Short-Term Thrust: Oscillator Positive
Uses the "Total Universe" McClellan Oscillator.
Check: Is the Oscillator > 0? (Indicates immediate buying pressure is dominant).
6. Leadership: Net Highs/Lows
Check: Are Net New Highs (Highs minus Lows) trending positive?
7. Performance Filter (Manual): Traction Check
A psychological guardrail. If you toggle this off in settings (indicating you are losing money/getting stopped out), the checklist forces a "WAIT" signal, protecting you from overtrading during choppy conditions.
Settings & Customization
Data Feeds: The script is pre-configured with USI (United States Indices) and INDEX tickers to ensure accurate breadth data, but these can be customized in the settings.
Main Ticker: Defaults to QQQE.
Disclaimer: This tool is for educational purposes and market analysis only. It does not constitute financial advice. Past performance is not indicative of future results.

Moving Average Ribbon by AbrarIndicator Description — Moving Average Ribbon (Multi-TF Enhanced)
The Moving Average Ribbon (Enhanced) is a powerful trend-analysis tool that displays up to 7 customizable moving averages along with a Weekly SMA 150 for higher-timeframe confluence. Each MA can be individually configured with length, source, type (SMA/EMA/WMA/SMMA/VWMA), and color.
The script also features automatic labels on the latest bar, allowing traders to instantly identify each moving average on the chart without confusion.
This indicator is designed to help traders:
Visualize trend strength and direction
Spot dynamic support/resistance zones
Identify momentum shifts
Incorporate higher-timeframe confirmation through the Weekly SMA 150
Whether you trade intraday or swing, this ribbon provides a clean and flexible layout to understand market structure at a glance.
