In den Scripts nach "volume" suchen


Volume Flow Indicator [LazyBear]LFThis is Lazybear's port of VFI by Katsanos, which ideally requires 2 different sets of coefficients for intraday vs longer term charts. I added definitions of the values to allow for one set to be used intraday while the other is used for resolutions of 1d or more. This version will dynamically adapt the coefficients using the chart's resolution. I've also added options to show crosses with the MA and the zero line, and the possibility to have the zero line change color when using the long term set of coefficients, as a reminder.
LazyBear's original version is here .
This is the Katsanos documentation on VFI: www.mkatsanos.com .

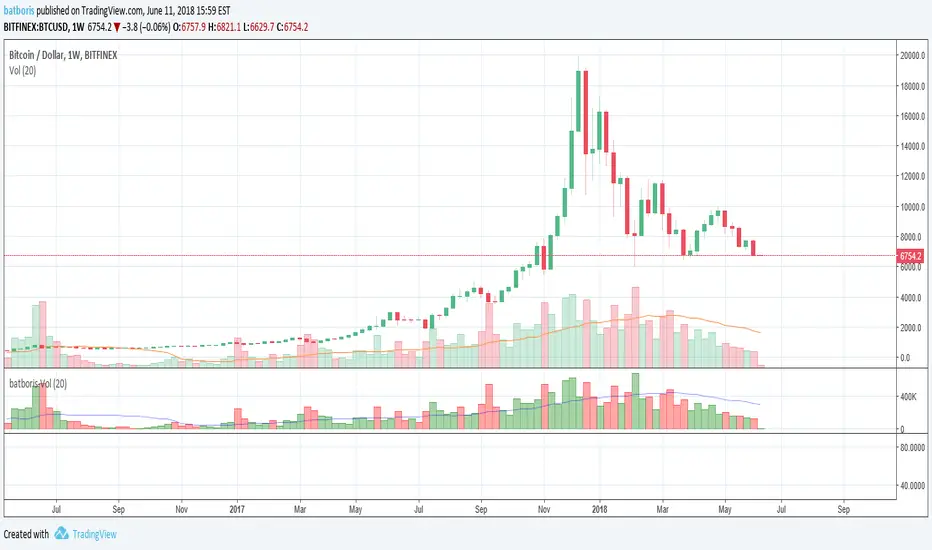
batboris-VolumeVolume colored by all candle components (open, close, low and high) instead of open and close only
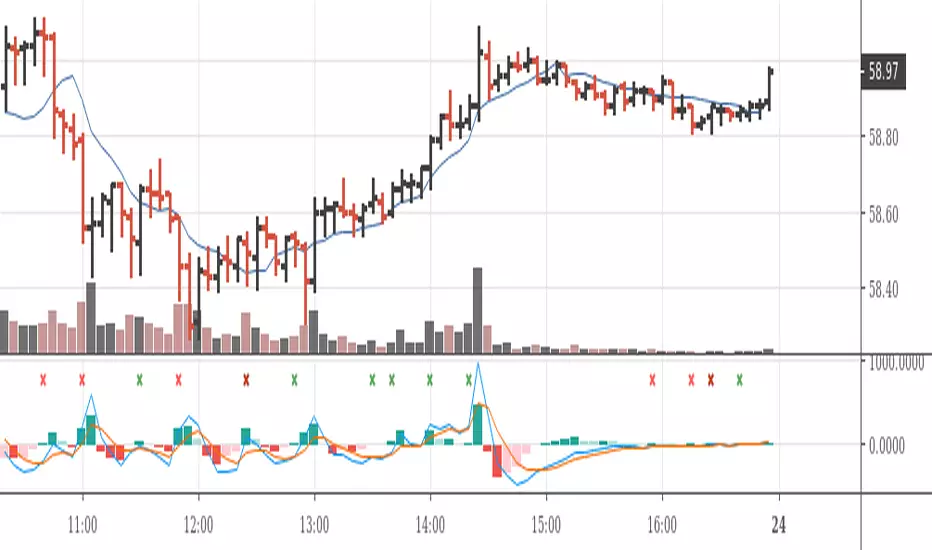
Volume+Price Action AlertThis script identifies sudden changes in both volume and price.
You can set the sensitivities for both volume change and price change with respect to the moving averages.
There are four inputs in this script: the first two parameters indicate the length for moving averages of volume and price and the last two parameters indicate how much the volume change (e.g. 2 times) or the price change (e.g. 0.01; that is 1 percent of close price) should be.

VolumeThis is an OBV (On Balance Volume) with two different moving averages on it plus a bollinger band set to OBV to find the squeeze and expansion points on OBV. As you many know, OBV is one of those indicators that can show you the volume and not only that but also the direction that volume is going.

Volume Weighted Price over SMA indicatorPlots Volume Wighted Price against SMA and triggeres Strategy based on Crossover

Volume in moneyThe indicator estimates the money volume of a certain bar.
The indicator gives control if to present the volume by units / by money
The indicator gives control if to color differently bars that the price increased / decreased and if the volume support the price movement


Volume Candles By Anil ChawraHow Users Can Make Profit Using This Script:
1. Volume Representation : Each candle on the chart represents a specific time period (e.g., 1 minute, 1 hour, 1 day) and includes information about both price movement and trading volume during that period.
2. Candlestick Anatomy : A volume candle has the same components as a regular candlestick: the body (which represents the opening and closing prices) and the wicks or shadows (which indicate the highest and lowest prices reached during the period).
3. Volume Bars : Instead of just the candlestick itself, volume candles also include a bar or histogram representing the trading volume during that period. The height or length of the volume bar indicates the amount of trading activity.
4. Interpreting Volume : High volume candles typically indicate increased market interest or activity during that period. This could be due to significant buying or selling pressure.
5. Confirmation : Traders often look for confirmation from other technical indicators or price action to validate the significance of a high volume candle. For example, a high volume candle breaking through a key support or resistance level may signal a strong market move.
6. Trend Strength : Volume candles can provide insights into the strength of a trend. A series of high volume candles in the direction of the trend suggests strong momentum, while decreasing volume may indicate weakening momentum or a potential reversal.
7. Volume Patterns : Traders also analyze volume patterns, such as volume spikes or divergences, to identify potential trading opportunities or reversals.
8. Combination with Price Action: Volume analysis is often used in conjunction with price action analysis and other technical indicators to make more informed trading decisions.
9. Confirmation and Validation: It's important to confirm the significance of volume candles with other indicators or price action signals to avoid false signals.
10. Risk Management : As with any trading strategy, proper risk management is crucial when using volume candles to make trading decisions. Set stop-loss orders and adhere to risk management principles to protect your capital.
How the Script Works:
1. Volume Representation : Each candle on the chart represents a specific time period (e.g., 1 minute, 1 hour, 1 day) and includes information about both price movement and trading volume during that period.
2. Candlestick Anatomy : A volume candle has the same components as a regular candlestick: the body (which represents the opening and closing prices) and the wicks or shadows (which indicate the highest and lowest prices reached during the period).
3. Volume Bars : Instead of just the candlestick itself, volume candles also include a bar or histogram representing the trading volume during that period. The height or length of the volume bar indicates the amount of trading activity.
4. Interpreting Volume : High volume candles typically indicate increased market interest or activity during that period. This could be due to significant buying or selling pressure.
5. Confirmation : Traders often look for confirmation from other technical indicators or price action to validate the significance of a high volume candle. For example, a high volume candle breaking through a key support or resistance level may signal a strong market move.
6. Trend Strength : Volume candles can provide insights into the strength of a trend. A series of high volume candles in the direction of the trend suggests strong momentum, while decreasing volume may indicate weakening momentum or a potential reversal.
7. Volume Patterns : Traders also analyze volume patterns, such as volume spikes or divergences, to identify potential trading opportunities or reversals.
8. Combination with Price Action : Volume analysis is often used in conjunction with price action analysis and other technical indicators to make more informed trading decisions.
9. Confirmation and Validation : It's important to confirm the significance of volume candles with other indicators or price action signals to avoid false signals.
10. Risk Management : As with any trading strategy, proper risk management is crucial when using volume candles to make trading decisions. Set stop-loss orders and adhere to risk management principles to protect your capital.
Understanding volume candles can provide valuable insights into market dynamics and help traders make more informed decisions. However, like any technical tool, it's essential to use volume analysis in conjunction with other forms of analysis for comprehensive market assessment.
Understanding volume candles can provide valuable insights into market dynamics and help traders make more informed decisions. However, like any technical tool, it's essential to use volume analysis in conjunction with other forms of analysis for comprehensive market assessment.

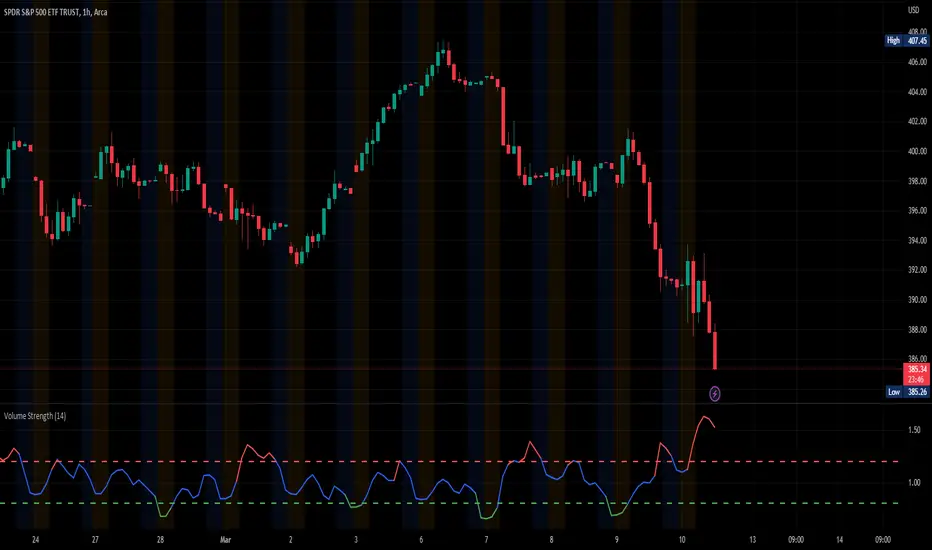
Volume StrengthThe "Volume Strength" indicator
A technical analysis tool that helps traders evaluate the strength of the current market trend by measuring the cumulative volume over a specified period of time. It calculates the cumulative volume of a stock and divides it by the average cumulative volume over a specified period. This ratio is referred to as the "volume strength" and is plotted as a line on a chart. The indicator also provides overbought and oversold levels, which are horizontal lines on the chart that represent predetermined levels of overbought and oversold conditions.
The color of the volume strength line changes based on the current strength level. If the line is above the overbought level, it is colored red. If the line is below the oversold level, it is colored green. If the line is between the overbought and oversold levels, it is colored blue. The indicator also provides alerts for overbought and oversold conditions.
HOW TO USE:
1. Load the indicator onto the chart of the desired market. It works best in markets where volume data is available, such as stocks, futures, indices and cryptocurrencies. But you can also use it in the Forex market, where tick volume data will be used to calculate the indicator.
2. Adjust the length parameter to set the period for which the cumulative volume is calculated and the average cumulative volume is calculated.
3. Adjust the overbought and oversold levels as desired. These levels determine the horizontal lines that represent overbought and oversold conditions on the chart.
4. Observe the volume strength line and the overbought/oversold levels on the chart. If the volume strength line is red, the volume is considered overbought. If the line is green, the volume is considered oversold. If the line is blue, the volume is considered to be between the overbought and oversold levels. The indicator will provide alerts for overbought and oversold conditions. The indicator is an excellent tool for finding price-volume divergences.
SETTINGS:
Length: The period over which the cumulative volume is calculated and the average cumulative volume is calculated. The default is 14.
Overbought Level: The level at which the volume is considered overbought. The default is 1.2.
Oversold Level: The level at which the volume is considered oversold. The default is 0.8.
Please leave a comment & like :)
Volume GainThis indicator shows the amount, in terms of a percentage, that the volume is currently above or below the current volume average.
((Volume - volumeMA) / volume) * 100
Ways to use:
1) We could consider movements in price to be extremely strong when the volumeGain is above the upper limit line
i.e. the current volume is more than 50% higher than the current average volume
2) We could consider movements in price to be extremely weak when the volumeGain is below the lower limit line
i.e. the current volume is less than 50% lower than the current average volume

MACD on Volume (Signal)Volume-Price-based 5-min-Chart Trading
Pull up a 5-min chart of your favourite commodity future and stay inside regular trading hours, but show all of globex trading, too.
You will want to base your trading off the 5-min chart on volume and price.
Volume Logic:
The (positive) histogram of your MACD on Pro Rata Volume* indicates market phases with valuable participation. Participate in those phases. Put a horizontal ray on your volume indicator to indicate slow and less than slow volume phases. Stay away from those market phases.
*) Pro Rata Volume = Actual Volume * 300 / elapsed seconds
(Do the platform test. Can you add this indicator to your platform?)

Volume & Highlights
Large or small volume bars are highlighted.
Normal bars are using the same colors as the built-in volume indicator.

Volume in a panelIf you prefer to see volume in a panel rather than an overlay here it is. Just basic volume with moving average line.


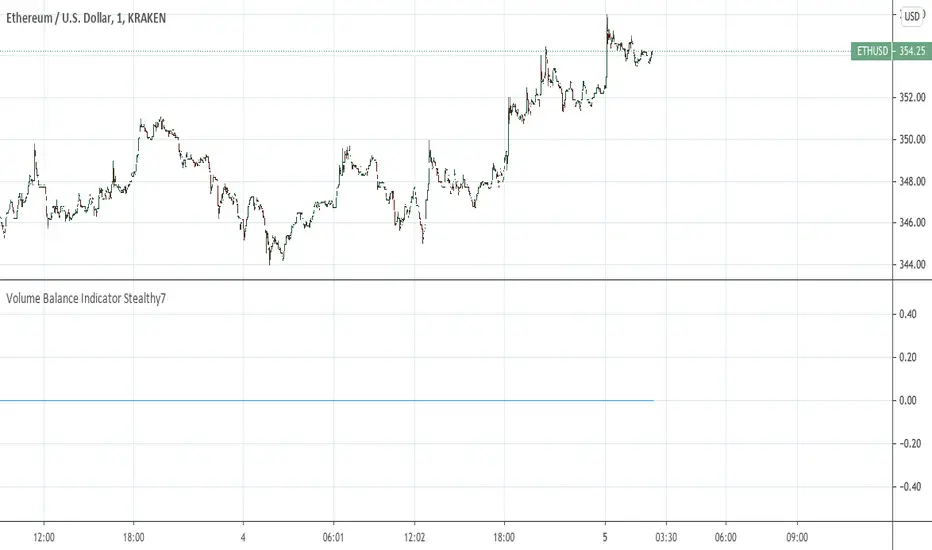
Volume Balance Indicator Stealthy7Find out if Bulls (buys) or Bears (sells) are moving the price. This gives a clear view of activity, even if you are using a higher time period. The lookback is in minutes, I believe. This is a superior volume indicator. Bars are recolored to show the underlying activity per the look back (minutes).
Volume per minimum tickThis script calculates the volume traded per minimum tick of a scrip and is an indicator that the price move is justified by volume and trader interest

Volume Spike Alert & Overlay"Volume Spike Alert & Overlay" highlights unusually high trading volume on a chart. It calculates whether the current volume exceeds a user-defined percentage above the historical average and triggers an alert if it does. The information is also displayed in a customizable on-screen table.
What It Does
Monitors volume for each bar and compares it to an average over a user-defined lookback period.
Supports multiple smoothing methods (SMA, EMA, WMA, RMA) for calculating the average volume.
Triggers an alert when current volume exceeds the threshold percentage above the average.
Displays a table on the chart with:
Current Volume
Average Volume
Threshold Percentage
Optional empty row for spacing/formatting
How It Works
User Inputs:
lookbackPeriods: Number of bars used to calculate the average volume.
thresholdPercent: % above the average that triggers a volume spike alert.
smoothingType: Type of moving average used for volume calculation.
textColor, bgColor: Formatting for the display table.
tablePositionInput: Where the table appears on the chart (e.g., Bottom Right).
Toggles for showing/hiding parts of the table.
Volume Calculations:
Calculates current bar's volume.
Calculates average volume using the selected smoothing method.
Computes the threshold: avgVol * (1 + thresholdPercent / 100).
Compares current volume to threshold.
Table Display:
Dynamically creates a table with volume stats.
Adds rows based on user preferences.
Alerts:
alertcondition fires when currentVol crosses above the calculated threshold.
Message: "Volume Threshold Exceeded"
Usage Examples
Example 1: Spotting High Activity
Apply the script to a stock like AAPL on a 5-minute chart.
Set lookbackPeriods to 20 and thresholdPercent to 30.
Use EMA for more reactive volume tracking.
When volume spikes more than 30% above the 20-period EMA, an alert triggers.
Example 2: Day Trading Filter
For scalpers, apply it to a 1-minute crypto chart (e.g., BTC/USDT).
Set thresholdPercent to 50 to catch only strong surges.
Position the table at the top left and reduce visible info for a clean layout.
Example 3: Long-Term Context
On a daily chart, use SMA and set lookbackPeriods to 50.
Helps identify breakout moves supported by strong volume.
How this is different from Trading View's Volume indicator:
The standard volume plot from trading view allows users to set a alert when the average line is crossed, but it does not allow you to set a custom percentage at which to trigger an alert. This indicator will allow you to set any percentage you wish to monitor and above that percentage threshold will trigger your alert.
===== ORIGINAL DESCRIPTION =====
Volume Spike Alert & Overlay
This indicator will display the following as an overlay on your chart:
Current volume
Average Volume
Threshold for Alert
Description:
This indicator will display the current bar volume based on the chart time frame,
display the average volume based on selected conditions,
allow user selectable threshold over the average volume to trigger an alert.
Options:
Average lookback period
Smoothing type
Alert Threshold %
Enable / Disable Each Value
Change Text Color
Change Background Color
Change Table location
Add/Remove extra row for placement in top corner
Usage Example:
I use this indicator to alert when the current volume exceeds the average volume by a specified percentage to alert to volume spikes.
Set the threshold to 25% in the settings
Create an alert by clicking on the 3 dots on the right of the indicator title on the chart
When the threshold is exceeded the alert will trigger

Volume essential parameters overlayVolume EPO – Essential Volume Parameters Overlay
1. Motivation and design philosophy
Volume EPO is designed as a conceptual overlay rather than a self contained trading system. The main idea behind this script is to take complex, foundational market concepts out of heavy, menu driven strategies and express them as lightweight, independent layers that sit on top of any chart or indicator.
In many TradingView scripts, a single strategy tries to handle everything at once: signal logic, risk settings, visual cues, multi timeframe controls, and conceptual explanations. This usually leads to long input menus, performance issues, and difficult maintenance. The architectural approach behind Volume EPO is the opposite: keep the core strategy lean, and move the explanation and measurement of key concepts into dedicated overlays.
In this framework, Volume EPO is the base layer for the concept of volume. It does not decide anything about entries or exits. Instead, it exposes and clarifies how different definitions of volume behave candle by candle. Other layers or strategies can then build on top of this understanding.
2. What Volume EPO does
Volume EPO focuses on four essential volume parameters for each bar:
- Buy volume - Sell volume - Total volume - Delta volume (the difference between buy and sell volume)
The script presents these parameters in a compact heads up display (HUD) table that can be positioned anywhere on the chart. It is designed to be visually minimal, language aware, and usable on top of any other indicator or price action without cluttering the view.
The indicator does not output signals, alerts, arrows, or strategy entries. It is a descriptive and educational tool that shows how volume is distributed, not a prescriptive tool that tells the trader what to do.
3. Two definitions of volume
A central theme of this script is that there is more than one way to define and interpret “volume” inside a single candle. Volume EPO implements and clearly separates two different approaches:
- A geometric, candle based approximation that uses only OHLC and volume of the current bar. - An intrabar, data driven definition that uses lower timeframe up and down volume when it is available.
The user can switch between these modes via the calculation method input. The mode is prominently shown inside the on chart table so that the context is always explicit.
3.1 Geometry mode (Source File, approximate)
In Geometry mode, Volume EPO works only with the current bar’s OHLC values and total volume. No lower timeframe data is required.
The candle’s range is defined as high minus low. If the range is positive, the position of the close inside that range is used as a simple model for how volume might have been distributed between buyers and sellers:
- The closer the close is to the high, the more of the total volume is attributed to the buying side. - The closer the close is to the low, the more of the total volume is attributed to the selling side. - In a rare case where the bar has no price range (for example a flat or doji bar), total volume is split evenly between buy and sell volume.
From this model, the script derives:
- Buy volume (approximated) - Sell volume (approximated) - Total volume (as reported by the bar) - Delta volume as the difference between buy and sell volume
This approach is intentionally labeled as “Geometry (Approx)” in the HUD. It is a theoretical reconstruction based solely on the candle’s geometry and total volume, and it is always available on any market or timeframe that provides OHLCV data.
3.2 Intrabar mode (Precise)
In Intrabar mode, Volume EPO uses the TradingView built in library for up and down volume on a user selected lower timeframe. Instead of inferring volume from the shape of the candle, it reads the underlying lower timeframe data when that data is accessible.
The script requests up and down volume from a lower timeframe such as 15 seconds, using the official TA library functions. The results are then interpreted as follows:
- Buy volume is taken as the absolute value of the up volume. - Sell volume is taken as the absolute value of the down volume. - Total volume is the sum of buy and sell volume. - Delta volume is provided directly by the library as the difference between up and down volume.
If valid lower timeframe data exists for a bar, the bar is counted as covered by Intrabar data. If not, that bar is marked as invalid for this precise calculation and is excluded from the covered count.
This mode is labeled “Precise” in the HUD, together with the selected lower timeframe, because it is anchored in actual intrabar data rather than in a geometric model. It provides a closer view of how buying and selling pressure unfolded inside the bar, at the cost of requiring more data and being dependent on the availability of that data.
4. Coverage, lookback, and what the numbers mean
The top part of the HUD reports not only which volume definition is active, but also an additional line that describes the effective coverage of the data.
In Intrabar (Precise) mode, the script displays:
- “Scanned: N Bars”
Here, N counts how many bars since the indicator was loaded have successfully received valid lower timeframe delta data. It is a measure of how much of the visible history has been truly covered by intrabar information, not a lookback window in the sense of a rolling calculation.
In Geometry mode, the script displays:
- “Lookback: L Bars”
In this extracted layer, the lookback value L is purely descriptive. It does not change how the current bar’s volume is computed, and it is not used in any iterative or statistical calculation inside this script. It is meant as a conceptual label, for example to keep the volume layer consistent with a broader framework where lookback length is a structural parameter.
Summarizing these two fields:
- Scanned tells you how many bars have been processed using real intrabar data. - Lookback is a descriptive parameter in Geometry mode in this specific overlay, not a direct driver of the computations.
5. The HUD layout on the chart
The on chart table is intentionally compact and structured to be read quickly:
- Header: a title identifying the overlay as Volume EPO. - Mode line: explicitly states whether the script is in Precise or Geometry mode, and for Precise mode also shows the lower timeframe used. - Coverage line: - In Precise mode, it shows “Scanned: N Bars”. - In Geometry mode, it shows “Lookback: L Bars”. - Volume block: - A line for buy and sell volume, marked with clear directional symbols. - A line for total volume and the absolute delta, accompanied by the sign of the delta. - Numeric formatting uses human friendly suffixes (for example K, M, B) to keep the display readable. - Footer: the current symbol and a time stamp, adjusted by a user selectable timezone offset so that the HUD can be aligned with the trader’s local time reference.
The table can be positioned anywhere on the chart and resized via inputs, and it supports multiple color themes and languages in order to integrate cleanly into different chart layouts.
6. How to use Volume EPO in practice
Volume EPO is meant to be read together with price action and other tools, not in isolation. Typical uses include:
- Studying how often a strong directional candle is actually supported by dominant buy or sell volume. - Comparing the behavior of delta volume between Geometry and Intrabar definitions. - Building a personal intuition for how intrabar data refines or contradicts the simple candle based approximation. - Feeding these insights into separate, lean strategy scripts that do not need to carry the full explanatory logic of volume inside them.
Because it is an overlay layer, Volume EPO can be stacked with other custom indicators without adding new signals or complexity to their logic. It simply adds a clear and consistent view of volume behavior on top of whatever the trader is already watching.
7. Educational and non signalling nature
Finally, it is important to stress that Volume EPO is not a trading system, not a signal generator, and not financial advice. The script does not tell the user when to enter or exit. It only reports how different definitions of volume describe the current bar.
Deciding whether to trade, how to trade, and which risk parameters to use remains entirely with the user and with their own strategy. Volume EPO provides context and clarity around the concept of volume so that those decisions can be informed by a better understanding of how buying and selling pressure is structured inside each candle.
Note: Even on lower timeframes, every reconstruction of volume remains an approximation, except at the true single tick level. However, the closer the chosen lower timeframe is to a one tick stream, the more accurately it can reflect the underlying order flow and balance between buying and selling pressure.

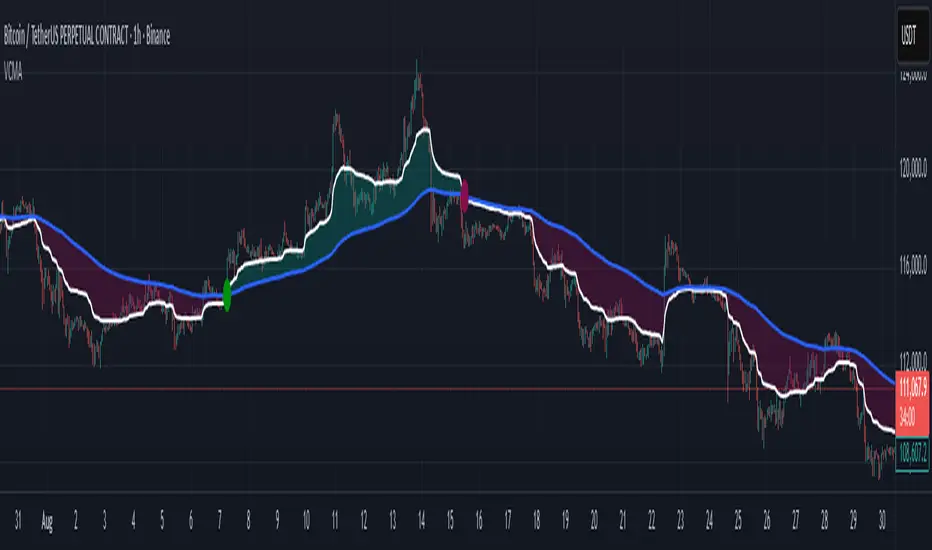
Volumetric Compressed MAVCMA (Volumetric Compressed Moving Average) uses the compressor and weighted standard deviation functions originally translated to pinescript by @gorx1 to plot moving averages in order to use for entry confirmation.
🔹 Concepts and Idea:
When we do music we always use different kinds of filters (low-pass, high pass, etc) for equalization and filtering itself. That stuff we use in finance as well. What we also always use in music are compressors, there dynamic processors that automatically adjust volume so it will be more consistent. Almost all the cool music you hear is compressed (both individual instruments (especially vocals) and the whole track afterwards), otherwise stuff will be too quite and too weak to flex on it, and also DJing it would be a nightmare.
🔹 Model:
I don't wanna explain it all in statistical / DSP way for once.
First of all, I think the population of volumes is log-normally distributed, so let's take logs of volumes, now we have a ~ normally distributed data. We take linearly weighted mean, add and subtract linearly weighted standard deviation from it, these would be our thresholds, the borders between different kinds of volumes explained before.
The upper threshold is for downward compression, that will not let volume pass it higher.
The lower threshold is for upward compression, all the volumes lower than this threshold will be brought up to the threshold's level.
Then we apply multipliers to the thresholds in order to adjust em and find the sweet spots. We do it the same way as in sound engineering when we don't aim for overcompression, we adjust the thresholds until they start to touch the signal and all good.
Afterwards, we delete all the number 1 and number 3 volume, leaving us exclusively with the clear main component, ready to be processed further.
We return the volumes to dem real scale.
For more info on Volume Compression it's highly advised to check @gorx1's initial script Volume Compressor
🔹 Settings:
MA Type: Moving average type to be used for comparison after calculating the compressed version of volume. This creates the second line after the compression line, so we can consider crossovers for confirmation entries.
Upward threshold: Upward threshold where the compression of volume is calculated. Increasing usually causes smoother lines.
Downward threshold: Downward threshold where the compression of volume is calculated. Decreasing usually causes smoother lines.
Compression Lookback: The Main lookback window of a volume that is used for compression. Increasing this would provide smoother lines but might cause delayed signals. Decreasing means more signals, but might cause whiplash and distorted signals.
Comparative Lookback: This is our lookback to be used with our ma type selection. There is no static better or worse lookback value for this indicator. It should be adjusted based on the pair.
🔹 Where to use:
This indicator should be used as another confirmation tool for your entry signals in your existing strategy/market following combination. Green dots (crossovers) mean bullish movement is expected, and red dots (crossbounders) mean bearish movement is expected. Automated crossover alerts are available. A reminder is that this kind of indicator should not be used on its own for trading, but rather should be used as a confirmation along with your trend detection and main entry indicators to provide additional confidence.
If you want to know under the hood, read the How it works section below.
🔹 How it works:
//This is our main compression calculation, which is used for the first line.
Compressed_out = compressor(volume, len_window, up_thresh, down_thresh)
//This is the secondary ratio calculation that we use for the second line.
Comp_ma = ma(ma_type, close * compressed_out, len_ml) / ma(ma_type, compressed_out, len_ml)
Vwma = ma(ma_type, close, len_window)
We calculate the ratio of the compressed volume and plot it against the base MA. Base MA's length is determined by the Compression Lookback input compared to the Comperative Lookback that is used for the compressed version. This provides us with another possible confirmation indicator that can be used to take advantage of volume ranges.
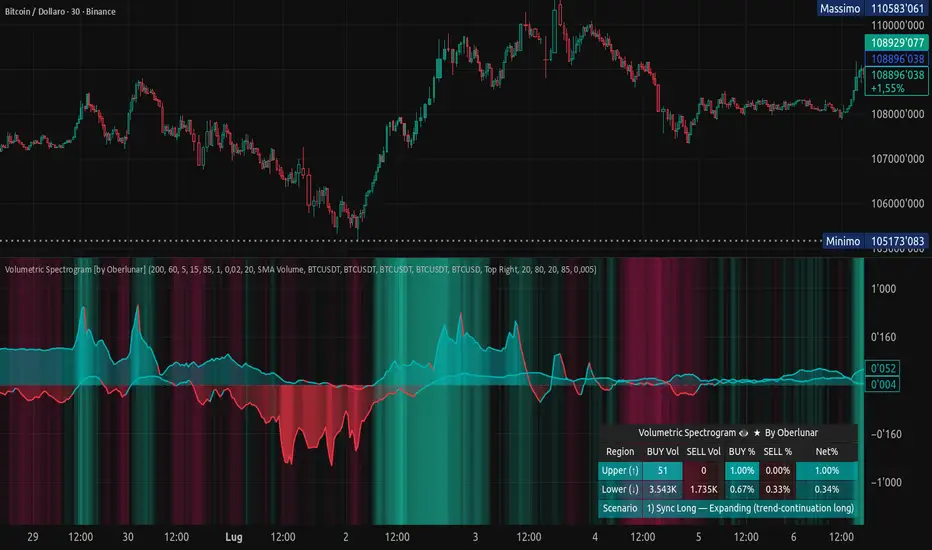
Volumetric Spectrogram [by Oberlunar]Volumetric Spectrogram
A two-pole, price-relative volume profiler that turns regional buy/sell pressure into clean oscillators and actionable regimes in a multi-broker setup.
What it measures
The indicator divides the recent price span into bins and accumulates buy vs. sell volume in each bin, then summarises two regions with respect to the current price:
Upper (↑) — volume that traded above the current price (overhead supply/demand).
Lower (↓) — volume that traded below the current price (underfoot bid/pressure).
Per region, it computes BUY% and SELL%, then forms two normalised oscillators in :
Upper Osc = Upper(BUY%) − Upper(SELL%) → positive when overhead offers are being lifted (breakout acceptance), negative when overhead sell pressure dominates (resistance).
Lower Osc = Lower(BUY%) − Lower(SELL%) → positive when sub-price bids strengthen (support/absorption), negative when selling persists beneath price (weak underbelly).
Both oscillators are optionally smoothed with EMA and can be filled to zero or between curves for quick polarity/strength reading.
Candle-fill modes across brokers
The indicator supports multiple candle-fill policies tied to cross-broker volumetric agreement (e.g., spectral/range-only fills when ≥N brokers align above 70% bullish or below 20% bearish Buy%). This makes regime and pressure shifts visually explicit while filtering out unconfirmed noise.
How it works (core algorithm)
Over a lookback window, find the high/low and split the range into N bins .
For each historical bar, approximate “buy” vs “sell” volume using candle direction and the close relative to each bin’s midprice; update left/right profiles per bin.
Aggregate bins above the current price into the Upper region and bins below into the Lower region; compute regional totals and percentages.
Convert to signed oscillators and smooth (EMA length per input).
Scenario engine (table, every bar)
A compact table reports, for Upper/Lower: BUY Vol, SELL Vol, BUY%, SELL%, and Net%. A classifier labels 8 regimes based on oscillator sign and recent expansion/decay: Sync Long/Short (Expanding/Decaying), Opposite Signs (Widening/Converging), and Tilts (Upper/Lower). This helps distinguish trend continuation, fade risk, compression before break, and asymmetric pressure (e.g., “Tilt Lower — bid/support strengthening”).
# Example strategies and annotated cases:
There are different operational strategies:
1) Bottle-neck Strategy with multi-broker confirmation
When both oscillators are red and they compress toward the zero line (a bottle-neck [/i>), if the squeeze does not flip into the opposite trend but instead resolves in the same direction, you have a continuation setup that can be exploited:
• Pattern: both oscillators red → short, visible contraction (narrow, low-variance cluster) → break of the cluster lows → background shadow bars align bearish (multi-broker agreement).
Example:
This sequence often supports a 1.5–2.5 R/R trade, as in:
Bullish mirror
If both oscillators are teal and compress, then expand upward with multi-broker agreement, the scenario becomes bullish after several bars; the position can be profitable with a reasonable risk setup:
Example:
Follow-through:
Here are the additional, English “playbook” examples you can append to the previous description.
2) Dual-confirmation on volume spikes + multi-broker checks
When pronounced volumetric spikes appear (up or down), trend often reverses sharply. In the figure, the circles highlight the spikes; once the spike subsides (reversion toward baseline), the oscillator turns bullish. The double confirmation of two consecutive minimum spikes acts as support for an ensuing up-move, with fill colors confirming direction.
Chart:
Even with a single spike confirmation, the reversion from an extreme often provides actionable long setups.
3) Volume-pressure + regime-change (multi-broker)
A prospective long configuration emerges when bullish volumetric pressure dominates and bearish pressure fades, especially if this occurs after a lateral phase, followed by a bullish volume spike and multi-broker confirmation .
Chart:
Shadow bars subsequently confirm continuation in a bullish regime; however, a possible regime change is flagged by the scenario classifier and by a color flip in the volumetric borders ( “Possible regime change, but without multi-broker confirmation.” is an appropriate label when applicable).
Chart:
After a verified mean-reversion, price transitions into a bearish configuration: both oscillators turn red. One can wait for a pullback and seek short entries.
Chart:
As shown here, the regime change is anticipated well in advance by the oscillators and multi-broker pressure:
Chart:
4) Contrastive regime-shift with multi-broker validation
In a contrastive trading phase, the lower volumetric oscillator flips color first—buyers start attacking. The first set of background shadow bars does not agree with the regime flip; the second set does. This sequence (oscillator flip → later multi-broker agreement) is a robust early sign of a potential long setup.
Chart:
At the multi-broker level, all shadow bars turn fully green and the setup becomes unambiguously bullish.
Chart:
Note that bearish pressure can still be non-trivial on the volumetric scale—even if it does not reach prior extreme minima—so risk controls should reflect the residual supply.
Delta-bar coloring (optional)
Bars (or candle overlays) can be tinted by a multi-venue weighted bias:
Choose venues (OKX, Coinbase, Bybit, Binance, BlackBull…).
Weight by Equal / Last Volume / SMA Volume.
Apply deadband to suppress flicker around neutrality and a gamma curve to modulate opacity with |bias|.
This layer is independent of the spectrogram core but provides immediate market-wide flow context, consistent with the table and fills.
Inputs (essentials)
Calculation Period and Bins — resolution and depth of the price-range histogram.
EMA length — smoothing per oscillator (optional)
Fill options — to zero / between curves, gradual opacity by |osc|, min/max alpha.
Delta Bar — enable tinting, gamma, neutral band; venue list and weighting mode.
Reading guide
Upper > 0 & expanding : overhead supply is being lifted → breakout acceptance risk rises.
Lower > 0 & expanding : sub-price bids strengthen → pullbacks more likely to absorb.
Opposite signs widening : tug-of-war; avoid late entries.
Converging : compression → prepare for break.
Use the table’s regime label to keep the narrative honest bar-by-bar.
Notes & limits
Buy/Sell attribution uses candle direction and range partitioning (no L2/tick tape).
Venue aggregation relies on per-exchange volume and your chosen weighting; symbols must align (e.g., BTCUSDT pairs).
Oscillators are relative to the current price (regional) by design; they complement, not replace, classical volume profile.
— Oberlunar 👁 ★