TPRC - Time-based Price Range Channel [Free]You define a time range (hours and minutes) and based on this, the indicator draws the price range (high / low) as a channel in your chart - projected into the future and, if desired, also for past days. You are completely free to choose the time range and NOT limited to trading sessions.
In addition, further lines are drawn below / above the price range channel at a distance that you can define (based on the price range).
These lines can serve as target levels, support and resistance lines.
What functions does this free version of the indicator offer?
Selection of the time range for which a price range is to be determined and based on this a price range channel is to be created
Display of 3 additional lines above / below the price range channel
Distance between the lines: height of the price range
Display of the price range channels for the past 3 days as well as for the current day.
Lines are shown in gray
For the past days, only those lines are displayed that are required due to the distance to the price. This will make your chart cleaner.
(Details about the premium version can be found on TradingView: )
How can this indicator be used?
The time-based price range channel and the additional lines can serve as support and resistance lines.
Whether you are enthusiastic about scalping, swing trading or another type of trading,… “TPRC - Time-based Price Range Channel” could therefore support you. Try it out. I want to invite you to experiment and thereby adapt “TPRC” to your own way of trading.
Due to the free choice with regard to the time span, for example “opening range (break-out)” strategies and the like are conceivable. Much has been written or published as a video on the subjects of "Price Range Trading", "Range Trading", "Opening Range Breakout Trading" and the like. Research on this is recommended to every interested trader. I would be happy to provide a list of interesting articles on this topic - just send me a short message.
Due to the implementation and the functions, the focus is definitely on intraday trading strategies.
For which timeframe is this indicator intended?
This indicator was developed for Chart Time Intervals between 1 and 120 minutes, whereby the following Chart Time Intervals have proven themselves and successfully withstand tests: 1, 2, 5, 10, 15, 30, 60, 90
What do I need to consider?
It may be advisable to add further indicators and an analysis of the market structure in order to confirm the signals issued by the indicator. Please note that when you make adjustments to any strategy, you always carry out particularly detailed tests.
Will this indicator be further developed and will I receive free updates?
All my indicators are of course constantly updated and, if possible and with the aim of the indicator justifiable, supplemented by user requests.
An example of the use of this indicator (here with the premium version)
#revision: dv699
In den Scripts nach "swing trading" suchen

RobocanThis script is equipped with
🔵 Robo 2
It offers strategic trading entry and exit points. Truly unique tool for technical analysis for the financial market as it includes calculation of specific metrics like MACD, ATR and RSI.
🔵 Bull & Bear
The signal can be a fairly valuable tool. Momentum is one of those aspects of the market that is crucial to understanding price movements, yet it is so hard to get a solid grip on. It can be used in some instances to generate quality signals but much like with any signal generating indicator, it should be used with caution.
When indicator gives you " Bull " signal , short term momentum is now rising faster than the long term momentum. This can present a bullish buying opportunity.
When indicator gives you "Bear " signal, short term momentum is now falling faster then the long term momentum. This can present a bearish selling opportunity.
🔵 Robo's Cloud
The indicator inspired from Ichimoku CLoud, it uses an unique formula to generate clouds on its own system!
" BUY or ENTER "when the price breaks the Cloud in the direction of the breakout (UP ) and the cloud turns to green colour. Stay in the market until the cloud turns to red colour. Let's assume that You are a swing trader and use 1D candles as long as The candle is above the "green " cloud , you should continue with a trend! No need to hurry to sell until you see the " red " cloud.
🔵 Super Robo
It can perform greatly in a bull and bear market
It's unique algorithm find profitable coins based on "Early Bird + Buy 2 + Volume "gives you ENTRY and EXIT ideas
It works perfectly on the 1W - 3D - 1D charts
🔵 Hell & Moon
When the “Moon or Hell “closes below top of the closing price, a Moon - Buy signal is generated
It works perfectly on the 1W - 1D - 3H charts
🔵 Early Bird Signals
Being an early bird rather than a night owl will naturally lead you to become more successful in trading. There is no secret magic formula to success; this is something you must accept. Trading success is the result of a ‘simple’ list made up of four things: hard work, timing, persistence , and a good dose of Early Bird signals.
it provides high risk & high reward opportunities.
Dont use more than 3 Robo signals at the same time on the chart. Why?
Example, Robo 2 already included 3 different indicators in the formula.
Robo 2 : Truly unique tool for technical analysis for the financial market as it includes calculation of specific metrics like SAR + MACD + Price Movement that gives you ENTRY and EXIT ideas ( Buy 2 & Sell 2 )
If you use more than 3 robo signals, you try to use around " 10 - 12 " different indicators at the same time!
DON'T DO IT!
To get maximum results from your robo advisors, follow the advice below ;
A ) 3 robo signals
B ) 3 robo signals + 1 side strategy
A or B + Pick one bonus below
Dynamic Support Resistance,
Fibonacci Levels
Pivot Support Resistance
Robo signals :
Robo 1
Robo 2
Super EngineeringRobo
Robo 3
Robo 4
Bull & Bear
Hell & Moon
Early Bird
EngineeringRobo's cloud
Ultimate MA crossover strategy
Side strategies :
McGinley Dynamic
Bollinger Bands Strategy
MA 20 & MA 50
MA 50 & MA 200
EMA Trendlines
Robo ( 2 + 3 ) shows you that if the signals are covering each other. So, It is good to keep open it when you use Robo 2 and Robo 3 at the same time.
If you are following any signals, you should always wait for the candle close before buying or selling.
The signal can come and go anytime during the live candle. ALL indicators do that, that is not considered repainting.
Repainting is when a signal appears, the candle is closed, and when you refresh the chart it disappeared. It is logical that until the candle is closed the signal is not decided yet, hence the alert setup as Once per bar Close.
Deluxe never repaints! Yes, you heard it right: you will never have to worry about signal changing after the candle is closed.
________________________________________________________________________Timeframes_____________________________________________________________________
Our recommendations to get the best results:
Swing Trading Crypto : Use 1D Time Frame Candles
Swing Trading Stocks : Use 1W Time Frame Candles
Swing Trading Commodities : Use 1W Time Frame Candles
Day Trading Crypto : Use 3H Time Frame Candles
Day Trading Stocks : Use 1D Time Frame Candles
Day Trading Commodities : Use 1D Time Frame Candles
Not recommended any other time frames.
It gives you all the tools and information you need for day-to-day trading and investing, while also keeping a great buy and sell signals! No excuse to lose in any financial market anymore! Try now!
How can you add the algorithm into your chart?
1. Login to TradingView.com
2. From the homepage, click on ‘Chart’ in the top navigation bar
3. Select “Indicators” on the top-center-middle panel
4. In the indicator library, type "Robocan "
5. Use the website link below to obtain access to this indicator

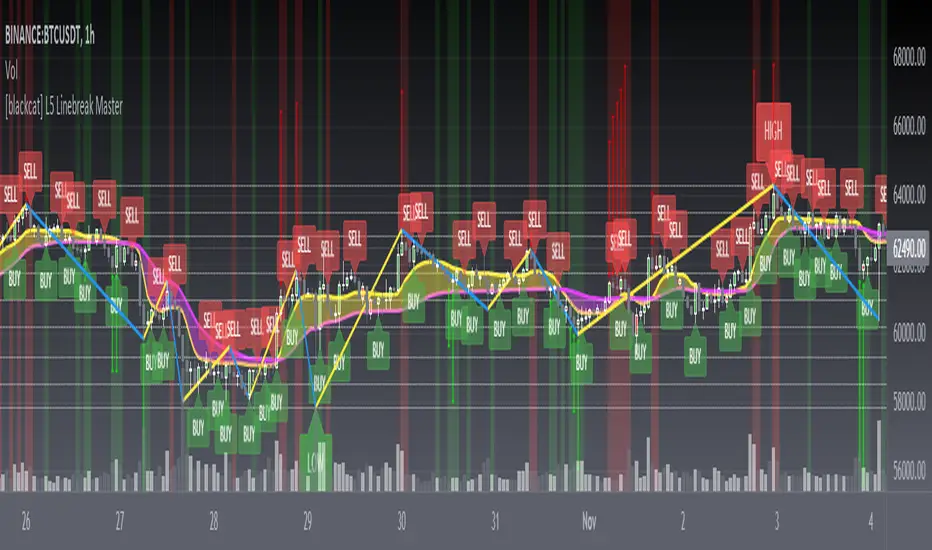
[blackcat] L5 Linebreak MasterLevel: 5
Background
Like many people in the Tradingview community, I have been studying how to apply Line Break Chart to backtesting and live trading for long. However, as we all know, the official Tradingview Line Break Chart is not recommended for backtesting because it will lead to unrealistic backtesting results. So, I thought about developing a Line Break Chart that can be used for backtesting and trading. This "L5 Linebreak Master" is one of them that I am introducing today.
This indicator is based on OHLC data, because this kind of chart can be used for reliable backtesting and live trading in Tradingview. Therefore, the Linebreak Master in this script can actually coexist with the standard Japanese candlestick chart, but the trend reversal information it prompts is based on a principle similar to Line Break Chart. When the two can coexist and produce trading signals at the same time, this is really a very interesting invention.
Function
Linebreak charts were developed in Japan and popularized here by Steve Nisson in his book Beyond Candlesticks. The purpose of linebreak charts is to filter out market noise and give a clear indication of the current trend and trend reversals. As you may know, sometimes determining the current trend can be difficult due to market price movement that consolidates, and a trend reversal can be just as difficult. The green and red bars are called lines. Notice that whenever we have consecutive green lines, each line has a higher close than the previous one; when we have consecutive red lines each line has a lower close than the previous line.
First of all, this Linebreak chart can coexist in the main chart with the Japanese candlestick chart. However, many parts may be overlapped with Japanese candle stick to see it clearly. My recommendation is that users can click "Settings" of main chart and turn off default candle chart.
Secondly, this Linebreak chart can be used for backtesting strategies, because it is essentially OHLC data. And the absolute values of the price is based on the original OHLC data. The certainty of the trend reversal is relatively high. It can be compared with Japanese candlesticks on the timeline.
Finally, this Linebreak chart is embedded with a Linebreak intrinsic trading strategy, which can be used to locate entry points through red and green labels. This strategy supports Tradingview alerts. You can get "LONG" or "SHORT" trading reminders by creating alerts. In order to obtain a clear market structure, Zen Stroke (Autolength ZigZag ), Zen Kiss (Special Moving Averages), Fibnacci Retracement Golden Levels, Unique Fibnacci Time windows and Dynamic Fibonicci support and resistance arrows can be checked to be superimposed and displayed on the main chart to facilitate understanding of the temporal and spatial position of prices in the market.
A trading system based on linebreak charts must must have all entries and exits based on the close or open of a line. The two key values of a linebreak chart are the linebreak number and the underlying time interval. We can construct linebreak charts based on daily, weekly, 5 minute, hourly, any time frame. This allows us to adapt it for day trading or swing trading systems. I developped an inheret linebreak strategy with labels facilitate you to locate trend reversals.
Indicator Set
Linebreak Master Chart (新价图)
Zen Stroke (Auto ZigZag , 自动画缠论笔)
Zen Kiss Moving Averages (缠论均线)
Fibnacci Retracement Golden Levels (半对数-黄金分割线)
Unique Fibnacci Time windows (独创的斐波那契时间窗口)
Dynamic Fibonicci support and resistance arrows (动态斐波那契支撑和阻力箭头)
Inputs
Source Type: Open, High, Low, Close, Hl2, Hlc3, Lx, Vwapc, Vwaplx, Vwaphl2 (Case Sensitive)
Returns source input selection variant, default to "Close" if blank or typo.
Open --> open
High --> High
Low --> Low
Close --> Close
Hl2 --> hl2
Hlc3 --> hlc3
Lx --> Lao Xu 1949 Median Price
Vwapc --> vwap based on close
Vwaplx --> vwap based on Lao Xu 1949 Median Price
Vwaphl2 --> vwap based on hl2
Show Zen Stroke --> True as default
Show Fib Space based on Semi-LOG --> True as default
Zen Fractals Lookback Period --> 377 as default
Key Signal
Bars
Green bars for up trend
Red bars for down trend
Labels
Green labels for buy/long.
Red labels for sell/short.
Zen Stroke ( ZigZag )
Green line section for up stroke
Red line section for down stroke
Moving Averages
Yellow for fast line
Fuchsia for slow line
Pros and Cons
Suitable for discretionary trading and bots via alerts. However, only well selected trading pair and time frame can guarantee bot works.
Intuitive and effective, the output signal is more reliable after multi-indicator resonance
Remarks
My fourth L5 indicator published
Closed-source
Invite-only
How to get it?
500 Tradingview Coins Per Monthly Subscription
5000 Tradingview Coins Per Yearly Subscription
INTRADAY/SWING TRADING - 3 EMASEstimados/as inversores:
Diagramé este indicador para hacer tradings de corto o muy corto plazo.
Es un indicador que a simple vista ayuda al usuario a entrar en posiciones de Compra o de Venta.
Este indicador es un sistema de 3 EMAS. La primera, la de color verde es una EMA de 4 periodos. La segunda, la de color amarillo es una EMA de 9 periodos. Y por último, la de color rojo es una EMA de 18 periodos.
Por otro lado tiene señales de Compra y de Venta las cuales tienen una alta eficacia y eficiencia.
Las señales de BUY (Compra) se dan cuando la EMA verde cruza al alza a la EMA roja. Las señales de SELL (Venta) se dan cuando la EMA roja cruza a la baja a la EMA verde.
En algunas ocasiones, estos cruces se pueden producir muy rápido generando unas falsas entradas en compra o en venta según corresponda.
Para subsanar esto, es importante que se utilice este sistema de BUY y SELL con las columnas de color verde o rojo según corresponda según se ve el gráfico.
El fondo de color verde se da cuando la EMA verde y la EMA amarilla se encuentran por encima de la EMA roja. Sin embargo, cuando la EMA roja se encuentra por encima de la EMA verde y de la EMA amarilla el fondo es de color rojo.
Es importante remarcar que si la EMA verde está por encima de la EMA roja pero la EMA amarilla se encuentra por debajo de la EMA roja, en el gráfico no se va a ver ningún color de fondo. Por otro lado, cuando la EMA verde este por debajo de la EMA roja, pero la EMA amarilla todavía se encuentre por encima de la EMA roja, tampoco va a poder verse ningún tipo de color de fondo.
En resumidas cuentas:
COMPRA-BUY -> Cuando aparezca la señal de BUY y además, esta señal se complemente con un fondo de color VERDE, entonces debemos entrar en LONG. Para cerrar la operación, de manera ganadora, tenemos que esperar a que desaparezca el color de fondo VERDE.
VENTA-SELL -> Cuando aparezca la señal de SELL y además, esta señal se complemente con un fondo de color ROJO, entonces, debemos entrar en SHORT. Para cerrar la operación, de manera ganadora, tenemos que esperar a que desparezca el color de fondo ROJO.
RECOMENDACIÓN: Siempre tener presente que cada inversor tiene una aversión al riesgo distinta. Por favor, cada uno que use este indicador, primero haga una gestión de riesgo y utilice SIEMPRE Stop Loss luego de abrir una posición ya sea estipulando que el precio va a subir o a bajar, es decir, entrando en LONG o en SHORT.
Espero que este indicador les sirva.
Saludos a todos.
DEAR INVESTORS:
I plotted this indicator for short or very short term trading.
It is an indicator that at a glance helps the user to enter Buy or Sell positions.
This indicator is a 3 EMAS system. The first, the green one, is a 4-period EMA . The second one, the one in yellow, is a 9-period EMA . And finally, the one in red is an EMA of 18 periods.
On the other hand, it has Buy and Sell signals which are highly effective and efficient.
The BUY signals are given when the green EMA crosses higher than the red EMA . SELL (Sell) signals are given when the red EMA crosses down to the green EMA .
On some occasions, these crosses can occur very quickly, generating false tickets for purchase or sale as appropriate.
To correct this, it is important that this system of BUY and SELL is used with the green or red columns as appropriate as the graph is seen.
The green colored background occurs when the green EMA and the yellow EMA are above the red EMA . However, when the red EMA is above the green EMA and the yellow EMA the bottom is red.
It is important to note that if the green EMA is above the red EMA but the yellow EMA is below the red EMA , no background color will be seen on the chart. On the other hand, when the green EMA is below the red EMA , but the yellow EMA is still above the red EMA , you will not be able to see any kind of background color either.
In short:
BUY-BUY -> When the BUY signal appears and this signal is complemented by a GREEN background, then we must enter LONG. To close the operation, in a winning way, we have to wait for the GREEN background color to disappear.
VENTA-SELL -> When the SELL signal appears and also this signal is complemented with a RED background, then, we must enter SHORT. To close the operation, in a winning way, we have to wait for the RED background color to disappear.
RECOMMENDATION: Always keep in mind that each investor has a different aversion to risk. Please, everyone who uses this indicator, first do a risk management and ALWAYS use Stop Loss after opening a position either by stipulating that the price is going to rise or fall, that is, entering LONG or SHORT.
I hope this indicator helps you.
Greetings to all.

[blackcat] L2 Ehlers Fisherized Deviation Scaled OscillatorLevel: 2
Background
John F. Ehlers introuced Fisherized Deviation Scaled Oscillator in Oct, 2018.
Function
In “Probability—Probably A Good Thing To Know,” John Ehlers introduces a procedure for measuring an indicator’s probability distribution to determine if it can be used as part of a reversion-to-the-mean trading strategy. Dr. Ehlers demonstrates this method with several of his existing indicators and presents a new indicator that he calls a deviation-scaled oscillator with Fisher transform. It charts the probability density of an oscillator to evaluate its applicability to swing trading.
Key Signal
FisherFilt --> Ehlers Fisherized Deviation Scaled Oscillator fast line
Trigger --> Ehlers Fisherized Deviation Scaled Oscillator slow line
Pros and Cons
100% John F. Ehlers definition translation, even variable names are the same. This help readers who would like to use pine to read his book.
Remarks
The 91th script for Blackcat1402 John F. Ehlers Week publication.
Readme
In real life, I am a prolific inventor. I have successfully applied for more than 60 international and regional patents in the past 12 years. But in the past two years or so, I have tried to transfer my creativity to the development of trading strategies. Tradingview is the ideal platform for me. I am selecting and contributing some of the hundreds of scripts to publish in Tradingview community. Welcome everyone to interact with me to discuss these interesting pine scripts.
The scripts posted are categorized into 5 levels according to my efforts or manhours put into these works.
Level 1 : interesting script snippets or distinctive improvement from classic indicators or strategy. Level 1 scripts can usually appear in more complex indicators as a function module or element.
Level 2 : composite indicator/strategy. By selecting or combining several independent or dependent functions or sub indicators in proper way, the composite script exhibits a resonance phenomenon which can filter out noise or fake trading signal to enhance trading confidence level.
Level 3 : comprehensive indicator/strategy. They are simple trading systems based on my strategies. They are commonly containing several or all of entry signal, close signal, stop loss, take profit, re-entry, risk management, and position sizing techniques. Even some interesting fundamental and mass psychological aspects are incorporated.
Level 4 : script snippets or functions that do not disclose source code. Interesting element that can reveal market laws and work as raw material for indicators and strategies. If you find Level 1~2 scripts are helpful, Level 4 is a private version that took me far more efforts to develop.
Level 5 : indicator/strategy that do not disclose source code. private version of Level 3 script with my accumulated script processing skills or a large number of custom functions. I had a private function library built in past two years. Level 5 scripts use many of them to achieve private trading strategy.

Vicious Cycle 1.2 [CR] - Enhanced█ OVERVIEW
Vicious Cycle 1.2 is an advanced oscillator-based momentum indicator designed to identify high-probability reversal and continuation setups. This new version features adaptive threshold technology, visual trend state classification, and a higher timeframe alignment system to filter low-quality signals.
The indicator analyzes multiple timeframe components and market dynamics to generate a composite momentum score, which is then smoothed and compared against statistical thresholds. Unlike traditional static oscillators, Vicious Cycle adapts its sensitivity zones to current market conditions, reducing false signals during volatile periods and increasing responsiveness during consolidation.
█ FEATURES
Adaptive Threshold System
The indicator employs percentile-based threshold calculations that automatically adjust to recent market behavior. This ensures optimal signal generation across different instruments and market regimes without manual recalibration.
• Toggle between dynamic and fixed threshold modes
• Adjustable lookback period for threshold calculation (50-500 bars)
• Customizable percentile levels for sensitivity tuning
• Separate calibration for overbought and oversold zones
Visual Trend State Classification
Background coloring provides instant visual feedback on market condition strength without requiring analysis of indicator position. The six-state classification system combines oscillator position with signal line relationship to identify:
• Strong bullish momentum
• Moderate bullish bias
• Weak bullish condition
• Weak bearish condition
• Moderate bearish bias
• Strong bearish momentum
Higher Timeframe Trend Alignment
An optional filtering system analyzes higher timeframe trend direction to block counter-trend signals. Two modes are available:
• Single EMA Mode: Uses price position relative to a customizable moving average
• Dual EMA Mode: Employs fast and slow moving average crossover logic
The filter only permits long signals during bullish trends and short signals during bearish trends, significantly improving signal quality in trending markets.
Signal Detection Modes
Multiple signal generation methods accommodate different trading styles:
• Zone-Based Signals: Fires when oscillator crosses key threshold levels
• Signal Line Cross: Generates entries based on oscillator and signal line interaction
Comprehensive Alert System
Pre-configured alert conditions cover all major indicator events:
• Primary signal alerts (zone cross and signal line methods)
• Zone entry and exit warnings
• Extreme level notifications
• Trend filter status changes
• Convenience aggregators for "any long" or "any short" condition
█ HOW TO USE
Initial Configuration
The indicator ships with optimized default settings suitable for most instruments and timeframes. New users should observe the indicator's behavior for at least 50 signals before adjusting parameters.
1 — Add the indicator to your chart and leave default settings unchanged.
2 — Monitor signal generation and background color transitions for several trading sessions.
3 — Set up basic alerts using the "ANY LONG Signal" and "ANY SHORT Signal" conditions.
4 — After observation period, adjust sensitivity based on your instrument's characteristics.
Threshold Configuration
For instruments with higher volatility, increase the percentile values (example: 90/75 instead of 85/65). For ranging or lower volatility instruments, decrease percentile values (example: 80/60 or 75/55).
The lookback period controls how quickly thresholds adapt to changing conditions. Longer lookbacks (150-200) provide smoother adaptation, while shorter lookbacks (50-75) offer more responsive adjustments.
Trend Filter Guidelines
Enable the trend filter in clearly trending markets to reduce whipsaw trades. In ranging or choppy conditions, consider disabling the filter or using a shorter EMA period.
• For position trading: Use 200-period single EMA
• For swing trading: Use 150-period single EMA or 50/200 dual EMA
• For day trading: Use 100-period single EMA or 50/100 dual EMA
If the filter blocks all signals, the market may be ranging near the trend reference level. This is intentional behavior designed to keep you out of low-probability setups.
Signal Interpretation
Primary signals occur when the oscillator crosses threshold zones or intersects the signal line in extreme regions. The strongest setups combine:
• Signal generation in the expected direction
• Background color matching the trade direction (bright colors indicate high conviction)
• Trend filter alignment
• Price action confirmation at key support or resistance levels
█ NOTES
Alert Configuration
Alerts must be manually configured in TradingView and do not activate automatically. Access the alert menu by clicking the indicator name and selecting "Add Alert on Vicious Cycle 1.2...". Choose your desired condition from the dropdown menu and configure notification preferences.
We recommend starting with the aggregated "ANY" alerts rather than subscribing to all individual signal types, as this prevents notification overload during active market periods.
Dynamic Threshold Behavior
The adaptive threshold system requires sufficient historical data (minimum equal to the lookback period setting) to calculate percentiles accurately. During the initial bars, threshold values may appear unusual until adequate history accumulates. This is expected behavior and resolves automatically.
Performance Considerations
The indicator performs percentile calculations on each bar using array operations. While optimized for efficiency, users experiencing performance issues on lower-end devices may reduce the dynamic lookback period or disable the adaptive threshold feature to use fixed thresholds instead.
Compatibility
Vicious Cycle 1.2 is built on Pine Script version 6 and works on all instrument types and timeframes. The indicator does not repaint—all signals finalize at bar close. Historical signals remain stable and do not change with additional price data.
█ RISK DISCLOSURE
This indicator is an analytical tool and does not constitute financial advice. No indicator or trading system guarantees profitable results. Always employ proper risk management, position sizing, and stop-loss protocols. Past performance does not indicate future results. Users are responsible for their own trading decisions and outcomes.

Stock Analysis SoftwareStock Analysis Software is a full trading setup and style that is meant for swing trading stocks, but can also be used for Forex, cryptocurrencies, indices and commodities. Whatever your choice of trading style (Intraday, Scalping, Swing trading, Investing) or trading instrument is (FX, Futures, Cryptos, Stocks) I can tailor it for you specifically. For example if you want to use it for trading Forex intraday I will show you how to use it for that.
The software consists of 11 indicators, 7 are custom and 4 are common and well known indicators available on Tradingview. The system itself is part software and part learning my specific pattern finding techniques. There is no one without the other. This is a complete system
This trading system is something I have developed over the last 10 years through extensive research and development and is now available on this platform.
The indicators used are mostly screening for trend breakouts, support and resistance, specific candle patterns, overextended, volume spikes and more.
This is a system that can be taught easily if one is motivated to learn.
The setup includes a video guide and a live one-on-one full breakdown on how to use it to your benefit.

Trade Crusher: Swing and Day Trade IndicatorHow to use the indicator
Add to favorites/apply to chart.
The indicator can be used for both Swing trade and Intra-day trading.
Swing trading:
--Use with background colors
--Input: 30 or 36
--Time frame: Daily or Weekly
--Buy only when background is aqua
--Sell only when background is red
--Use with bars or candles (use candles without borders to avoid confusion). I suggest to just use bars.
--Place buy orders above the 1st or 2nd blue bar after black bars. The background must be aqua.
--Ignore yellow bars with aqua background. They are shake out bars at the beginning or a trend and warnings of reversal
towards the end of trend.
--Place sell orders bellow the 1st or 2nd yellow bar after black bars. The background must be red.
--Ignore blue bars with red background (same as above).
--Black bars are nothing: Pullbacks/Chop
Day Trading:
--DO NOT use background colors. Un-click.
--Input: 10
--Time frame: 5 minutes
--Use with bars or candles (use candles without borders to avoid confusion). I suggest to just use bars.
--Place buy orders above the 1st or 2nd blue bar after black bars.
--Place sell orders bellow the 1st or 2nd yellow bar after black bars.
--Utilize some sort of scanner that can identify stocks with heavy pre-market volume (news, earnings, etc)
***
Use stop losses however you normally do. Take profits however you normally do.
I do not suggest using with other indicators as you may just paralyze your brain, however, if you find something that works, drop a comment.
Best of luck

TrendShikari NTS - StudyTrendShikari NTS is a Nifty Index, Swing trading system with great profitability. This is the STUDY file for you to generate E-mail / SMS signal alerts (based on your TV plan) and to see crisp and clear graphical Daily trade level plotting. For seeing backtest results and next day trading levels in advance use the STRATEGY file from indicator library. Access to this system will be limited. See my profile status field to see how you can gain access.
Salient Features
1. Daily Bar System. System analyzes a Daily chart of NIFTY to give signals with average holding period of 5 days.
2. Automatic Long and Short signal generation. No need to draw waves / lines and other fancy stuff on your charts to analyze NIFTY any more.
3. Backtester Results Available - Thanks to TradingView, backtest results for previous years (from 1990) are available right in the charting platform for NIFTY.
Having a good trading system is one thing and trading it to make money is a whole different ball game. One thing you must always do if you want to mimic the backtest results in live trading is to follow the rules mentioned below as if your life depends on it.
Trading Rules
1. Each day the system gives you a Long and Short trading level. You go Long on NIFTY when the Daily Long level is breached and you go Short on NIFTY when the Daily Short Level is breached.
2. Trade using Nifty Options, In the Money calls, one strike below the nearest strike price for going Long using Call Option or one strike above the nearest strike price for going Short using Put Option.
3. Preset exit and entry orders of appropriate option contracts every day at market open. To set the levels see the difference in Nifty spot price and the trading levels given by system and then multiply it with 0.8 to give an approximate order trigger price in both directions for the corresponding option contracts.
4. Book profit when Nifty moves significantly along signal direction. Every time NIFTY moves 100 points in your direction you exit the current option contract and enter a trade in the next strike price in the same direction.
5. Rollover before expiry. Its important that you rollover (ideally one day before the expiry day) your Option contact positions by exiting the current month contract and take a new position in the next month contract of the same type and strike price of the current month contract.
6. Trade only Nifty using this system. Also Daily chart has to be used for trading. System parameters have been tested and optimized for Nifty Index Daily patterns only and hence is likely to give stated results with Nifty Daily chart only.
7. Trade all signals. Don't pick and choose or add your own or someone else's analysis to filter the signals. Take confidence from the objective backtest results and not any subjective interpretations.
8. Trade with only that amount of money you can afford to loose. Initial capital that you need to have to trade one lot of NIFTY Option using this system should be at least INR 150000. You need only INR 7500 - 15000 to open a position and the rest is the margin of safety you need to have in your trading account to account for drawdowns in trading. You can add the capital in a staggered need to basis to your trading account. But make sure you have the initial capital mentioned above at your disposal, if need be.
As always your thoughts and inputs are welcome. Happy Trading !!!

Mawhoob (TD - Trend Direction) - v1.1Mawhoob (Trend Direction - TD) Indicator v1.1
Professional Trend Analysis & Market Context Dashboard
----------------------------------------------------
🎯 Overview
----------------------------------------------------
Mawhoob (Trend Direction - TD) is a comprehensive, professional-grade technical analysis tool designed to provide traders with multi-dimensional market insights. This advanced indicator combines a proprietary adaptive trend line with real-time market context data, offering a complete market analysis solution in one elegant package.
✨ Key Features ✨
----------------------------------------------------
📈 Trend Direction Line (TD Line)
----------------------------------------------------
Intelligent Moving Average System: Utilizes a sophisticated blend of EMA, RMA, and WMA with smart adaptive error correction.
1- Dynamic Color Coding:
🟢 Green: Bullish trend (price momentum upward).
🔴 Red: Bearish trend (price momentum downward).
2- Customizable Parameters:
Main Period (1-200): Control long-term vs. short-term sensitivity.
Fast Period (0-50): Fine-tune responsiveness to price changes.
Weighting Factor (0-3): Adjust current price influence on the trend line.
3- Visual Bands: Optional upper and lower bands that create a dynamic channel around the trend line.
----------------------------------------------------
📊 Real-Time Market Dashboard
----------------------------------------------------
A comprehensive information panel displaying multiple technical indicators and market dominance metrics.
Technical Indicators Section:
1- RSI (Relative Strength Index)
Current value with color-coded momentum indication.
Direction status: UP / DOWN / NEUTRAL.
Customizable overbought/oversold levels.
Includes RSI SMA for trend confirmation.
2- MACD (Moving Average Convergence Divergence)
Real-time MACD line value.
Trend direction based on MACD vs. Signal line relationship.
Fully customizable fast, slow, and signal periods.
3- ADX (Average Directional Index)
Trend strength measurement.
Color-coded display: Strong vs. Weak trend.
Adjustable strength threshold.
Market Dominance Section:
1- DXY (US Dollar Index)
Real-time dollar strength tracking.
Direction indicator for forex correlation analysis.
2- BTC.D (Bitcoin Dominance)
Bitcoin market dominance percentage.
Useful for crypto market sentiment analysis.
3- USDT.D (Tether Dominance)
Stablecoin dominance tracking.
Risk-on/risk-off market indicator.
All dominance metrics feature:
Customizable timeframe selection.
UP/DOWN/NEUTRAL directional indicators.
Color-coded values for quick visual assessment.
----------------------------------------------------
🔔 Alert & Signal System
----------------------------------------------------
Price Crossover Alerts: Get notified when price crosses above or below the TD line.
Smart Alert Logic: Filters out neutral/flat market conditions to reduce noise.
Visual Signals: Optional triangle markers on chart (▲ bullish, ▼ bearish).
Once-Per-Bar Frequency: Prevents alert spam while ensuring you don't miss opportunities.
----------------------------------------------------
🎨 Visual Customization
----------------------------------------------------
Candle Color Mode: Option to color candles based on trend direction.
Dashboard Positioning: Choose LEFT, RIGHT, or CENTER placement.
Text Size Options: TINY, SMALL, NORMAL, or LARGE for optimal readability.
Customizable colors for Bullish/Bearish trend lines.
Customizable colors for dashboard backgrounds and borders.
Customizable colors for UP/DOWN/NEUTRAL status indicators.
----------------------------------------------------
📚 Use Cases
----------------------------------------------------
For Day Traders
Quick trend identification with color-coded TD line.
Real-time momentum gauges (RSI, MACD).
Instant crossover alerts for entry/exit timing.
For Swing Traders
Medium-term trend direction with adjustable periods.
ADX strength indicator for high-probability setups.
Market dominance context for broader market analysis.
For Crypto Traders
BTC.D and USDT.D tracking for altcoin season detection.
Integrated multi-indicator analysis.
Customizable timeframes for dominance metrics.
For Multi-Market Analysis
DXY correlation for forex and commodities.
Comprehensive dashboard for quick market scans.
Cross-market sentiment analysis.
----------------------------------------------------
⚙️ Settings & Customization
----------------------------------------------------
Trend Direction Settings
Main TD Period: Adjust overall trend sensitivity.
Fast TD Period: Control responsiveness (0 = no smoothing).
Weighting Factor: Balance between historical and current prices.
Line width and colors for visual preference.
Optional trend bands with adjustable transparency.
Dashboard Settings
Toggle individual indicators on/off.
Customize all indicator periods and thresholds.
Choose timeframe for dominance indices.
Adjust colors, position, size, and borders.
Complete visual control for your trading style.
Alert & Signal Settings
Enable/disable crossover alerts.
Optional visual signals on chart.
Smart built-in filtering to reduce false signals.
----------------------------------------------------
🎓 Best Practices
----------------------------------------------------
Trend Following: Use the TD line as your primary trend filter - trade with the color.
Confirmation: Combine TD direction with RSI and MACD for higher probability setups.
Strength Filter: Use ADX to avoid weak/choppy trends.
Market Context: Check dominance indicators for broader market sentiment.
Alerts: Set alerts to catch reversals without constant chart watching.
----------------------------------------------------
🚀 What Makes This Indicator Special ?
----------------------------------------------------
✅ All-in-One Solution: Multiple professional indicators in one clean package.
✅ Adaptive System: Responds to market conditions, not just static calculations.
✅ Professional Dashboard: Institutional-grade information display.
✅ Real-Time Data: Live updates from multiple markets and assets.
✅ Highly Customizable: Tailor every aspect to your trading style.
✅ Clean Code: Optimized Pine Script v6 for maximum performance.
✅ No Repainting: Uses (barstate.isconfirmed) to ensure calculations only occur on closed bars.
✅ Resource Efficient: Smooth performance even with all features enabled.
----------------------------------------------------
🎯 Perfect For
----------------------------------------------------
Trend identification and following.
Multi-timeframe analysis.
Market sentiment tracking.
Entry and exit timing.
Portfolio management decisions.
Risk assessment through trend strength.
Correlation analysis across markets.
----------------------------------------------------
📝 Notes
----------------------------------------------------
All calculations are performed on confirmed bars to prevent repainting.
Dashboard updates in real-time as market conditions change.
Dominance indices (DXY, BTC.D, USDT.D) require market data access.
Best results achieved when combined with proper risk management.
Suitable for all markets: stocks, forex, crypto, commodities, indices.
----------------------------------------------------
💡 Pro Tips
----------------------------------------------------
Start with default settings and adjust based on your timeframe.
Lower periods (5-10) for scalping, higher (20-50) for swing trading.
Use the dashboard as a quick health check for your current positions.
Combine TD line with support/resistance for confluence.
Watch dominance indicators for early market regime changes.
----------------------------------------------------
⚠️ Important Notes
----------------------------------------------------
This indicator is for educational and informational purposes only.
Always confirm signals with your own analysis before trading.
Use proper risk management and position sizing.
The indicator works on all timeframes and instruments.
Past performance does not guarantee future results.
----------------------------------------------------
🔄 Updates & Support
----------------------------------------------------
Current Version: v1.1
This indicator is actively maintained and updated. Future versions may include additional features and improvements based on user feedback.
----------------------------------------------------
🙏 Acknowledgments
----------------------------------------------------
Created & designed by: @mawhoobx
📝 Remember: The best indicator is the one combined with proper risk management, discipline, and a solid trading plan. This tool is designed to assist your analysis, not replace your judgment.
Trade Smart. Trade Safe. Trade Profitable.

SMC Structure & Expectation [WavesUnchained]SMC Structure & Expectation - Professional Context & Confirmation Tool
A sophisticated Smart Money Concepts indicator that combines objective market structure analysis with intelligent expectation logic and professional order block validation. Built for traders who value context over signal spam.
4-LAYER ARCHITECTURE
Layer 1: Market Structure
✓ Objective HH/HL/LH/LL detection based on confirmed pivot swings
✓ Internal structure tracking (micro swings within major legs)
✓ Structure alignment detection (Internal + External agreement)
✓ No predictions - pure price action description
Layer 2: Expectation/Bias
✓ Logical hypotheses derived from current structure
✓ "Expect HL" in bullish structure / "Expect LH" in bearish structure
✓ "Expect Continuation" after BOS events
✓ Expectation ≠ Signal (can be wrong, that's the point)
Layer 3: Confirmation (BOS + Order Blocks)
✓ Break of Structure (BOS) detection with 2 modes:
• Conservative: Close-cross (default)
• Aggressive: High/Low-cross with optional close confirmation
✓ Professional Order Block System with 8 intelligent filters
✓ Only creates OBs when expectation is met
✓ Maximum 1 OB per direction (quality over quantity)
Layer 4: Optional Warnings
✓ Trendline break detection
✓ Early Top/Bottom warnings (volume + volatility divergence)
✓ Can be disabled for clean chart focus
PROFESSIONAL ORDER BLOCK SYSTEM
8 Quality Filters (Cascade Logic):
1. BOS-Only Guard : No OB without confirmed Break of Structure
2. Displacement Filter : Minimum 1.0 ATR momentum (customizable)
3. Location Filter : Must be in Premium (bearish) or Discount (bullish) zone
4. Size Filter : 3 modes available:
• Hard Limit: Reject oversized OBs (strict)
• Score Penalty: Allow but reduce priority (balanced, default)
• Disabled: No size filtering (permissive)
5. Volume Filter : Optional relative volume threshold
6. FVG Filter : Optional Fair Value Gap requirement
7. Mitigation Tracking : 30% penetration = mitigated (score penalty)
8. TTL (Time-To-Live) : Auto-delete after 80 bars (prevents chart clutter)
Priority Scoring System (0-100):
• HIGH Priority (>80) : Bright colors, zero transparency
• MED Priority (50-80) : Normal colors, 30% transparency
• LOW Priority (<50) : Faded colors, 60% transparency
Score Components:
✓ Displacement strength (10-30 points)
✓ FVG confluence (+20 points)
✓ Relative volume (+5-15 points)
✓ Premium/Discount location (+10-20 points)
✓ Structure alignment (+30 points if aligned, -15 if conflict)
✓ Leg strength (+15-25 points for strong impulse vs correction ratio)
✓ Size penalty (-0 to -30 points if oversized, Score Penalty mode only)
BAR COLORING MODES
Choose your preferred visual feedback:
1. Off : No bar coloring
2. Structure : Bullish/Bearish/Neutral structure states
3. Expectation : Continuation zones (green = expect bullish, red = expect bearish)
4. BOS + OB Priority (Default):
• Highlights active Order Blocks by priority
• BOS events in bright neon
• Faded structure colors when no OB active
5. Multi-Layer : Combines structure + priority intensity
6. Alignment : Shows Internal/External structure alignment (orange = conflict warning)
INTELLIGENT LOGGING SYSTEM
Priority-based log filtering to reduce noise:
• All : Every event (debug mode)
• MED+ : Only medium and high priority events
• HIGH Only : Only high priority setups
• Smart (Default): Adaptive filtering based on priority + context
Logs include:
✓ Structure changes (HH/HL/LH/LL)
✓ Expectation updates
✓ BOS events with confirmation status
✓ OB creation with full scoring breakdown
✓ OB reactions (Tap/Deep/Failure classification)
✓ Rejection reasons with "Potential Lost" analysis
CONFIGURATION HIGHLIGHTS
Layer 1: Structure
• Pivot detection length: 5 (left) / 5 (right)
• Internal structure: Optional micro-swing tracking
• Swing confirmation: Closes beyond pivot required
Layer 2: Expectation
• Expectation expiry: 40 bars (auto-reset after timeout)
• Visual feedback: Labels + optional expectation zones
Layer 3: Confirmation
• BOS Mode: Close-cross (conservative) / High/Low-cross (aggressive)
• Close Confirmation: Optional 3-bar window for aggro mode
• Displacement: Min 1.0 ATR (customizable)
• Size Filter Mode: Hard Limit / Score Penalty / Disabled
• OB Location: 38% discount / 62% premium thresholds
• OB Size Range: 0.3-1.2 ATR (customizable)
• TTL: 80 bars default
• Volume Filter: Optional, 1.0x minimum
• FVG Requirement: Optional
Layer 4: Warnings
• Trendline break detection
• Early Top/Bottom signals
• Can be fully disabled
BEST USE CASES
✓ Context Tool : Understand where you are in the market cycle
✓ Confirmation Filter : Validate trade ideas with structure alignment
✓ Order Block Trading : High-probability zones with priority scoring
✓ Educational : Learn SMC concepts with transparent logic
✓ Multi-Timeframe Analysis : Combine with HTF structure for confluence
Optimized for:
• Commodities (NatGas, Gold, Oil)
• 1H - 4H timeframes
• Swing trading / Intraday positioning
KEY FEATURES SUMMARY
✓ Zero signal spam - only high-conviction setups
✓ Transparent scoring system - know why each OB matters
✓ Adaptive to market conditions - structure alignment detection
✓ Flexible filtering - customize to your risk tolerance
✓ Priority-based visuals - instantly identify best opportunities
✓ Professional logging - learn from rejections and acceptances
✓ Clean chart - auto-cleanup with TTL system
✓ Bar coloring modes - choose your visual feedback style
✓ Size Filter Mode - prevent blocking of high-quality oversized setups
PHILOSOPHY
This indicator follows the principle: "Context over signals, quality over quantity"
Expectations can be wrong - that's the point. They help you stay aware of the most likely scenario while remaining open to structure changes. When expectation is met AND confirmed by BOS + quality OB, you get a high-conviction setup.
Not a holy grail. Not a signal service. A professional analysis tool.
Version: 1.0.0
Author: WavesUnchained
Pine Script: v6

CRSI-TSA Colored RSI Entry Exit Signals [TheScalpingAnt]
CRSI-TSA – Colored RSI Entry/Exit Signals
Credit: LuxAlgo (Original RSI Concept & Foundation)
Developed / Implemented by: The Scalping Ant
Overview
CRSI-TSA is a professional momentum-based trading tool designed to visually enhance RSI-based trading and simplify decision-making. Built for traders who want clear directional bias, clean entry/exit signals, and a premium institutional look, this indicator transforms traditional RSI into a structured, actionable trading system.
Whether you scalp, day trade, or swing trade, CRSI-TSA helps you quickly identify momentum shifts, trend continuation, and exhaustion points with intuitive visual cues and highly optimized design logic.
Concepts
This indicator is built on the enhanced RSI framework conceptualized by LuxAlgo, then strategically implemented and redesigned by The Scalping Ant to improve:
• Readability
• Practical trade execution usability
• Signal visual clarity
• Professional presentation quality
CRSI-TSA blends:
• RSI momentum evaluation
• Signal line smoothing
• Mid-zone structure analysis
• Visual confidence zones
• Entry/Exit trigger confirmations
The result: A clearer RSI designed for real trading, not just analysis.
Features
✔️ Advanced RSI Momentum Engine
✔️ Dynamic Signal Line with Multiple MA Options
✔️ Bull/Bear Ribbon Fill for Instant Bias Recognition
✔️ Clean Mid-Zone Structure for Market Phase Clarity
✔️ Entry & Exit Markers with Optimized Visibility
✔️ Optional Top/Bottom Panel Background
✔️ Fully Adaptive to Any Asset / Any Timeframe
✔️ Alerts for Bullish & Bearish Cross Conditions
✔️ Minimalistic Yet Highly Informative Design
Customization
CRSI-TSA is intentionally flexible while remaining structured.
You can customize:
• RSI Length
• Source Input
• Signal Method (EMA / SMA / RMA / TMA)
• Ribbon Colors (Bullish & Bearish)
• Background Panel Visibility & Colors
• Default Visual Preferences
This allows full personalization without breaking the core logic.
Usage
Recommendation for:
• Scalping
• Day Trading
• Swing Trading
• Trend Confirmation
• Momentum Trading
• Pullback Entries
• Reversal Timing
Bullish Bias
When RSI crosses above the Signal Line → Momentum Strengthening
Bullish background ribbon turns active → Buy Bias
Bearish Bias
When RSI crosses below Signal Line → Momentum Weakening
Bearish ribbon activates → Sell Bias
Use additional confluence such as:
• Price structure
• Key levels
• Market session behavior
• Trend direction
Example Trading Logic
Simple Strategy Concept
1️⃣ Wait for signal cross
2️⃣ Confirm ribbon color bias
3️⃣ Enter in direction of signal
4️⃣ Manage position per your own risk model
This indicator is NOT a “magic arrow”. It is a professional trading tool to support disciplined strategy execution.
Settings
Inputs
• RSI Length (default 21)
• Signal Length (default 14)
• Signal Type: EMA / SMA / RMA / TMA
Visual
• Bull Ribbon Color
• Bear Ribbon Color
• Optional Top/Bottom Panel Background
Alerts
• Bullish RSI Crossover
• Bearish RSI Crossunder
Conclusion
CRSI-TSA delivers:
• Simplicity
• Professional execution clarity
• Enhanced RSI visualization
• Powerful trading confidence
Built for traders who demand precision and a visually refined interface.
If you value structured charts, cleaner decision-making, and professional-grade trading tools, this indicator belongs in your toolkit.
Disclaimer
This tool does NOT guarantee profits. It is an analytical decision-support tool.
Trading involves risk. Past performance does not guarantee future results.
Always use risk management and proper trading discipline.
You alone are responsible for trading decisions.

Swing Sniper ICT [Stansbooth]
🚀 ICT Swing Trader Pro – Precision Market Structure & Smart Money Trading
ICT Swing Trader Pro is a powerful price-action based swing trading indicator inspired by ICT and Smart Money Concepts, designed to help traders capture high-probability trend moves while holding positions for maximum pip potential.
This indicator combines Market Structure, Fair Value Gaps, Order Blocks, HTF Bias, and Smart Trailing Logic into one clean and efficient trading system — perfect for Forex, Indices, Crypto, and Commodities.
🔍 Core Features
🏗️ Market Structure Intelligence (BOS & MSS)
Automatically detects Swing Highs & Swing Lows
Identifies Market Structure Shifts (MSS / CHoCH)
Clearly defines Bullish & Bearish trends
Filters fake breakouts using real price confirmation
💎 Fair Value Gaps (FVG)
Detects Bullish & Bearish Fair Value Gaps
Highlights institutional imbalance zones
Adjustable FVG extension length
Optional mitigation filtering for clean charts
🧱 Smart Order Blocks
Automatically marks Bullish & Bearish Order Blocks
Based on last opposing candle before strong displacement
Helps identify high-probability reaction zones
📈 Higher Timeframe Bias Filter
* Align trades with Higher Timeframe trend
* Uses HTF EMA structure logic
* Avoids counter-trend entries
* Improves win-rate & trade quality
⚡ Displacement & Volume Strength Filter
* Confirms entries using strong impulsive candles
* Filters weak market moves
* Ensures trades follow real institutional momentum
🎯 High-Accuracy Entry Signals
Swing BUY & SELL signals based on:
* Market Structure Shift
* HTF Confirmation
* Price Action Strength
* Ideal for **swing traders & position traders**
🛡️ Holding Mode – Trail Big Moves
* Built-in **ATR-based trailing stop**
* Designed to hold **large trend moves**
* Helps traders stay in trades longer
* Perfect for capturing **thousands of pips**
📊 Live Dashboard
* Real-time **Trend Status**
* HTF Bias confirmation
* Clean, minimal, and informative display
✅ Best Use Cases
✔ Forex Swing Trading
✔ Indices & Gold
✔ Crypto Trend Trading
✔ Higher Timeframe Execution
✔ ICT / Smart Money Traders
⚠️ Disclaimer
This indicator is a **decision-support tool**, not financial advice. Always use proper **risk management** and combine with your own trading plan.
🔥 **Trade with structure. Trade with discipline. Trade like Smart Money.**
**ICT Swing Trader Pro – Built for serious traders.**

Project AETHER v3.1 - The Chronos Interface [Ghost Edition]**Advanced price action indicator with Ghost Candles, Smart Zones, and Momentum-Based Entry Signals**
**Project AETHER v3.1: The Chronos Interface **
A sophisticated multi-layered trading system designed to identify high-probability entry points by combining structural analysis with momentum confirmation.
---
#### 🌟 KEY FEATURES
**Ghost Candle Technology**
- Hollow candles reveal the true nature of price action
- Color-coded visualization: Neon glow indicates strength, transparency shows absorption
- Instantly distinguish between impulse moves and liquidity traps
**Context-Aware Structure Analysis**
- Automatic detection of Market Structure Shifts (MSS)
- Break of Structure (BOS) identification with clean visual markers
- Narrative-based approach: Know when you're trading with or against the trend
**Counter-Attack Zones (Breaker Blocks)**
- Identifies potential reversal zones where trapped traders exist
- Semi-transparent boxes mark areas of interest
- Perfect for planning entries at key institutional levels
**Golden Pocket Integration**
- Dynamic support/resistance zones based on price swings
- Automatic pivot detection adapts to any timeframe
- Optional inverted zones for both bullish and bearish scenarios
**W Power Confirmation System**
- Proprietary momentum algorithm for signal validation
- Customizable sensitivity levels for different market conditions
- Filters out weak signals, highlights high-conviction entries
**Smart Signal Generation**
- ⚡ **GP LONG/SHORT**: Zone touch + momentum confirmation
- 🔄 **REVERSAL**: Rejection signals when price fails to hold zones
- Built-in cooldown prevents signal spam
- ATR-based label positioning for clean charts
---
#### ⚙️ CUSTOMIZATION
**Context Settings**
- Structure sensitivity adjustment
- BOS/MSS visualization toggle
**Defense (Breaker) Settings**
- Counter-attack zone visibility
- Volume and efficiency thresholds
**Golden Pocket Settings**
- Pivot detection length
- Bullish/Bearish zone toggles
- Signal cooldown period
- Normal and Reversal signal modes
- ATR-based reversal zone sizing
**W Power Settings**
- Enable/disable momentum filter
- Channel and average length tuning
- Custom level thresholds for long/short entries
- Precise control over signal sensitivity
---
#### 📈 BEST USE CASES
- **Swing Trading**: Identify key reversal zones
- **Scalping**: Quick entries with momentum confirmation
- **Trend Following**: Structure-based entries in direction of trend
- **Reversal Trading**: Catch failed breakouts with reversal signals
---
#### 💡 HOW TO USE
1. **Add indicator to chart** - Ghost candles will automatically overlay
2. **Watch for structure** - Green/Red backgrounds show bullish/bearish bias
3. **Wait for zone touches** - Price approaching golden zones
4. **Confirm with momentum** - ⚡ or 🔄 signals appear when conditions align
5. **Manage trades** - Use zone boundaries for stop-loss placement
---
#### ⚠️ DISCLAIMER
This indicator is for educational purposes only. Trading involves risk of loss. Past performance is not indicative of future results. Always use proper risk management and never risk more than you can afford to lose.
---
#### 🔄 VERSION HISTORY
**v3.1 - Ghost Edition**
- Complete visual overhaul with Ghost Candle technology
- Added W Power momentum confirmation system
- Improved GP zone detection
- Added Reversal signal mode
- Enhanced signal timing with Touch & Wait system
- ATR-based label positioning
- Multiple cooldown mechanisms
---
**Tags**: `price-action` `momentum` `reversal` `support-resistance` `swing-trading` `scalping` `structure` `breaker-blocks` `smart-money`

SuperTrend Weighted by Divergence█ OVERVIEW
SuperTrend Weighted by Divergence is a trend-following indicator based on the classic SuperTrend, enhanced with dynamic ATR weighting driven by divergences. Its key feature is adaptive behavior: when a divergence appears, the indicator temporarily reduces the ATR multiplier, allowing the trend line to react faster to potential market reversals.
The indicator remains clean, visually clear, and well suited for traders who want to combine trend-following with early detection of weakening momentum.
█ CONCEPT
One of the biggest drawbacks of trend indicators is their lagging nature, caused by the characteristics of source data. Classic SuperTrends react only after the trend has already developed, which often leads to late entries or exits.
The idea behind SuperTrend Weighted by Divergence is to introduce dynamic adjustment of the trend line in response to the first signs of trend weakening.
Instead of treating ATR as a constant volatility buffer, the indicator temporarily modifies its impact when the market sends warning signals in the form of price–oscillator divergences.
For divergence detection, a hidden auxiliary oscillator called “MPO4 Lines – Modal Engine” (default settings) is used. This oscillator is not displayed on the chart – only the points where divergences are detected are shown as markers on price bars.
Divergences do not generate direct entry signals; they are used solely to temporarily adjust the behavior of the SuperTrend.
If, after detecting a divergence against the current trend, a divergence in line with the trend appears, the previous divergence is invalidated and the SuperTrend returns to its standard behavior (base ATR multiplier).
█ FEATURES
Data sources:
- ATR (Average True Range)
- Reference point: HL2 (high/low average)
- MPO4 Lines – Modal Engine oscillator (hidden, used only for divergence detection)
Divergence logic:
- Bullish divergence: lower low in price + higher low in the oscillator
- Bearish divergence: higher high in price + lower high in the oscillator
- Divergences are detected using pivots (left/right)
- Divergence detection is delayed by the pivot length, as confirmation requires a fixed number of bars on the right side
Divergence impact:
- After a divergence is detected, the ATR multiplier is reduced
- The reduction strength is controlled by Divergence Sensitivity
- The effect is active only for a limited number of bars – 200 bars by default (divBars)
- The effect is canceled on trend change or when a trend-aligned divergence appears
Trend change logic:
- Trend changes only after a confirmed close beyond the trailing line
- No repainting
- Trend lines break at reversal points
Visual signals:
- “Buy” and “Sell” labels only on confirmed trend changes
- Optional bar coloring based on current trend (Color bars by trend)
- Soft fill between price and the trend line
- Divergence markers (dots above/below bars) shown at the point of divergence detection, not across the entire divergence structure
Alerts:
- Buy Signal – trend change to bullish
- Sell Signal – trend change to bearish
- Bullish Divergence
- Bearish Divergence
█ HOW TO USE
Adding the indicator:
Paste the code into Pine Editor or search for “SuperTrend Weighted by Divergence” on TradingView
Main settings:
- ATR Length – ATR period
- Base ATR Multiplier – base SuperTrend width
- Pivot Length – divergence sensitivity and detection delay
- Divergence Sensitivity – strength of divergence impact (0.0–1.0)
- Color bars by trend – enable / disable bar coloring
- Line and fill colors – fully customizable
Interpretation:
- Green line and bars = uptrend
- Red line and bars = downtrend
- Divergence against the trend = possible weakening and faster SuperTrend reaction
- Trend-aligned divergence = return to standard SuperTrend behavior
- No divergence = classic, stable SuperTrend behavior
█ APPLICATIONS
Ideal for:
- Trend-following
Entering positions only in the direction of the current trend, using the SuperTrend as a directional filter.
- Early detection of trend weakness
Repeated divergences against the trend may indicate decreasing momentum and a potential upcoming reversal.
- Markets with variable dynamics (crypto, indices, forex)
Entries based on trend changes, preferably confirmed by other tools such as Fibonacci levels, RSI, support/resistance, or market structure.
- Scalping, day trading, and swing trading (with parameter adjustments)
Increasing Divergence Sensitivity to around 0.4–0.5 produces many more signals on small, often short-lived moves.
These settings work well for scalping and day trading, but are not ideal for swing trading, as they tend to generate more false signals and frequent trend changes.
█ NOTES
- Works on all markets and timeframes
- Divergences are used to adapt SuperTrend behavior, not as standalone entry signals
- Higher Divergence Sensitivity = faster reaction and more signals
- Lower Divergence Sensitivity = smoother trend and fewer changes
- Best results are achieved by tuning parameters to the instrument and trading style

Position Size ProRMI Position Size Pro | Risk Dashboard
RMI Position Size Pro is a professional risk management and position sizing tool designed for traders who take capital preservation seriously.
The indicator automatically calculates the optimal position size based on your account balance, risk per trade, and Entry / Stop Loss / Take Profit levels — directly on the chart you are trading.
It works seamlessly across Forex, Gold (XAUUSD), Silver (XAGUSD), indices, and CFDs, adapting to the active symbol.
Key Features
Automatic position size calculation based on fixed risk (%)
Clear on-chart Risk Dashboard showing:
Entry, Stop Loss, Take Profit
Risk in % and USD
Position size (lots / contracts)
Risk-to-Reward ratio (R:R)
Visual Entry / SL / TP levels plotted on the chart
Entry (blue), Stop Loss (red), Take Profit (green)
Supports manual input or chart-click selection for price levels
Clean, minimal, and professional layout — no chart clutter
Fully compatible with Forex, Metals, Indices, and CFDs
No swaps, commissions, or spread assumptions - pure risk calculation
Why RMI Position Size Pro?
Most traders fail not because of bad analysis, but because of poor risk management.
This tool removes emotion and guesswork by ensuring every trade risks exactly what you define nothing more, nothing less.
Built for serious traders, prop-firm traders, and professionals who value consistency, discipline, and clarity.
Best Use Cases
Day Trading & Scalping (M1–M15)
Swing Trading
Prop Firm Challenges
Risk-controlled portfolio trading
Disclaimer
This indicator is a risk management tool, not a trading signal or financial advice.
All trading decisions remain the responsibility of the user.

DX Supply and Demand Pro💎 DX Supply and Demand Pro: Adaptive Line and Zone Mastery
The DX Supply and Demand Pro indicator is an advanced, hybrid trading tool engineered for precision and context. It seamlessly integrates the proprietary Arbitor Line with dynamic, volume-weighted Supply and Demand Zones. This unique combination provides traders with a clear, adaptive view of both the current trend bias and critical structural price levels.
⚠️ Critical Trading Disclaimer 🛑
Trading is highly speculative and carries a substantial risk of loss. The use of this indicator does not guarantee profits, and you may lose more than your initial capital. Before using this tool in a live trading environment, you must test its performance thoroughly using paper trading or a simulated account.
Why Traders Need the DX S&D Pro 🎯
Proprietary Adaptive Intelligence: The Arbitor Line is a calculated price anchor derived from a complex, undisclosed combination of multiple market factors and proprietary equations. It automatically adjusts its sensitivity based on the chart's timeframe, effectively filtering out market noise to present an accurate, weighted average of the prevailing market bias.
Structural Clarity: It detects high-probability Supply and Demand Zones using pivot points, filtering them for strength based on volume, ATR (volatility), and High Volume Node (HVN) confirmation from a higher timeframe.
Actionable Confluence: The indicator combines dynamic trend bias (the Arbitor Line) with static structural levels (S&D Zones). This allows traders to identify high-conviction setups where the structural turning point is confirmed by the real-time bias of the Arbitor Line.
📚 How to Use DX Supply and Demand Pro
This indicator is best used as a confluence tool, where the Arbitor Line confirms the strength and direction of the setup identified by the Supply/Demand Zones.
Trading Confluence with the Arbitor Line:
Scenario: Buy Zone Rejection 🟢
Condition: Price touches a Demand Zone.
Confluence: The Arbitor Line is Above the zone.
Interpretation: Indicates a Bullish Bias is confirming the structural support. Focus on long entries.
Scenario: Sell Zone Rejection 🔴
Condition: Price touches a Supply Zone.
Confluence: The Arbitor Line is Below the zone.
Interpretation: Indicates a Bearish Bias is confirming the structural resistance. Focus on short entries.
Scenario: Momentum Break ⚡
Condition: Price Closes strongly beyond a zone.
Confluence: The Arbitor Line is Aligned with the Break.
Interpretation: Confirms market momentum and suggests the structural break is valid for directional continuation.
⚙️ Key Settings and Optimization Guide 🔧
Arbitor Line Settings (Trend Bias):
VWAP Weight: (Default: 0.33) — The weight applied to a key volume component within the proprietary Arbitor calculation.
Suggestion for High Volatility/Volume: Increase to 0.40 to emphasize volume's influence.
Suggestion for Clean Trends: Decrease to 0.25 to allow momentum components to dictate the line's position.
Supply & Demand Zone Settings (Structural Levels)
HVN Volume TF: (Default: D - Daily) — Crucial Context Setter. The higher timeframe used to look for High Volume Nodes (HVNs) to confirm zone strength.
For Scalping (1m-15m): Use 1H or 4H for validation.
For Day Trading (30m-1H): Use 4H or D. D is the recommended default.
For Swing Trading (4H-Daily): Use W (Weekly).
HVN Bonus %: (Default: 20) — The strength boost applied to a zone if it aligns with an HVN.
Max Supply/Demand Zones: (Default: 2) — Limits the number of active, displayed zones to keep the chart clean.
Retest Bonus %: (Default: 10) — Boosts a zone's strength score each time it is retested (up to max retests).
Time Decay Rate %: (Default: 1) — Reduces a zone's strength for every 10 bars it remains unbroken (stale zones weaken).
Flip Zone on Break: (Default: True) — Turns a broken Demand Zone into a Supply Zone (and vice versa), reflecting structural flip concepts.
💡 Suggestions for Power Users 🚀
Look for Flipped Zones: Pay attention to zones that have been broken and flipped (indicated by yellow text in the labels). Flipped zones that confirm the Arbitor direction often lead to high-momentum continuation moves.
Confirm HVN Strength: Always prioritize trading zones with a high strength score (e.g., 90% or higher), as this indicates maximum confluence of Volume, Volatility, and the HVN Bonus.
Adaptive Timeframes: Use the indicator on multiple timeframes to ensure the Arbitor bias aligns with your trade direction. If the Arbitor is bullish on both the 5-minute and the 1-hour chart, the conviction is exceptionally high.
Final Note: The DX S&D Pro combines the best of trend following with the best of structural trading. It's so good, we call it the Arbitor because it settles the arguments between buyers and sellers... until the next bar, of course! 😉
....................................................................................
💎 مؤشر DX Supply and Demand Pro: خط التكيّف وإتقان المناطق ✨
مؤشر DX Supply and Demand Pro هو أداة تداول هجينة ومتقدمة مصممة للدقة والسياق. إنه يدمج بسلاسة خط Arbitor الخاص بنا مع مناطق العرض والطلب الديناميكية المرجحة بالحجم. يوفر هذا المزيج الفريد للمتداولين رؤية واضحة ومتكيفة لكل من انحياز الاتجاه الحالي ومستويات الأسعار الهيكلية (Structural Price Levels) الحرجة.
⚠️ إخلاء مسؤولية حاسم بشأن التداول 🛑
التداول ينطوي على مخاطرة عالية للغاية ويحمل مخاطر خسارة كبيرة. استخدام هذا المؤشر لا يضمن الأرباح، وقد تخسر أكثر من رأس مالك الأولي. قبل استخدام هذه الأداة في بيئة تداول حقيقية، يجب عليك اختبار أدائها بشكل شامل باستخدام التداول الورقي (Paper Trading) أو حساب محاكاة.
لماذا يحتاج المتداولون إلى مؤشر DX S&D Pro 🎯
ذكاء تكيّفي خاص (Proprietary Adaptive Intelligence): خط Arbitor هو مرساة سعر محسوبة مشتقة من تركيبة معقدة وغير معلنة من عوامل سوق متعددة ومعادلات خاصة. يقوم بضبط حساسيته تلقائيًا بناءً على الإطار الزمني للرسم البياني، مما يزيل ضوضاء السوق بشكل فعال لتقديم متوسط مرجح ودقيق للانحياز السائد في السوق.
وضوح هيكلي (Structural Clarity): يكتشف مناطق العرض والطلب ذات الاحتمالية العالية باستخدام نقاط التحول (Pivot Points)، ويقوم بترشيحها وتحديد قوتها بناءً على الحجم، ATR (التقلب)، وتأكيد من عقدة الحجم العالية (HVN) من إطار زمني أعلى.
تضافر قابل للتطبيق (Actionable Confluence): يجمع المؤشر بين انحياز الاتجاه الديناميكي (خط Arbitor) ومستويات الهيكل الثابتة (مناطق العرض والطلب). يتيح ذلك للمتداولين تحديد إعدادات ذات قناعة عالية حيث يتم تأكيد نقطة التحول الهيكلية من خلال انحياز خط Arbitor في الوقت الفعلي.
📚 كيفية استخدام مؤشر DX Supply and Demand Pro
يُفضل استخدام هذا المؤشر كأداة تضافر، حيث يؤكد خط Arbitor قوة واتجاه الإعداد المحدد بواسطة مناطق العرض والطلب.
تضافر التداول مع خط Arbitor:
السيناريو: ارتداد منطقة الشراء 🟢
الحالة: يلامس السعر منطقة الطلب (Demand Zone).
التضافر: يقع خط Arbitor فوق المنطقة.
التفسير: يشير إلى أن انحياز صعودي (Bullish Bias) يؤكد الدعم الهيكلي. التركيز على صفقات الشراء (Long Entries).
السيناريو: ارتداد منطقة البيع 🔴
الحالة: يلامس السعر منطقة العرض (Supply Zone).
التضافر: يقع خط Arbitor أسفل المنطقة.
التفسير: يشير إلى أن انحياز هبوطي (Bearish Bias) يؤكد المقاومة الهيكلية. التركيز على صفقات البيع (Short Entries).
السيناريو: كسر الزخم ⚡
الحالة: يُغلق السعر بقوة خارج المنطقة.
التضافر: يتماشى خط Arbitor مع الكسر.
التفسير: يؤكد زخم السوق ويشير إلى أن الكسر الهيكلي صالح للاستمرار الاتجاهي.
⚙️ الإعدادات الرئيسية ودليل التحسين 🔧
إعدادات خط Arbitor (انحياز الاتجاه)
VWAP Weight (وزن VWAP): (افتراضي: 0.33) — الوزن المطبق على مكون حجم رئيسي ضمن حساب Arbitor الخاص بنا.
اقتراح للتقلب/الحجم العالي: زيادة إلى 0.40 للتأكيد على تأثير الحجم.
اقتراح للاتجاهات النظيفة: تقليل إلى 0.25 للسماح لمكونات الزخم بتحديد موقع الخط بشكل أقوى.
إعدادات مناطق العرض والطلب (المستويات الهيكلية)
HVN Volume TF (الإطار الزمني لحجم HVN): (افتراضي: D - يومي) — مُحدِد السياق الحاسم. الإطار الزمني الأعلى المستخدم للبحث عن عقد الحجم العالية (HVNs) لتأكيد قوة المنطقة.
للمضاربة اللحظية (1د-15د): استخدم 1س أو 4س للتحقق.
للتداول اليومي (30د-1س): استخدم 4س أو D. D هو الإعداد الافتراضي الموصى به.
للتداول المتأرجح (4س-يومي): استخدم W (أسبوعي).
HVN Bonus % (مكافأة HVN %): (افتراضي: 20) — تعزيز القوة المطبق على المنطقة إذا كانت تتماشى مع عقدة HVN.
Max Supply/Demand Zones (الحد الأقصى لمناطق العرض/الطلب): (افتراضي: 2) — يحد من عدد المناطق النشطة المعروضة للحفاظ على نظافة الرسم البياني.
Retest Bonus % (مكافأة إعادة الاختبار %): (افتراضي: 10) — يعزز درجة قوة المنطقة في كل مرة يتم فيها إعادة اختبارها (حتى الحد الأقصى لإعادة الاختبارات).
Time Decay Rate % (معدل الاضمحلال الزمني %): (افتراضي: 1) — يقلل من قوة المنطقة لكل 10 شمعات تبقى فيها دون كسر (المناطق القديمة تضعف).
Flip Zone on Break (قلب المنطقة عند الكسر): (افتراضي: True - صحيح) — يحول منطقة الطلب المكسورة إلى منطقة عرض (والعكس صحيح)، مما يعكس مفاهيم التحول الهيكلي.
💡 اقتراحات للمستخدمين المتقدمين 🚀
ابحث عن المناطق المقلوبة (Flipped Zones): انتبه بشكل خاص إلى المناطق التي تم كسرها وقلبها (يشار إليها بنص أصفر في التسميات). غالبًا ما تؤدي المناطق المقلوبة التي تؤكد اتجاه Arbitor إلى تحركات استمرارية ذات زخم عالٍ.
تأكيد قوة HVN: أعطِ الأولوية دائمًا لتداول المناطق ذات درجة القوة العالية (على سبيل المثال، 90% أو أعلى)، حيث يشير هذا إلى أقصى درجات التضافر بين الحجم والتقلب ومكافأة HVN.
الأطر الزمنية التكيفية: استخدم المؤشر على أطر زمنية متعددة للتأكد من توافق انحياز Arbitor مع اتجاه تداولك. إذا كان Arbitor صعوديًا على كل من الرسم البياني 5 دقائق والساعة الواحدة، تكون القناعة عالية بشكل استثنائي.
ملاحظة أخيرة: يجمع مؤشر DX S&D Pro أفضل ما في تتبع الاتجاه مع أفضل ما في التداول الهيكلي. إنه جيد جدًا، لدرجة أننا نطلق عليه اسم Arbitor لأنه يحسم الجدل بين المشترين والبائعين... حتى الشمعة التالية بالطبع! 😉
دعواتكم 🙏.
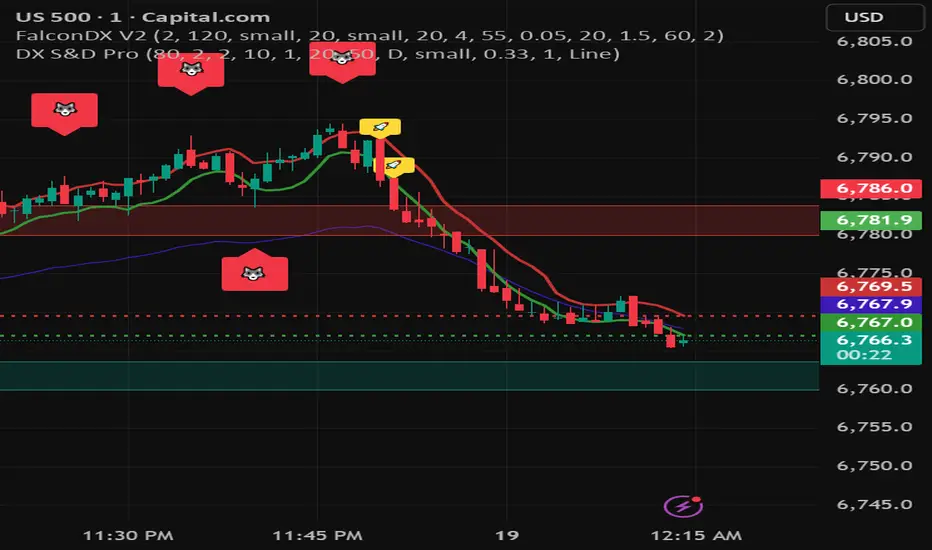
DX Supply and Demand Pro💎 DX Supply and Demand Pro: Adaptive Line and Zone Mastery
The DX Supply and Demand Pro indicator is an advanced, hybrid trading tool engineered for precision and context. It seamlessly integrates the proprietary Arbitor Line with dynamic, volume-weighted Supply and Demand Zones. This unique combination provides traders with a clear, adaptive view of both the current trend bias and critical structural price levels.
⚠️ Critical Trading Disclaimer 🛑
Trading is highly speculative and carries a substantial risk of loss. The use of this indicator does not guarantee profits, and you may lose more than your initial capital. Before using this tool in a live trading environment, you must test its performance thoroughly using paper trading or a simulated account.
Why Traders Need the DX S&D Pro 🎯
Proprietary Adaptive Intelligence: The Arbitor Line is a calculated price anchor derived from a complex, undisclosed combination of multiple market factors and proprietary equations. It automatically adjusts its sensitivity based on the chart's timeframe, effectively filtering out market noise to present an accurate, weighted average of the prevailing market bias.
Structural Clarity: It detects high-probability Supply and Demand Zones using pivot points, filtering them for strength based on volume, ATR (volatility), and High Volume Node (HVN) confirmation from a higher timeframe.
Actionable Confluence: The indicator combines dynamic trend bias (the Arbitor Line) with static structural levels (S&D Zones). This allows traders to identify high-conviction setups where the structural turning point is confirmed by the real-time bias of the Arbitor Line.
Feedback & Accountability 🤝
This indicator is provided "as is" and its performance is based on the parameters set by the user. Any suggestions or comments from users regarding performance, bugs, or feature requests should be directed to the developer here or X @Falcondxeye. The developer assumes no liability for trading losses incurred using this tool.
📚 How to Use DX Supply and Demand Pro
This indicator is best used as a confluence tool, where the Arbitor Line confirms the strength and direction of the setup identified by the Supply/Demand Zones.
Trading Confluence with the Arbitor Line:
Scenario: Buy Zone Rejection 🟢
Condition: Price touches a Demand Zone.
Confluence: The Arbitor Line is Above the zone.
Interpretation: Indicates a Bullish Bias is confirming the structural support. Focus on long entries.
Scenario: Sell Zone Rejection 🔴
Condition: Price touches a Supply Zone.
Confluence: The Arbitor Line is Below the zone.
Interpretation: Indicates a Bearish Bias is confirming the structural resistance. Focus on short entries.
Scenario: Momentum Break ⚡
Condition: Price Closes strongly beyond a zone.
Confluence: The Arbitor Line is Aligned with the Break.
Interpretation: Confirms market momentum and suggests the structural break is valid for directional continuation.
⚙️ Key Settings and Optimization Guide 🔧
Arbitor Line Settings (Trend Bias):
VWAP Weight: (Default: 0.33) — The weight applied to a key volume component within the proprietary Arbitor calculation.
Suggestion for High Volatility/Volume: Increase to 0.40 to emphasize volume's influence.
Suggestion for Clean Trends: Decrease to 0.25 to allow momentum components to dictate the line's position.
Supply & Demand Zone Settings (Structural Levels)
HVN Volume TF: (Default: D - Daily) — Crucial Context Setter. The higher timeframe used to look for High Volume Nodes (HVNs) to confirm zone strength.
For Scalping (1m-15m): Use 1H or 4H for validation.
For Day Trading (30m-1H): Use 4H or D. D is the recommended default.
For Swing Trading (4H-Daily): Use W (Weekly).
HVN Bonus %: (Default: 20) — The strength boost applied to a zone if it aligns with an HVN.
Max Supply/Demand Zones: (Default: 2) — Limits the number of active, displayed zones to keep the chart clean.
Retest Bonus %: (Default: 10) — Boosts a zone's strength score each time it is retested (up to max retests).
Time Decay Rate %: (Default: 1) — Reduces a zone's strength for every 10 bars it remains unbroken (stale zones weaken).
Flip Zone on Break: (Default: True) — Turns a broken Demand Zone into a Supply Zone (and vice versa), reflecting structural flip concepts.
💡 Suggestions for Power Users 🚀
Look for Flipped Zones: Pay attention to zones that have been broken and flipped (indicated by yellow text in the labels). Flipped zones that confirm the Arbitor direction often lead to high-momentum continuation moves.
Confirm HVN Strength: Always prioritize trading zones with a high strength score (e.g., 90% or higher), as this indicates maximum confluence of Volume, Volatility, and the HVN Bonus.
Adaptive Timeframes: Use the indicator on multiple timeframes to ensure the Arbitor bias aligns with your trade direction. If the Arbitor is bullish on both the 5-minute and the 1-hour chart, the conviction is exceptionally high.
Final Note: The DX S&D Pro combines the best of trend following with the best of structural trading. It's so good, we call it the Arbitor because it settles the arguments between buyers and sellers... until the next bar, of course! 😉
....................................................................................
💎 مؤشر DX Supply and Demand Pro: خط التكيّف وإتقان المناطق ✨
مؤشر DX Supply and Demand Pro هو أداة تداول هجينة ومتقدمة مصممة للدقة والسياق. إنه يدمج بسلاسة خط Arbitor الخاص بنا مع مناطق العرض والطلب الديناميكية المرجحة بالحجم. يوفر هذا المزيج الفريد للمتداولين رؤية واضحة ومتكيفة لكل من انحياز الاتجاه الحالي ومستويات الأسعار الهيكلية (Structural Price Levels) الحرجة.
⚠️ إخلاء مسؤولية حاسم بشأن التداول 🛑
التداول ينطوي على مخاطرة عالية للغاية ويحمل مخاطر خسارة كبيرة. استخدام هذا المؤشر لا يضمن الأرباح، وقد تخسر أكثر من رأس مالك الأولي. قبل استخدام هذه الأداة في بيئة تداول حقيقية، يجب عليك اختبار أدائها بشكل شامل باستخدام التداول الورقي (Paper Trading) أو حساب محاكاة.
لماذا يحتاج المتداولون إلى مؤشر DX S&D Pro 🎯
ذكاء تكيّفي خاص (Proprietary Adaptive Intelligence): خط Arbitor هو مرساة سعر محسوبة مشتقة من تركيبة معقدة وغير معلنة من عوامل سوق متعددة ومعادلات خاصة. يقوم بضبط حساسيته تلقائيًا بناءً على الإطار الزمني للرسم البياني، مما يزيل ضوضاء السوق بشكل فعال لتقديم متوسط مرجح ودقيق للانحياز السائد في السوق.
وضوح هيكلي (Structural Clarity): يكتشف مناطق العرض والطلب ذات الاحتمالية العالية باستخدام نقاط التحول (Pivot Points)، ويقوم بترشيحها وتحديد قوتها بناءً على الحجم، ATR (التقلب)، وتأكيد من عقدة الحجم العالية (HVN) من إطار زمني أعلى.
تضافر قابل للتطبيق (Actionable Confluence): يجمع المؤشر بين انحياز الاتجاه الديناميكي (خط Arbitor) ومستويات الهيكل الثابتة (مناطق العرض والطلب). يتيح ذلك للمتداولين تحديد إعدادات ذات قناعة عالية حيث يتم تأكيد نقطة التحول الهيكلية من خلال انحياز خط Arbitor في الوقت الفعلي.
الملاحظات والمساءلة 🤝
يتم توفير هذا المؤشر "كما هو" ويستند أدائه إلى الاعدادات التي يحددها المستخدم. يجب توجيه أي اقتراحات أو تعليقات من المستخدمين بخصوص الأداء أو الأخطاء أو طلبات الميزات إلى المطور هنا أو على X @Falcondxeye. لا يتحمل المطور أي مسؤولية عن خسائر التداول المتكبدة باستخدام هذه الأداة.
📚 كيفية استخدام مؤشر DX Supply and Demand Pro
يُفضل استخدام هذا المؤشر كأداة تضافر، حيث يؤكد خط Arbitor قوة واتجاه الإعداد المحدد بواسطة مناطق العرض والطلب.
تضافر التداول مع خط Arbitor:
السيناريو: ارتداد منطقة الشراء 🟢
الحالة: يلامس السعر منطقة الطلب (Demand Zone).
التضافر: يقع خط Arbitor فوق المنطقة.
التفسير: يشير إلى أن انحياز صعودي (Bullish Bias) يؤكد الدعم الهيكلي. التركيز على صفقات الشراء (Long Entries).
السيناريو: ارتداد منطقة البيع 🔴
الحالة: يلامس السعر منطقة العرض (Supply Zone).
التضافر: يقع خط Arbitor أسفل المنطقة.
التفسير: يشير إلى أن انحياز هبوطي (Bearish Bias) يؤكد المقاومة الهيكلية. التركيز على صفقات البيع (Short Entries).
السيناريو: كسر الزخم ⚡
الحالة: يُغلق السعر بقوة خارج المنطقة.
التضافر: يتماشى خط Arbitor مع الكسر.
التفسير: يؤكد زخم السوق ويشير إلى أن الكسر الهيكلي صالح للاستمرار الاتجاهي.
⚙️ الإعدادات الرئيسية ودليل التحسين 🔧
إعدادات خط Arbitor (انحياز الاتجاه)
VWAP Weight (وزن VWAP): (افتراضي: 0.33) — الوزن المطبق على مكون حجم رئيسي ضمن حساب Arbitor الخاص بنا.
اقتراح للتقلب/الحجم العالي: زيادة إلى 0.40 للتأكيد على تأثير الحجم.
اقتراح للاتجاهات النظيفة: تقليل إلى 0.25 للسماح لمكونات الزخم بتحديد موقع الخط بشكل أقوى.
إعدادات مناطق العرض والطلب (المستويات الهيكلية)
HVN Volume TF (الإطار الزمني لحجم HVN): (افتراضي: D - يومي) — مُحدِد السياق الحاسم. الإطار الزمني الأعلى المستخدم للبحث عن عقد الحجم العالية (HVNs) لتأكيد قوة المنطقة.
للمضاربة اللحظية (1د-15د): استخدم 1س أو 4س للتحقق.
للتداول اليومي (30د-1س): استخدم 4س أو D. D هو الإعداد الافتراضي الموصى به.
للتداول المتأرجح (4س-يومي): استخدم W (أسبوعي).
HVN Bonus % (مكافأة HVN %): (افتراضي: 20) — تعزيز القوة المطبق على المنطقة إذا كانت تتماشى مع عقدة HVN.
Max Supply/Demand Zones (الحد الأقصى لمناطق العرض/الطلب): (افتراضي: 2) — يحد من عدد المناطق النشطة المعروضة للحفاظ على نظافة الرسم البياني.
Retest Bonus % (مكافأة إعادة الاختبار %): (افتراضي: 10) — يعزز درجة قوة المنطقة في كل مرة يتم فيها إعادة اختبارها (حتى الحد الأقصى لإعادة الاختبارات).
Time Decay Rate % (معدل الاضمحلال الزمني %): (افتراضي: 1) — يقلل من قوة المنطقة لكل 10 شمعات تبقى فيها دون كسر (المناطق القديمة تضعف).
Flip Zone on Break (قلب المنطقة عند الكسر): (افتراضي: True - صحيح) — يحول منطقة الطلب المكسورة إلى منطقة عرض (والعكس صحيح)، مما يعكس مفاهيم التحول الهيكلي.
💡 اقتراحات للمستخدمين المتقدمين 🚀
ابحث عن المناطق المقلوبة (Flipped Zones): انتبه بشكل خاص إلى المناطق التي تم كسرها وقلبها (يشار إليها بنص أصفر في التسميات). غالبًا ما تؤدي المناطق المقلوبة التي تؤكد اتجاه Arbitor إلى تحركات استمرارية ذات زخم عالٍ.
تأكيد قوة HVN: أعطِ الأولوية دائمًا لتداول المناطق ذات درجة القوة العالية (على سبيل المثال، 90% أو أعلى)، حيث يشير هذا إلى أقصى درجات التضافر بين الحجم والتقلب ومكافأة HVN.
الأطر الزمنية التكيفية: استخدم المؤشر على أطر زمنية متعددة للتأكد من توافق انحياز Arbitor مع اتجاه تداولك. إذا كان Arbitor صعوديًا على كل من الرسم البياني 5 دقائق والساعة الواحدة، تكون القناعة عالية بشكل استثنائي.
ملاحظة أخيرة: يجمع مؤشر DX S&D Pro أفضل ما في تتبع الاتجاه مع أفضل ما في التداول الهيكلي. إنه جيد جدًا، لدرجة أننا نطلق عليه اسم Arbitor لأنه يحسم الجدل بين المشترين والبائعين... حتى الشمعة التالية بالطبع! 😉
دعواتكم 🙏..

Latent Energy Reactor [The_lurker]Latent Energy Reactor | مفاعل الطاقة الكامنة
═════════════════════════════════════════════════════════════
🔬 THE PHILOSOPHY
═════════════════════════════════════════════════════════════
Markets operate in cycles of compression and expansion. Before every significant price movement, there exists a period where buyers and sellers reach a temporary equilibrium — a consolidation zone where energy accumulates like pressure building in a reactor.
The Latent Energy Reactor was designed to identify these critical zones, measure the energy building within them, and predict the direction of the inevitable breakout.
This indicator transforms the abstract concept of "market energy" into a quantifiable, visual system that traders can use to anticipate high-probability breakout opportunities.
═════════════════════════════════════════════════════════════
🎯 THE THREE BOX STATES
═════════════════════════════════════════════════════════════
Understanding the three box states is crucial for proper interpretation:
📦 STATE 1: ACTIVE ZONE (GRAY BOX)
─────────────────────────────────────
Visual Characteristics:
• Color: Gray/Neutral with 3D depth effect
• Extends to the right edge of the chart (future projection)
• Contains pressure lines (dotted horizontal lines inside)
• Displays gravity center line (dashed line showing volume-weighted center)
• Energy progress bar beneath the box
• Real-time information panel appears on screen
What It Means:
The gray box represents a LIVE consolidation zone currently forming. Price is contained within the boundaries, and energy is actively accumulating. This is the "waiting phase" where the reactor is charging.
What to Watch:
• Energy percentage climbing toward critical levels (80%+)
• Gravity center position (upper half = bullish bias, lower half = bearish bias)
• Top and bottom rejection counts in the information panel
• Phase progression (Forming → Growth → Mature → Exhaustion)
Trading Approach:
Do NOT trade inside the gray box. This is the preparation phase. Monitor the energy levels and predicted direction, but wait for confirmation.
📦 STATE 2: BULLISH BREAKOUT BOX (GREEN BOX)
─────────────────────────────────────────────
Visual Characteristics:
• Color: Green with 3D depth effect
• Box boundaries are now fixed (no longer extending right)
• Displays "BUY" text centered inside the box
• Stop Loss line appears below the box (orange)
• Three Take Profit lines appear above (teal/cyan)
• Entry line at the box's upper boundary (white dashed)
What It Means:
The green box indicates a CONFIRMED bullish breakout. Price has broken above the consolidation zone's upper boundary, releasing the accumulated energy upward.
Automatic Calculations Displayed:
• Entry Price: Upper boundary of the box
• Stop Loss: Lower boundary minus ATR buffer
• TP1: Entry + (Risk × 1.0) — 1:1 reward ratio
• TP2: Entry + (Risk × 1.5) — 1.5:1 reward ratio
• TP3: Entry + (Risk × 2.0) — 2:1 reward ratio
Trading Approach:
Consider long positions with the displayed SL/TP levels as guidelines. The higher the energy level and breakout quality score were before the breakout, the more reliable the signal.
📦 STATE 3: BEARISH BREAKOUT BOX (RED BOX)
──────────────────────────────────────────
Visual Characteristics:
• Color: Red with 3D depth effect
• Box boundaries are now fixed
• Displays "SELL" text centered inside the box
• Stop Loss line appears above the box (orange)
• Three Take Profit lines appear below (teal/cyan)
• Entry line at the box's lower boundary (white dashed)
What It Means:
The red box indicates a CONFIRMED bearish breakout. Price has broken below the consolidation zone's lower boundary, releasing the accumulated energy downward.
Automatic Calculations Displayed:
• Entry Price: Lower boundary of the box
• Stop Loss: Upper boundary plus ATR buffer
• TP1: Entry - (Risk × 1.0) — 1:1 reward ratio
• TP2: Entry - (Risk × 1.5) — 1.5:1 reward ratio
• TP3: Entry - (Risk × 2.0) — 2:1 reward ratio
Trading Approach:
Consider short positions with the displayed SL/TP levels as guidelines. Stronger setups have higher pre-breakout energy and quality scores.
═════════════════════════════════════════════════════════════
⚛️ THE ENERGY CALCULATION SYSTEM
═════════════════════════════════════════════════════════════
The energy percentage (0-100%) is calculated using four factors:
Compression Score (up to 40 points)
Measures how tight the range is relative to normal volatility (ATR). Tighter compression = higher energy storage.
Time Score (up to 35 points)
Longer consolidation periods accumulate more energy. Each bar adds to the score up to the maximum.
Maturity Bonus (up to 15 points)
Zones that reach mature phases receive bonus energy points, recognizing that extended consolidations often produce more powerful breakouts.
Tightness Bonus (up to 10 points)
Extra points awarded when the range height is exceptionally small relative to ATR.
═════════════════════════════════════════════════════════════
📊 THE GRAVITY CENTER SYSTEM
═════════════════════════════════════════════════════════════
How It Works:
The gravity center is the volume-weighted average price within the consolidation zone. It reveals where the majority of trading activity (and thus institutional interest) is concentrated.
Interpretation:
• Gravity center in UPPER half → Institutions accumulating → Bullish bias
• Gravity center in LOWER half → Institutions distributing → Bearish bias
• Gravity center at MIDDLE → Neutral/Uncertain
Visual Display:
A dashed line with a ⚖️ symbol marks the gravity center inside active zones. The line color matches the directional bias.
═════════════════════════════════════════════════════════════
🏦 INSTITUTIONAL FOOTPRINT DETECTION
═════════════════════════════════════════════════════════════
What It Measures:
The indicator scans for volume anomalies — bars where volume significantly exceeds the average while price remains contained within the zone.
Why It Matters:
Large volume without price movement often indicates institutional players building positions. They cannot accumulate or distribute large quantities without leaving a "footprint" in the volume data.
Score Interpretation:
• Below 30%: Normal retail activity
• 30-50%: Some institutional interest detected
• Above 50%: Significant institutional footprint (marked with 🏦 icon)
═════════════════════════════════════════════════════════════
📈 MATURITY PHASES
═════════════════════════════════════════════════════════════
⚒ Forming Phase
The zone has just been identified. Energy is low, and the pattern needs more time to develop. Premature breakouts during this phase have higher failure rates.
📈 Growth Phase
The zone is developing nicely. Energy is building, and the consolidation pattern is becoming more defined. Watch for increasing rejection counts at boundaries.
✅ Mature Phase
Optimal trading phase. The zone has accumulated significant energy, institutional footprints are often visible, and breakout quality scores are typically highest.
⚠ Exhaustion Phase
The zone has persisted beyond typical duration. While energy remains high, the pattern may be losing its predictive power.
═════════════════════════════════════════════════════════════
🎨 VISUAL ELEMENTS GUIDE
═════════════════════════════════════════════════════════════
3D Box Effect
The 3D rendering creates visual depth with a top face and side face, making boxes stand out clearly. Adjustable via "3D Depth" and "3D Height %" settings.
Pressure Lines
Dotted horizontal lines inside active zones visualize internal pressure distribution. Lines closer to the gravity center are more opaque.
Energy Progress Bar
A horizontal bar beneath each zone shows energy level visually. Color progresses: green (low) → yellow (moderate) → orange (high) → red (critical).
Imminent Breakout Warning
When energy reaches critical threshold (default 80%), a warning label "⚠ IMMINENT!" appears above the active zone.
Information Panel
Real-time table displaying: Energy Level, Phase, Prediction, Breakout Quality, Institutional Footprint, Top/Bottom Rejections.
═════════════════════════════════════════════════════════════
📊 READING THE SIGNALS
═════════════════════════════════════════════════════════════
Energy Levels:
• Below 40%: Low energy — breakout unlikely soon
• 40-60%: Moderate energy — zone developing
• 60-80%: High energy — prepare for potential breakout
• Above 80%: Critical energy — breakout imminent
Breakout Quality Score:
• Below 50%: Weak setup — higher false breakout risk
• 50-70%: Moderate setup — proceed with caution
• Above 70%: Strong setup — high probability trade
Direction Confidence:
• Below 55%: Neutral — wait for clearer signals
• 55-70%: Moderate confidence
• Above 70%: High confidence prediction
═════════════════════════════════════════════════════════════
⚙️ RECOMMENDED SETTINGS
═════════════════════════════════════════════════════════════
For Scalping (1-15 min):
Min Bars in Range: 10-15 | ATR Period: 10 | Range ATR Multiplier: 2.0
For Day Trading (15min-1H):
Min Bars in Range: 15-20 | ATR Period: 14 | Range ATR Multiplier: 2.5
For Swing Trading (4H-Daily):
Min Bars in Range: 20-30 | ATR Period: 20 | Range ATR Multiplier: 3.0
═════════════════════════════════════════════════════════════
🔔 ALERTS
═════════════════════════════════════════════════════════════
• New Zone Alert: Triggers when a new consolidation zone is identified
• Imminent Breakout Alert: Triggers when energy reaches critical levels
• Bullish Breakout Alert: Triggers on confirmed bullish breakout
• Bearish Breakout Alert: Triggers on confirmed bearish breakout
═════════════════════════════════════════════════════════════
⚠️ DISCLAIMER
═════════════════════════════════════════════════════════════
This indicator is designed as a technical analysis tool to identify consolidation patterns and anticipate potential breakout directions. No indicator can predict the future with certainty. The displayed SL/TP levels are suggestions based on mathematical calculations, not guarantees.
This indicator is for educational and analytical purposes only. It does not constitute financial, investment, or trading advice. Use it in conjunction with your own strategy and risk management. Neither TradingView nor the developer is liable for any financial decisions or losses.
═════════════════════════════════════════════════════════════
═════════════════════════════════════════════════════════════
مفاعل الطاقة الكامنة | Latent Energy Reactor
🔬 الفلسفة
═════════════════════════════════════════════════════════════
تعمل الأسواق في دورات من الضغط والتمدد. قبل كل حركة سعرية كبيرة، توجد فترة يصل فيها المشترون والبائعون إلى توازن مؤقت — منطقة تجميع حيث تتراكم الطاقة مثل الضغط المتراكم في مفاعل.
صُمم مفاعل الطاقة الكامنة لتحديد هذه المناطق الحرجة، وقياس الطاقة المتراكمة داخلها، والتنبؤ باتجاه الاختراق الحتمي.
يحوّل هذا المؤشر المفهوم المجرد لـ "طاقة السوق" إلى نظام قابل للقياس والعرض البصري يمكن للمتداولين استخدامه لتوقع فرص الاختراق عالية الاحتمالية.
═════════════════════════════════════════════════════════════
🎯 حالات الصندوق الثلاث
═════════════════════════════════════════════════════════════
فهم حالات الصندوق الثلاث ضروري للتفسير الصحيح:
📦 الحالة الأولى: المنطقة النشطة (الصندوق الرمادي)
─────────────────────────────────────────────────────
الخصائص البصرية:
• اللون: رمادي/محايد مع تأثير عمق ثلاثي الأبعاد
• يمتد إلى الحافة اليمنى للرسم البياني (إسقاط مستقبلي)
• يحتوي على خطوط الضغط (خطوط أفقية منقطة بالداخل)
• يعرض خط مركز الثقل (خط متقطع يُظهر المركز المرجح بالحجم)
• شريط تقدم الطاقة أسفل الصندوق
• تظهر لوحة المعلومات الفورية على الشاشة
ماذا يعني:
الصندوق الرمادي يمثل منطقة تجميع حَيّة تتشكل حالياً. السعر محتوى داخل الحدود، والطاقة تتراكم بنشاط. هذه هي "مرحلة الانتظار" حيث المفاعل يشحن.
ما يجب مراقبته:
• نسبة الطاقة تصعد نحو المستويات الحرجة (80%+)
• موقع مركز الثقل (النصف العلوي = ميل صعودي، النصف السفلي = ميل هبوطي)
• عدد الرفض العلوي والسفلي في لوحة المعلومات
• تقدم المرحلة (تشكّل ← نمو ← نضج ← إرهاق)
نهج التداول:
لا تتداول داخل الصندوق الرمادي. هذه مرحلة الإعداد. راقب مستويات الطاقة والاتجاه المتوقع، لكن انتظر التأكيد.
📦 الحالة الثانية: صندوق الاختراق الصعودي (الصندوق الأخضر)
─────────────────────────────────────────────────────────────
الخصائص البصرية:
• اللون: أخضر مع تأثير عمق ثلاثي الأبعاد
• حدود الصندوق ثابتة الآن (لم تعد تمتد لليمين)
• يعرض نص "شراء" أو "BUY" في منتصف الصندوق
• يظهر خط وقف الخسارة أسفل الصندوق (برتقالي)
• تظهر ثلاثة خطوط أهداف فوق الصندوق (فيروزي)
• خط الدخول عند الحد العلوي للصندوق (أبيض متقطع)
ماذا يعني:
الصندوق الأخضر يشير إلى اختراق صعودي مُؤَكَّد. كسر السعر فوق الحد العلوي لمنطقة التجميع، محرراً الطاقة المتراكمة للأعلى.
الحسابات التلقائية المعروضة:
• سعر الدخول: الحد العلوي للصندوق
• وقف الخسارة: الحد السفلي ناقص حاجز ATR
• الهدف 1: الدخول + (المخاطرة × 1.0) — نسبة مكافأة 1:1
• الهدف 2: الدخول + (المخاطرة × 1.5) — نسبة مكافأة 1.5:1
• الهدف 3: الدخول + (المخاطرة × 2.0) — نسبة مكافأة 2:1
نهج التداول:
فكر في صفقات شراء مع مستويات وقف الخسارة والأهداف المعروضة كإرشادات. كلما ارتفع مستوى الطاقة ودرجة جودة الاختراق قبل الكسر، كانت الإشارة أكثر موثوقية.
📦 الحالة الثالثة: صندوق الاختراق الهبوطي (الصندوق الأحمر)
─────────────────────────────────────────────────────────────
الخصائص البصرية:
• اللون: أحمر مع تأثير عمق ثلاثي الأبعاد
• حدود الصندوق ثابتة الآن
• يعرض نص "بيع" أو "SELL" في منتصف الصندوق
• يظهر خط وقف الخسارة فوق الصندوق (برتقالي)
• تظهر ثلاثة خطوط أهداف أسفل الصندوق (فيروزي)
• خط الدخول عند الحد السفلي للصندوق (أبيض متقطع)
ماذا يعني:
الصندوق الأحمر يشير إلى اختراق هبوطي مُؤَكَّد. كسر السعر تحت الحد السفلي لمنطقة التجميع، محرراً الطاقة المتراكمة للأسفل.
الحسابات التلقائية المعروضة:
• سعر الدخول: الحد السفلي للصندوق
• وقف الخسارة: الحد العلوي زائد حاجز ATR
• الهدف 1: الدخول - (المخاطرة × 1.0) — نسبة مكافأة 1:1
• الهدف 2: الدخول - (المخاطرة × 1.5) — نسبة مكافأة 1.5:1
• الهدف 3: الدخول - (المخاطرة × 2.0) — نسبة مكافأة 2:1
نهج التداول:
فكر في صفقات بيع مع مستويات وقف الخسارة والأهداف المعروضة كإرشادات. الإعدادات الأقوى لديها طاقة ودرجات جودة أعلى قبل الاختراق.
═════════════════════════════════════════════════════════════
⚛️ نظام حساب الطاقة
═════════════════════════════════════════════════════════════
تُحسب نسبة الطاقة (0-100%) باستخدام أربعة عوامل:
درجة الضغط (حتى 40 نقطة)
تقيس مدى ضيق النطاق نسبة للتقلب الطبيعي (ATR). ضغط أشد = تخزين طاقة أعلى.
درجة الوقت (حتى 35 نقطة)
فترات التجميع الأطول تراكم طاقة أكثر. كل شمعة تضيف للدرجة حتى الحد الأقصى.
مكافأة النضج (حتى 15 نقطة)
المناطق التي تصل لمراحل النضج تحصل على نقاط طاقة إضافية، اعترافاً بأن التجميعات الممتدة غالباً تنتج اختراقات أقوى.
مكافأة الضيق (حتى 10 نقاط)
نقاط إضافية تُمنح عندما يكون ارتفاع النطاق صغيراً استثنائياً نسبة لـ ATR.
═════════════════════════════════════════════════════════════
📊 نظام مركز الثقل
═════════════════════════════════════════════════════════════
كيف يعمل:
مركز الثقل هو متوسط السعر المرجح بالحجم داخل منطقة التجميع. يكشف أين يتركز معظم النشاط التداولي (وبالتالي الاهتمام المؤسسي).
التفسير:
• مركز الثقل في النصف العلوي ← المؤسسات تجمّع ← ميل صعودي
• مركز الثقل في النصف السفلي ← المؤسسات توزّع ← ميل هبوطي
• مركز الثقل في المنتصف ← محايد/غير مؤكد
العرض البصري:
خط متقطع مع رمز ⚖️ يحدد مركز الثقل داخل المناطق النشطة. لون الخط يطابق الميل الاتجاهي.
═════════════════════════════════════════════════════════════
🏦 كشف البصمة المؤسسية
═════════════════════════════════════════════════════════════
ما يقيسه:
يفحص المؤشر الشذوذات الحجمية — شموع حجمها يتجاوز المتوسط بشكل كبير بينما يبقى السعر محتوى داخل المنطقة.
لماذا هذا مهم:
الحجم الكبير بدون حركة سعرية غالباً يشير إلى لاعبين مؤسسيين يبنون مراكز. لا يمكنهم تجميع أو توزيع كميات كبيرة بدون ترك "بصمة" في بيانات الحجم.
تفسير الدرجة:
• أقل من 30%: نشاط تجزئة عادي
• 30-50%: بعض الاهتمام المؤسسي مكتشف
• فوق 50%: بصمة مؤسسية كبيرة (تُحدد بأيقونة 🏦)
═════════════════════════════════════════════════════════════
📈 مراحل النضج
═════════════════════════════════════════════════════════════
⚒ مرحلة التشكّل
المنطقة تم تحديدها للتو. الطاقة منخفضة، والنمط يحتاج وقتاً أكثر للتطور. الاختراقات المبكرة خلال هذه المرحلة لديها معدلات فشل أعلى.
📈 مرحلة النمو
المنطقة تتطور بشكل جيد. الطاقة تتراكم، ونمط التجميع يصبح أكثر تحديداً. راقب زيادة عدد الرفض عند الحدود.
✅ مرحلة النضج
مرحلة التداول المثلى. المنطقة راكمت طاقة كبيرة، البصمات المؤسسية غالباً مرئية، ودرجات جودة الاختراق عادة في أعلى مستوياتها.
⚠ مرحلة الإرهاق
المنطقة استمرت أطول من المدة النموذجية. بينما تبقى الطاقة مرتفعة، قد يفقد النمط قوته التنبؤية.
═════════════════════════════════════════════════════════════
🎨 دليل العناصر البصرية
═════════════════════════════════════════════════════════════
تأثير الصندوق ثلاثي الأبعاد
العرض ثلاثي الأبعاد يخلق عمقاً بصرياً مع وجه علوي ووجه جانبي، مما يجعل الصناديق بارزة بوضوح. قابل للتعديل عبر إعدادات "عمق 3D" و"ارتفاع 3D %".
خطوط الضغط
خطوط أفقية منقطة داخل المناطق النشطة تصور توزيع الضغط الداخلي. الخطوط الأقرب لمركز الثقل أكثر وضوحاً.
شريط تقدم الطاقة
شريط أفقي أسفل كل منطقة يُظهر مستوى الطاقة بصرياً. اللون يتدرج: أخضر (منخفض) ← أصفر (متوسط) ← برتقالي (مرتفع) ← أحمر (حرج).
تحذير الاختراق الوشيك
عندما تصل الطاقة للعتبة الحرجة (افتراضياً 80%)، يظهر تحذير "⚠ كسر وشيك!" فوق المنطقة النشطة.
لوحة المعلومات
جدول فوري يعرض: مستوى الطاقة، المرحلة، التوقع، جودة الاختراق، البصمة المؤسسية، الرفض العلوي/السفلي.
═════════════════════════════════════════════════════════════
📊 قراءة الإشارات
═════════════════════════════════════════════════════════════
مستويات الطاقة:
• أقل من 40%: طاقة منخفضة — الاختراق غير مرجح قريباً
• 40-60%: طاقة متوسطة — المنطقة في طور التطور
• 60-80%: طاقة مرتفعة — استعد لاختراق محتمل
• فوق 80%: طاقة حرجة — الاختراق وشيك
درجة جودة الاختراق:
• أقل من 50%: إعداد ضعيف — خطر اختراق كاذب أعلى
• 50-70%: إعداد متوسط — تقدم بحذر
• فوق 70%: إعداد قوي — صفقة عالية الاحتمالية
ثقة الاتجاه:
• أقل من 55%: محايد — انتظر إشارات أوضح
• 55-70%: ثقة متوسطة
• فوق 70%: توقع عالي الثقة
═════════════════════════════════════════════════════════════
⚙️ الإعدادات الموصى بها
═════════════════════════════════════════════════════════════
للمضاربة السريعة (1-15 دقيقة):
الحد الأدنى للشموع: 10-15 | فترة ATR: 10 | مضاعف ATR: 2.0
للتداول اليومي (15 دقيقة - ساعة):
الحد الأدنى للشموع: 15-20 | فترة ATR: 14 | مضاعف ATR: 2.5
للتداول المتأرجح (4 ساعات - يومي):
الحد الأدنى للشموع: 20-30 | فترة ATR: 20 | مضاعف ATR: 3.0
═════════════════════════════════════════════════════════════
🔔 التنبيهات
═════════════════════════════════════════════════════════════
• تنبيه منطقة جديدة: يُفعّل عند تشكّل منطقة تجميع جديدة
• تنبيه اختراق وشيك: يُفعّل عند وصول الطاقة لمستويات حرجة
• تنبيه اختراق صعودي: يُفعّل عند تأكيد كسر صعودي
• تنبيه اختراق هبوطي: يُفعّل عند تأكيد كسر هبوطي
═════════════════════════════════════════════════════════════
⚠️ إخلاء المسؤولية
═════════════════════════════════════════════════════════════
هذا المؤشر مصمم كأداة تحليل فني لتحديد أنماط التجميع وتوقع اتجاهات الاختراق المحتملة. لا يمكن لأي مؤشر التنبؤ بالمستقبل بيقين. مستويات وقف الخسارة والأهداف المعروضة هي اقتراحات مبنية على حسابات رياضية، وليست ضمانات.
هذا المؤشر لأغراض تعليمية وتحليلية فقط. لا يُمثل نصيحة مالية أو استثمارية أو تداولية. استخدمه بالتزامن مع استراتيجيتك الخاصة وإدارة المخاطر. لا يتحمل TradingView ولا المطور مسؤولية أي قرارات مالية أو خسائر.

MSP Setup Scanner Bullish BearishIdentify High-Probability Trading Setups at a Glance
This indicator combines multiple technical factors into a single, easy-to-read score that helps you quickly identify bullish and bearish opportunities across any market.
What It Analyzes:
- Trend Direction: EMA 20/50/200 alignment and price position
- Momentum: RSI overbought/oversold levels with trend confirmation
- MACD: Crossovers and histogram direction
- Volume: Above-average volume for move confirmation
- Breakouts: New highs/lows detection
Mobile-Ready Design:
- Clean, compact table display optimized for mobile TradingView
- Color-coded bias indicator (Strong Bullish to Strong Bearish)
- Works perfectly on all screen sizes
Score System:
+40 to +100: Strong bullish setup
+1 to +39: Bullish bias
0: Neutral
-1 to -39: Bearish bias
-40 to -100: Strong bearish setup
Features:
- On-chart signals (Up Arrow Buy / Down Arrow Sell)
- Customizable alert conditions
- Works on all timeframes and instruments
- Lightweight and fast-loading
Best Used For:
- Swing trading confirmation
- Intraday momentum plays
- Screening watchlists for A+ setups
- Multi-timeframe confluence analysis
Not financial advice. Always use proper risk management.

TWT_MAHA+REVERAL🔹 TWT_MAHA + REVERSAL (Smart Money Reversal System)
TWT_MAHA + REVERSAL is a non-repainting support–resistance + price-action reversal indicator designed to catch high-probability market turning points near extremes.
It combines:
Dynamic Support & Resistance (multi-timeframe)
RSI + MACD momentum exhaustion
Smart Money concepts (Order Blocks & Liquidity grabs)
Advanced price-action patterns (pin bars, engulfing, failures)
✅ How to Use (Simple Rules)
🟢 BUY SETUP
Look for Buy signals near Support / Extreme Lows when:
RSI is oversold and starting to reverse
MACD shows loss of bearish momentum
Strong bullish price action appears (long wick, engulfing, reversal pattern)
A Bullish Order Block (OB) or Bullish SFP (liquidity grab) is printed
📌 Best entries:
First retest of a bullish OB
Strong reversal candle close near support
🔴 SELL SETUP
Look for Sell signals near Resistance / Extreme Highs when:
RSI is overbought and rolling over
MACD shows loss of bullish momentum
Strong bearish price action appears
A Bearish Order Block (OB) or Bearish SFP is printed
📌 Best entries:
First retest of a bearish OB
Rejection wick or strong bearish candle near resistance
🎯 Risk–Reward Guidance
Intraday / Scalping:
🔸 Typical RR: 1:1.5 to 1:2
Swing / Positional:
🔸 Typical RR: 1:2 to 1:4
🛑 Stop-loss:
Just beyond the OB zone or recent swing high/low
🎯 Targets:
Nearest opposing S/R
Partial at 1R, trail the rest
🧠 Key Notes
Works best on 5m, 15m, 30m for intraday
Also effective on 1H+ for swing trading
Designed to reduce noise and avoid late entries
No repainting signals
🔐 Access & Updates
This indicator is private.
📩 To get access:
👉 DM me directly on TradingView
(Serious traders only — this tool is built for education Purpose Only. Before taking any Real Trade consult your own Financial Advisor)

Reversal Score System v3 [Rulph]RSS3 - Reversal Score System v3
RSS3 is a multi-component reversal detection system that quantifies momentum exhaustion and trend weakness through a normalized Score from -1 (maximum bullish pressure) to +1 (maximum bearish pressure). It is designed to work across crypto, stocks, forex and futures, from intraday to 4H/D timeframes.
A full article with real trade examples (BTC, NVDA, GBP/USD, E-mini S&P) is available here:
How to Make 18% in a Week: RSS3 Reversal Trading Across 4 Markets
━━━━━━━━━━━━━━━━━━━━━━━━━━━━━━━━━━
CORE COMPONENTS
━━━━━━━━━━━━━━━━━━━━━━━━━━━━━━━━━━
1. Volatility Pressure Index (VPI)
VPI measures market stress using a composite of:
• RSI deviation from the neutral 50 level (directional momentum bias)
• Annualized volatility (VIX-style) to detect volatility expansion
• Normalized candle range vs recent history
• Price position relative to Bollinger Bands (statistical extension)
These inputs are weighted and normalized into a single pressure reading:
• High VPI → overbought stress zone
• Low VPI → oversold compression zone
Concept: VPI answers " Is the market stretched beyond sustainable levels? "
Example: BTC 15m bearish with high VPI before the drop
2. Trend Direction Force Index (TDFI)
TDFI measures directional trend strength using:
• Spread between a fast MMA and a slower SMMA (trend acceleration/deceleration)
• Average impulse between the two MAs (momentum persistence)
• Normalized trend strength with a weighting scheme
• Positive TDFI → bullish directional pressure
• Negative TDFI → bearish directional pressure
• Extreme values (> 0.7 or < -0.7) highlight overextended trends
Concept: TDFI answers " How strong is the current directional move, and is it overextended? "
Example: ES 4H showing strong TDFI before reversal
3. Final Score
The final Score combines VPI and TDFI with divergence bonuses:
Score = (VPI_weight × VPI) + (TDFI_weight × TDFI) - Bull_Div_Bonus + Bear_Div_Bonus
Key ideas:
• VPI and TDFI are first normalized, then combined
• Divergences modulate Score via bonuses/penalties
• Recent and stronger divergences have more influence (decaying over time)
This produces a single, continuous measure of reversal pressure from -1 to +1.
Example: Score swinging from extreme bearish to extreme bullish zones
━━━━━━━━━━━━━━━━━━━━━━━━━━━━━━━━━━
DIVERGENCES AND SEQUENTIAL LABELS
━━━━━━━━━━━━━━━━━━━━━━━━━━━━━━━━━━
RSS3 automatically detects classic divergences separately for VPI and TDFI:
• Bullish divergence: price makes a lower low, indicator makes a higher low
• Bearish divergence: price makes a higher high, indicator makes a lower high
Each divergence is tracked for:
• VPI (v-series)
• TDFI (t-series)
Sequential labeling:
• v1, v2, v3... = 1st, 2nd, 3rd VPI divergence in the current direction
• t1, t2, t3... = 1st, 2nd, 3rd TDFI divergence in the current direction
• v2t1 = double divergence (2nd VPI + 1st TDFI on the same pivot)
The sequence resets when direction changes (bullish → bearish or vice versa).
This allows you to distinguish:
• early warnings (v1/t1)
• reinforced late-stage signals (v3, v4, …)
• strong confluence (vXtY double divergences)
Example: Sequential v/t labels building up before a major reversal
━━━━━━━━━━━━━━━━━━━━━━━━━━━━━━━━━━
MULTI‑TIMEFRAME FILTER (MTF)
━━━━━━━━━━━━━━━━━━━━━━━━━━━━━━━━━━
The MTF filter uses a higher timeframe to control counter-trend entries:
Modes:
• Off – no filtering
• Reduce – divergence bonus is reduced when signal is against HTF trend
• Block – counter-trend divergences are completely hidden
Use cases:
• On intraday charts, use 4H/D as HTF to avoid shorting strong uptrends
• On 4H, use Daily/Weekly as HTF context for swing trades
This protects capital by avoiding low-probability mean-reversion attempts in strong trends.
Example: BTC 1h counter-trend signals filtered by MTF (grayed out)
━━━━━━━━━━━━━━━━━━━━━━━━━━━━━━━━━━
HOW TO USE RSS3
━━━━━━━━━━━━━━━━━━━━━━━━━━━━━━━━━━
Typical entry logic:
1. Wait for a divergence (green = bullish, red = bearish)
2. Check Score:
• |Score| > 0.5 → stronger, higher-confidence signal
• Score near ±1.0 → extreme exhaustion zone
3. Optionally wait +2 bars after divergence to confirm the pivot
Typical exits:
• Conservative: opposite divergence appears
• More aggressive: Score crosses through 0 or reaches the opposite ±0.5 zone
• Always combine with a volatility-based stop (e.g., 2–3 × ATR)
Recommended timeframes:
• 5–15m: active intraday/swing setups
• 1–4h: swing trading
• D/W: position trading
RSS3 is not a complete trading strategy. It is an advanced reversal and exhaustion engine intended to be combined with:
• support/resistance
• volume/flow tools
• existing trend or breakout systems
━━━━━━━━━━━━━━━━━━━━━━━━━━━━━━━━━━
WHAT MAKES RSS3 ORIGINAL
━━━━━━━━━━━━━━━━━━━━━━━━━━━━━━━━━━
RSS3 is not a simple mashup of standard indicators. It introduces:
• Composite volatility index (VPI) combining RSI deviation, volatility, range and Bollinger position
• Composite trend force index (TDFI) based on MA spread and impulse
• Unified Score from -1 to +1 for reversal strength
• Decay-weighted divergence bonuses with amplitude sensitivity
• Dual-source divergences (VPI + TDFI) with sequential v/t labeling
• MTF-aware filtering that can reduce or block counter-trend signals
Real trade examples and detailed commentary:
English article with 4 markets
Disclaimer: All trading involves risk. This tool does not guarantee profits. Always backtest and manage risk according to your rules.
-----------------------------------------------------------------------------------------------------------
RSS3 - Reversal Score System v3 (Система оценки разворотов)
RSS3 — это многокомпонентная система поиска разворотов, которая количественно оценивает истощение импульса и ослабление тренда через нормализованный Score от -1 (максимальное бычье давление) до +1 (максимальное медвежье давление). Индикатор рассчитан на работу с криптовалютами, акциями, форексом и фьючерсами на разных таймфреймах — от интрадей до 4H/D.
Подробная статья с реальными примерами сделок на NVTK, BTCUSDT и CNY/RUB доступна здесь:
Как заработать 18% за неделю на разворотах: система RSS3
━━━━━━━━━━━━━━━━━━━━━━━━━━━━━━━━━━
КЛЮЧЕВЫЕ КОМПОНЕНТЫ
━━━━━━━━━━━━━━━━━━━━━━━━━━━━━━━━━━
1. Volatility Pressure Index (VPI)
VPI измеряет "напряжение" рынка через комбинацию:
• отклонения RSI от нейтрального уровня 50 (направленный моментум)
• годовой волатильности (по типу VIX) — фиксирует расширение волатильности
• нормализованного диапазона свечей относительно недавней истории
• положения цены относительно полос Боллинджера (статистическое перерастяжение)
Все компоненты взвешиваются и нормализуются в единый индекс давления:
• высокий VPI → зона перекупленности и стресса
• низкий VPI → зона перепроданности и сжатия
Идея: VPI отвечает на вопрос " насколько рынок перерастянут относительно нормального состояния? ".
Пример: NVTK 1H — медвежья дивергенция VPI перед падением
2. Trend Direction Force Index (TDFI)
TDFI оценивает силу направленного движения через:
• расхождение между быстрой MMA и более медленной SMMA (ускорение/замедление тренда)
• средний импульс между двумя скользящими (устойчивость импульса)
• нормализованную силу тренда с весовой схемой
• положительный TDFI → бычье направленное давление
• отрицательный TDFI → медвежье направленное давление
• экстремальные значения (> 0.7 или < -0.7) показывают чрезмерно растянутый тренд
Идея: TDFI отвечает на вопрос " насколько силён текущий тренд и не заходит ли он слишком далеко? ".
Пример: NVTK 1h — сильный TDFI
3. Финальный Score
Финальный Score объединяет VPI и TDFI с учётом бонусов за дивергенции:
Score = (VPI_weight × VPI) + (TDFI_weight × TDFI) - Bull_Div_Bonus + Bear_Div_Bonus
Основные идеи:
• VPI и TDFI предварительно нормализуются
• дивергенции корректируют Score через бонусы/штрафы
• более свежие и сильные дивергенции дают больший вклад (с затуханием во времени)
Результат — единый непрерывный индикатор давления на разворот в диапазоне от -1 до +1.
Пример: BTCUSDT 2H — переход Score из медвежьей зоны в бычью
━━━━━━━━━━━━━━━━━━━━━━━━━━━━━━━━━━
ДИВЕРГЕНЦИИ И ПОСЛЕДОВАТЕЛЬНЫЕ МЕТКИ v/t
━━━━━━━━━━━━━━━━━━━━━━━━━━━━━━━━━━
RSS3 автоматически определяет классические дивергенции отдельно для VPI и TDFI:
• бычья дивергенция — цена делает более низкий минимум, индикатор — более высокий минимум
• медвежья дивергенция — цена делает более высокий максимум, индикатор — более низкий максимум
Для каждой дивергенции ведутся отдельные счётчики:
• для VPI — последовательность v1, v2, v3…
• для TDFI — последовательность t1, t2, t3…
Примеры маркировки:
• v1 — первая дивергенция VPI в текущем направлении
• t2 — вторая дивергенция TDFI
• v2t1 — двойная дивергенция (2‑я VPI + 1‑я TDFI на одном пивоте)
Счётчики сбрасываются при смене направления (бычья → медвежья и наоборот).
Это позволяет отличать:
• ранние сигналы-предупреждения (v1/t1)
• поздние, усиленные сигналы (v3, v4 и далее)
• зоны сильной конфлюенции (vXtY двойные дивергенции)
Пример: CNY/RUB 15m — накопление v/t меток перед разворотом
━━━━━━━━━━━━━━━━━━━━━━━━━━━━━━━━━━
МУЛЬТИ-ТАЙМФРЕЙМОВЫЙ ФИЛЬТР (MTF)
━━━━━━━━━━━━━━━━━━━━━━━━━━━━━━━━━━
MTF-фильтр использует старший таймфрейм, чтобы уменьшать или блокировать контртрендовые сигналы.
Режимы:
• Off — фильтрация отключена
• Reduce — сила дивергенции против старшего тренда уменьшается
• Block — контртрендовые дивергенции полностью скрываются
Примеры:
• на 15m/30m — использовать 4H/D как старший ТФ
• на 1H/4H — использовать Daily/Weekly для свинг-позиций
Это помогает не лезть против сильного тренда только потому, что локально появилась дивергенция.
Пример: NVTK 1H — MTF-фильтр блокирует контртрендовые сигналы (серые маркеры)
━━━━━━━━━━━━━━━━━━━━━━━━━━━━━━━━━━
КАК ИСПОЛЬЗОВАТЬ RSS3
━━━━━━━━━━━━━━━━━━━━━━━━━━━━━━━━━━
Вход:
1) дождаться дивергенции (зелёный треугольник — бычья, красный — медвежья)
2) проверить Score:
• |Score| > 0.5 усиливает значимость сигнала
• значения около ±1.0 указывают на экстремальные зоны истощения
3) при необходимости подождать +2 бара после дивергенции для подтверждения пивота
Выход:
• консервативно — по дивергенции в обратную сторону
• агрессивнее — при пересечении Score через 0 или выходе в противоположную зону ±0.5
• стоп-лосс — от волатильности (например, 2–3 × ATR)
Рекомендуемые таймфреймы:
• 5–15m — активный интрадей/свинг (подходит для CNY/RUB и других ликвидных инструментов)
• 1H — акции типа NVTK, связка с MTF-фильтром по 2H/4H
• 2H–4H — BTCUSDT и фьючерсы для свинг-позиций
RSS3 — это не готовая стратегия, а продвинутый модуль поиска разворотов и зон истощения, который лучше всего работает в связке:
• с уровнями поддержки/сопротивления,
• объёмными/ордерфлоу-индикаторами,
• трендовыми и пробойными системами.
━━━━━━━━━━━━━━━━━━━━━━━━━━━━━━━━━━
ЧТО ДЕЛАЕТ RSS3 ОРИГИНАЛЬНЫМ
━━━━━━━━━━━━━━━━━━━━━━━━━━━━━━━━━━
RSS3 — это не просто "микс" стандартных индикаторов. В нём реализованы:
• составной волатильностный индекс VPI (RSI-отклонение, волатильность, диапазон, полосы Боллинджера)
• составной трендовый индекс TDFI (спред и импульс между скользящими средними)
• единый Score от -1 до +1 для оценки силы разворота
• бонусы за дивергенции с учётом амплитуды и затухания во времени
• двойные дивергенции (VPI + TDFI) с последовательной маркировкой v/t
• MTF-фильтр, который может ослаблять или полностью блокировать контртрендовые сигналы
Детальные примеры сделок на NVTK, BTCUSDT и CNY/RUB:
Русская статья по RSS3
Дисклеймер: Торговля на финансовых рынках связана с риском. Индикатор не гарантирует доходности. Всегда тестируйте и соблюдайте собственные правила риск-менеджмента.

SAYO Zones📄 Description
🔹 SAYO Zones is a clean and objective trading tool designed for swing traders and day traders, suitable for stocks, crypto, and futures markets.
🔹 The indicator automatically maps dynamic Fibonacci-based price zones and combines them with momentum timing to help traders focus only on high-quality areas of interest.
🔹 It works on all timeframes, from intraday charts to higher timeframe swing setups.
🔹 This tool is not a signal generator by itself. 🔹 It is a decision-support indicator built to improve clarity, patience, and execution.
🔍 What SAYO Zones Does
🔹 Automatically calculates dynamic Fibonacci ranges 🔹 Highlights key price zones where reactions are statistically more likely 🔹 Filters out low-quality trades by identifying no-trade (blue) zones 🔹 Combines WaveTrend structure with Stochastic momentum for timing 🔹 Designed to work on all markets and all timeframes, including futures
🎯 Core Concept
🔹 Markets move in ranges. 🔹 Not every level is worth trading.
🔹 SAYO Zones helps you: 🔹 Focus only on meaningful price areas 🔹 Avoid entries inside low-probability zones 🔹 Align structure and momentum for better entries 🔹 The goal is clarity over frequency.
🧭 How to Use
🔹 SAYO Zones is built as an advanced trading methodology, while remaining clear and accessible for beginners. 🔹 The indicator provides visual arrows when specific structural and momentum conditions align.
🔹 How to approach a trade: 🔹 Wait for price to reach a meaningful zone 🔹 Avoid trades inside blue zones 🔹 When an arrow appears, it signals that structure and momentum are aligned 🔹 Use momentum confirmation to validate the setup
🔹 Once confirmed: 🔹 Define your stop loss based on structure or zone boundaries 🔹 Define your take profit according to your risk-to-reward plan 🔹 Execute the trade based on your strategy rules
🔹 The arrows are not meant to be followed blindly. 🔹 They are execution signals designed to help you act only when conditions are favorable. 🔹 This approach encourages discipline, patience, and structured risk management.
📈 Best Use Cases
🔹 Swing trading stocks 🔹 Day trading stocks 🔹 Swing trading crypto 🔹 Day trading crypto 🔹 Futures trading (index, commodities, and crypto futures) 🔹 All timeframes: 5m, 15m, 1H, 4H, Daily 🔹 Range, pullback, and structure-based strategies
⚠️ Important Notes
🔹 SAYO Zones is not a buy or sell guarantee 🔹 No indicator predicts the future 🔹 Always apply proper risk management 🔹 Best results come from combining this tool with a complete trading plan
🧠 Why SAYO Zones
🔹 Most indicators show too much information. 🔹 SAYO Zones is designed to show only what matters. 🔹 Whether you are a beginner learning structured trading, or an advanced trader refining execution, this tool helps you trade with more confidence and consistency.
🔔 Alerts
🔹 Custom alerts are included to notify you when potential conditions align, allowing you to stay focused without watching the chart continuously.
📌 Final Thought
🔹 SAYO Zones is not about trading more. 🔹 It is about trading better.
