Entry Assistant & News AlertIntention Of This Indicator
This indicator is intended to be used as an assistant in combination with a technical strategy.
This indicator has several functions intended to assist you at entering positions.
This indicator is intended to be used with strategies that place Stop Losses above / below candles, and entries at the BOC ( Break Of The Previous Candle , For Longs it is when price goes above the previous candles high, For Shorts it is when price goes below the previous candles low)
This indicator allows you to enter daily news release times, and it will warn you before and after that news release time ( to help you stay out of trading news )
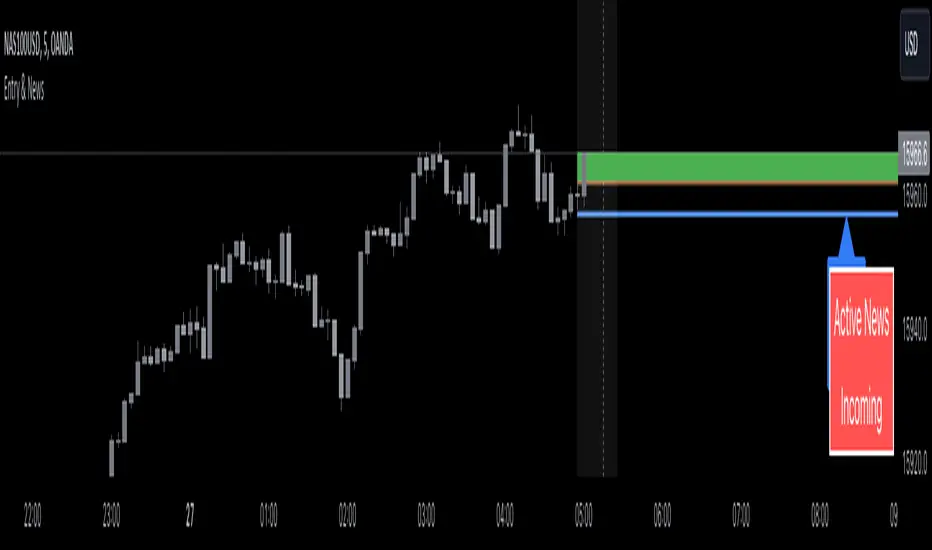
This indicator Draw / Displays the following
A line below ( for Longs ) / above ( for Shorts ) the current candle, with an additional pip value for extra space ( this displays where to place your Stop Loss )
A label displaying the price of the Stop Loss line, to assist in placing the Stop Loss
A line displaying where the BOC is ( based off of going Long or going Short )
A box that appears when the BOC has occurred ( entry signal )
A line displaying where the news release is going to happen ( only according to your time input settings )
A box that surrounds the news release ( only according to your time input settings )
A table in the bottom right corner that shows you when there is Active News ( only according to your time input settings )
Inputs
Inputs to change the aesthetics ( colours etc. )
Numeric inputs to modify the placement / spacing of the Stop Loss / Entry signal / News
Toggles to activate or deactivate features
Disclaimer
This indicator does not guaranteed to work for every instrument ( always test before use! )
It is not at all intended to be a signal indicator on its own, but rather only to give a signal when used with specific technical strategies that us BOC entries.
This indicator is not guaranteed to be accurate, or error free.
This indicator is not signalling winning entries or high probability entries.
You must manually enter the news time inputs, this indicator does not automatically show you when there is a news release
This is a combination indicator of my Entry Assistant and my News Alert indicator, both can be found and used separately.
Pine Script® Indikator