In den Scripts nach "stoch" suchen

Stochastic Center of Gravitywww.mesasoftware.com
Stochastic version of Ehlers CG indicator.
I'm not sure how reliable it is as a strategy since TV's backtesting engine is broken.
Will provide updates as I use it in the future.

Maleta Stochastic JRNuevo indicador de de la estrategia Maleta (by Jonathan Nuñez ). Solo puse linea horizontal del 50 y aumenté el grosor de las lineas. Gracias.


Stochastic codeThe stochastic indicator in pine script to help anyone who needs and is having difficulties.
O indicador estocástico em código pine para ajudar quem precise e está tendo dificuldades.
On it can be adjusted:
Nele podem ser ajustados:
alisamento
smooth
period
source
areas

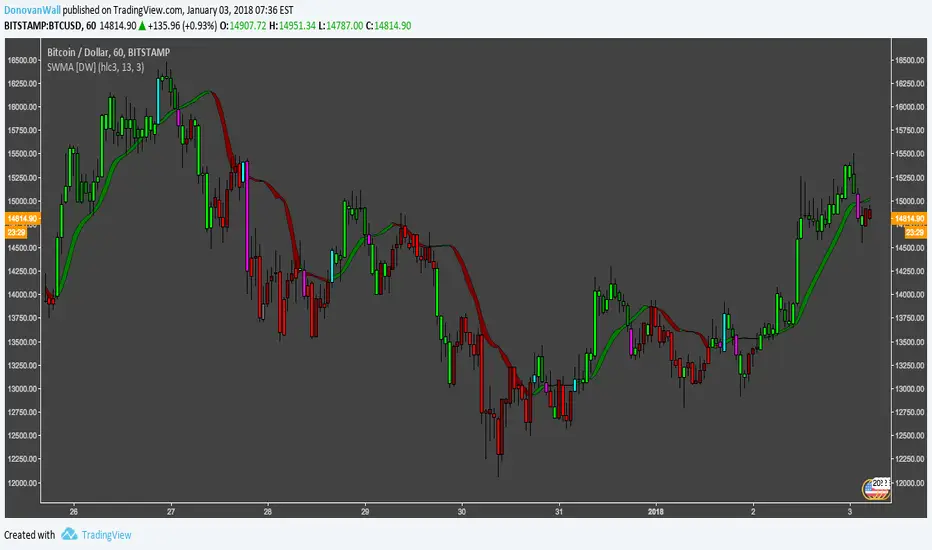
Stochastic Weighted Moving Averages [DW]This is an experimental study derived from George Lane's Stochastic Oscillator.
The %KWMA is calculated by taking a moving average of source with a %K weighting factor over its specified period.
The %DWMA is calculated by taking a simple moving average of %KWMA over its specified period.
Custom bar color scheme included.
Stochastic RSI with Crossover AlertsThis draws your Stochastic RSI just like normal except it adds red or green squares everytime there is a crossover at the bottom or the top of the oscillator. Green crossover is bullish, red is bearish.

MTF Stochastic CCI ALERTWorks good on 5 or 15min set to the 2hr or 4hr time frame.
Set an alarm (Set an alert on each Long/Short "crossing down", 0.8 (or anything below 0.99), "on condition" )
Or just as a visual.
Best to use other factors to confirm but most of the time it does a pretty decent job.
TheLark: Directional Movement Index StochasticThere is a nice writeup about a system that uses DMISTO here, which includes decent statistics:
traderedge.net
I have not yet done any back testing on the system as a whole myself, but thought the DMISTO was an interesting indicator, so ported it over for those who might want to play with it and create their own systems. I added dots that denote signals similar to the system described above, which can be turned off if desired.

EMA & Stochastic SignalsEma 200 and ema 500 + stochastic crossover. Buys when price is above emas and sells when price is below emas.

Combo 4+ KDJ STO RSI EMA3 Visual Trend Pine V5@RL! English !
Combo 4+ KDJ STO RSI EMA3 Visual Trend Pine V5 @ RL
Combo 4+ KDJ STO RSI EMA3 Visual Trend Pine V5 @ RL is a visual trend following indicator that groups and combines four trend following indicators. It is compiled in PINE Script Version V5 language.
• STOCH: Stochastic oscillator.
• RSI Divergence: Relative Strength Index Divergence. RSI Divergence is a difference between a fast and a slow RSI.
• KDJ: KDJ Indicator. (trend following indicator).
• EMA Triple: 3 exponential moving averages (Default display).
This indicator is intended to help beginners (and also the more experienced ones) to trade in the right direction of the market trend. It allows you to avoid the mistakes of always trading against the trend.
The calculation codes of the different indicators used are standard public codes used in the usual TradingView coding for these indicators.
The STO indicator calculation script is taken from TradingView's standard STOCH calculation.
The RSI indicator calculation script is a replica of the one created by @Shizaru.
The KDJ indicator calculation script is a replica of the one created by @iamaltcoin.
The Triple EMA indicator calculation script is a replica of the one created by @jwilcharts.
This indicator can be configured to your liking. It can even be used several times on the same graph (multi-instance), with different configurations or display of another indicator among the four that compose it, according to your needs or your tastes.
A single plot, among the 4 indicators that make it up, can be displayed at a time, but either with its own trend or with the trend of the 4 (3 by default) combined indicators (sell=green or buy=red, background color).
Trend indications (potential sell or buy areas) are displayed as a background color (bullish: green or bearish: red) when at least three of the four indicators (3 by default and configurable from 1 to 4) assume that the market is moving in the same direction. These trend indications can be configured and displayed, either only for the signal of the selected indicator and displayed, or for the signals of the four indicators together and combined (logical AND).
You can tune the input, style and visibility settings of each indicator to match your own preferences or habits.
A 'buy stop' or 'sell stop' signal is displayed (layouts) in the form of a colored square (green for 'stop buy' and red for 'stop sell'. These 'stop' signals can be configured and displayed, either only for the indicator chosen, or for the four indicators together and combined (logical OR).
Note that the presence of a Stop Long signal cancels the background color of the Long trend (green).
Likewise, the presence of a Stop Short signal cancels out the background color of the Short trend (red).
It is also made up of 3 labels:
• Trend Label
• signal Stop Label (signals Stop buy or sell )
• Info Label (Names of Long / Short / Stop Long / Stop Short indicators, and / Open / Close / High / Low ).
Each label is configurable (visibility and position on the graph).
• Trend label: indicates the number of indicators suggesting the same trend (Long or Short) as well as a strength index (PWR) of this trend: For example: 3 indicators in Short trend, 1 indicator in Long trend and 1 indicator in neutral trend will give: PWR SHORT = 2/4. (3 Short indicators - 1 Long indicator = 2 Pwr Short). And if PWR = 0 then the display is "Wait and See". It also indicates which current indicator is displayed and the display mode used (combined 1 to 4 indicators or not combined ).
• Signal Stop Label: Indicates a possible stop of the current trend.
• Label Info (Simple or Full) gives trend info for each of the 4 indicators and OHLC info for the chart (in “Full” mode).
It is possible to display this indicator several times on a chart (up to 3 indicators max with the Basic TradingView Plan and more with the paid plans), with different configurations: For example:
• 1-Stochastic - 2/4 Combined Signals - no Label displayed
• 1-RSI - Combined Signals 3/4 - Stop Label only displayed
• 1-KDJ - Combined Signals 4/4 - the 3 Labels displayed
• 1-EMA'3 - Non-combined signals (EMA only) - Trend Label displayed
Some indicators have filters / thresholds that can be configured according to your convenience and experience!
The choice of indicator colors is suitable for a graph with a "dark" theme, which you will probably need to modify for visual comfort, if you are using a "Light" mode or a custom mode.
This script is an indicator that you can run on standard chart types. It also works on non-standard chart types but the results will be skewed and different.
Non-standard charts are:
• Heikin Ashi (HA)
• Renko
• Kagi
• Point & Figure
• Range
As a reminder: No indicator is capable of providing accurate signals 100% of the time. Every now and then, even the best will fail, leaving you with a losing deal. Whichever indicator you base yourself on, remember to follow the basic rules of risk management and capital allocation.
BINANCE:BTCUSDT
**********************************************************************************************************************************************************************************************************************************************************************************
! Français !
Combo 4+ KDJ STO RSI EMA3 Visual Trend Pine V5@RL
Combo 4+ KDJ STO RSI EMA3 Visual Trend Pine V5@RL est un indicateur visuel de suivi de tendance qui regroupe et combine quatre indicateurs de suivi de tendance. Il est compilé en langage PINE Script Version V5.
• STOCH : Stochastique.
• RSI Divergence : Relative Strength Index Divergence. La Divergence RSI est une différence entre un RSI rapide et un RSI lent.
• KDJ : KDJ Indicateur. (indicateur de suivi de tendance).
• EMA Triple : 3 moyennes mobiles exponentielles (Affichage par défaut).
Cet indicateur est destiné à aider les débutants (et aussi les plus confirmé) à trader à dans le bon sens de la tendance du marché. Il permet d'éviter les erreurs qui consistent à toujours trader à contre tendance.
Les codes de calcul des différents indicateurs utilisés sont des codes publics standards utilisés dans le codage habituel de TradingView pour ces indicateurs !
Le script de calcul de l’indicateur STO est issu du calcul standard du STOCH de TradingView.
Le script de calcul de l’indicateur RSI Div est une réplique de celui créé par @Shizaru.
Le script de calcul de l’indicateur KDJ est une réplique de celui créé par @iamaltcoin.
Le script de calcul de l’indicateur Triple EMA est une réplique de celui créé par @jwilcharts
Cet indicateur peut être configuré à votre convenance. Il peut même être utilisé plusieurs fois sur le même graphique (multi-instance), avec des configurations différentes ou affichage d’un autre indicateur parmi les quatre qui le composent, selon vos besoins ou vos goûts.
Un seul tracé, parmi les 4 indicateurs qui le composent, peut être affiché à la fois mais, soit avec sa propre tendance soit avec la tendance des 4 (3 par défaut) indicateurs combinés (couleur de fond vente=vert ou achat=rouge).
Les indications de tendance (zones de vente ou d’achat potentielles) sont affichés sous la forme de couleur de fond (Haussier : vert ou baissier : rouge) lorsque au moins trois des quatre indicateurs (3 par défaut et configurable de 1 à 4) supposent que le marché évolue dans la même direction. Ces indications de tendance peuvent être configuré et affichés, soit uniquement pour le signal de l’indicateur choisi et affiché, soit pour les signaux des quatre indicateurs ensemble et combinés (ET logique).
Vous pouvez accorder les paramètres d’entrée, de style et de visibilité de chacun des indicateurs pour correspondre à vos propres préférences ou habitudes.
Un signal ‘stop achat’ ou ‘stop vente’ est affiché (layouts) sous la forme d’un carré de couleur (vert pour ‘stop achat’ et rouge pour ‘stop vente’. Ces signaux ‘stop’ peuvent être configuré et affichés, soit uniquement pour l’indicateur choisi, soit pour les quatre indicateurs ensemble et combinés (OU logique).
A noter que la présence d’un signal Stop Long annule la couleur de fond de la tendance Long (vert).
De même, la présence d’un signal Stop Short annule la couleur de fond de la tendance Short (rouge).
Il est aussi composé de 3 étiquettes (Labels) :
• Trend Label (infos de tendance)
• Signal Stop Label (signaux « Stop » achat ou vente)
• Infos Label (Noms des indicateurs Long/Short/Stop Long/Stop Short,
et /Open/Close/High/Low )
Chaque label est configurable (visibilité et position sur le graphique).
• Label Trend : indique le nombre d’indicateurs suggérant une même tendance (Long ou Short) ainsi qu’un indice de force (PWR) de cette tendance :
Par exemple : 3 indicateurs en tendance Short, 1 indicateur en tendance Long et 1 indicateur en tendance neutre donnera :
PWR SHORT = 2/4. (3 indicateurs Short – 1 indicateur Long=2 Pwr Short).
Et si PWR=0 alors l’affichage est « Wait and See » (Attendre et Observer).
Il indique aussi quel indicateur actuel est affiché et le mode d’affichage utilisé (combiné 1 à 4 indicateurs ou non combiné ).
• Signal Stop Label : Indique un possible arrêt de la tendance en cours.
• Infos Label (Simple ou complet) donne les infos de tendance de chacun des 4 indicateurs et les infos OHLC du graphique (en mode « Complet »).
Il est possible d’afficher ce même indicateur plusieurs fois sur un graphique (jusqu’à 3 indicateurs max avec le Plan Basic TradingView et plus avec les plans payants), avec des configurations différentes :
Par exemple :
• 1-Stochastique – Signaux Combinés 2/4 – aucun Label affiché
• 1-RSI – Signaux Combinés 3/4 – Label Stop uniquement affiché
• 1-KDJ – Signaux Combinés 4/4 – les 3 Labels affichés
• 1-EMA’3 - Signaux Non combinés (EMA seuls) – Trend Label affiché
Certains indicateurs ont des filtres/seuils (Thresholds) configurables selon votre convenance et votre expérience !
Le choix des couleurs de l’indicateur est adapté pour un graphique avec thème « sombre », qu’il vous faudra probablement modifier pour le confort visuel, si vous utilisez un mode « Clair » ou un mode personnalisé.
Ce script est un indicateur que vous pouvez exécuter sur des types de graphiques standard. Il fonctionne aussi sur des types de graphiques non-standard mais les résultats seront faussés et différents.
Les graphiques Non-standard sont :
• Heikin Ashi (HA)
• Renko
• Kagi
• Point & Figure
• Range
Pour rappel : Aucun indicateur n’est capable de fournir des signaux précis 100% du temps. De temps en temps, même les meilleurs échoueront, vous laissant avec une affaire perdante. Quel que soit l’indicateur sur lequel vous vous basez, n’oubliez pas de suivre les règles de base de gestion des risques et de répartition du capital.
BINANCE:BTCUSDT

Triple Stochastic Confluence by AtallaTriple Stochastic Confluence by Atalla - Indicator Summary
Overview
The "Triple Stochastic Confluence by Atalla" is a technical indicator for TradingView that identifies potential trading opportunities using the confluence of three Stochastic oscillators with different timeframes. The indicator focuses exclusively on the %D lines (signal lines) of the Stochastics.
Key Components
Three Stochastic Oscillators
Short-term Stochastic: Period 9, %K Smoothing 1, %D Period 3
Medium-term Stochastic: Period 14, %K Smoothing 1, %D Period 3
Long-term Stochastic: Period 60, %K Smoothing 1, %D Period 10
Visual Display
White lines for the first two Stochastics (%D lines)
Yellow line for the third (long-term) Stochastic (%D line)
Background color changes to highlight trading opportunities:
Yellow background: Bullish signal
Red background: Bearish signal
Trading Signals Logic
Bullish Signal (Yellow Background)
A bullish signal occurs when any Stochastic %D line is in the oversold zone (≤25%) while at least one of the other %D lines is in the overbought zone (≥75%).
Bearish Signal (Red Background)
A bearish signal occurs when any Stochastic %D line is in the overbought zone (≥75%) while at least one of the other %D lines is in the oversold zone (≤25%).
Configurable Parameters
Stochastic periods and smoothing values
Overbought level (default: 75%)
Oversold level (default: 25%)
Alert Conditions
The indicator includes alert conditions for both bullish and bearish confluence signals, allowing users to set up automated notifications for trading opportunities.
Trading Philosophy
This indicator leverages the concept of momentum divergence across different timeframes. When oscillators at different timeframes show opposing extreme readings (one in oversold and another in overbought), it may indicate a potential reversal point in the market. The indicator's strength lies in identifying these confluences automatically and providing clear visual signals.

Triple StochasticTriple Stochastic Elasticity Indicator
This custom indicator leverages the power of multi-timeframe analysis by combining three Stochastic Oscillators across different timeframes to identify potential trade entries based on elasticity and divergence between momentum curves.
📊 How It Works:
The indicator plots Stochastic values from three timeframes (e.g., 5m, 15m, and 1h), allowing you to observe how momentum behaves at different scales.
It highlights moments of elasticity—where the Stochastics stretch apart and then begin to converge—potentially signaling a reversion opportunity or trend continuation.
By identifying these stretches and snapbacks in momentum alignment, you can better time your entries and exits with improved confidence.
🔍 Use Case:
Look for divergence or convergence between the Stochastics.
Ideal for trend-following entries, pullback setups, and momentum reversal spotting.
Works best when combined with price action, S/R zones, or volume confirmation.
🛠 Customization:
Timeframes for each Stochastic are fully customizable.
Options to tweak %K, %D, and smoothing values to fit your strategy.
I recommend to remove the D%
And set the following settings
5 : 3 : 3
14 : 3 : 3
56 : 12 :12
Visual alerts can be added for when certain conditions are met (e.g., all three Stochs cross overbought/oversold levels).

Multiple Stoch.+RSI+Stoch. RSI A.Multiple TA, it is a combination of RSI, Stochastic RSI and Stochastic indicators with many setting options. An additional RSI can be displayed showing the RSI values of the previous candle. This has an impact on the buy and sell signal.
It offers an alert condition for the buy signal that is available in the Create Alert dialog box. Please note that the indicator does NOT create an alarm, it only offers additional options in the "Create alarm" dialog box.
This is not a purchase advice tool or does not ask for any other guarantee, so use this indicator only at your own risk.
German:
Multiple TA, es handelt sich um eine Kombination der RSI, Stochastik RSI und Stochastik Indikatoren mit viele Einstellungsmöglichkeiten. Es kann eine zusätzliche RSI angezeigt werden, der die RSI Werte von vorherige Candle anzeigt. Diese hat ein Einfluss auf den Kauf und Verkauf Signal.
Es bietet eine Alarmbedingung für die Kaufsignal an, die im Dialogfeld "Alarm erstellen" verfügbar ist. Bitte beachten Sie, dass der Indikator KEINEN Alarm erstellt, sondern nur weitere Optionen im Dialogfeld "Alarm erstellen" bietet.
Das ist keine Kaufberatungstools oder bittet keine sonstige Garantie, daher nutzen Sie diesen Indikator nur auf eigene Gefahr.

Multi-Divergence Buy/Sell IndicatorThe "Multi-Divergence Buy/Sell Indicator" is a technical analysis tool that combines multiple divergence signals from different indicators to identify potential buy and sell opportunities in the market. Here's a breakdown of how the indicator works and how to use it:
Input Parameters:
RSI Length: Specifies the length of the RSI (Relative Strength Index) calculation.
MACD Short Length: Specifies the short-term length for the MACD (Moving Average Convergence Divergence) calculation.
MACD Long Length: Specifies the long-term length for the MACD calculation.
MACD Signal Smoothing: Specifies the smoothing length for the MACD signal line calculation.
Stochastic Length: Specifies the length of the Stochastic oscillator calculation.
Stochastic Overbought Level: Defines the overbought level for the Stochastic oscillator.
Stochastic Oversold Level: Defines the oversold level for the Stochastic oscillator.
Calculation of Indicators:
RSI: Calculates the RSI based on the specified RSI Length.
MACD: Calculates the MACD line, signal line, and histogram based on the specified MACD parameters.
Stochastic: Calculates the Stochastic oscillator based on the specified Stochastic parameters.
Divergence Detection:
RSI Divergence: Identifies a bullish divergence when the RSI crosses above its 14-period simple moving average (SMA).
MACD Divergence: Identifies a bullish divergence when the MACD line crosses above the signal line.
Stochastic Divergence: Identifies a bullish divergence when the Stochastic crosses above its 14-period SMA.
Buy and Sell Conditions:
Buy Condition: Triggers a buy signal when all three divergences (RSI, MACD, and Stochastic) occur simultaneously.
Sell Condition: Triggers a sell signal when both RSI and MACD divergences occur, but Stochastic divergence does not occur.
Plotting Buy/Sell Signals:
The indicator plots green "Buy" labels below the price bars when the buy condition is met.
It plots red "Sell" labels above the price bars when the sell condition is met.
Usage:
The indicator can be used on any timeframe and for any trading instrument.
Look for areas where all three divergences (RSI, MACD, and Stochastic) align to generate stronger buy and sell signals.
Consider additional technical analysis and risk management strategies to validate the signals and manage your trades effectively.
Remember, no indicator guarantees profitable trades, so it's essential to use this indicator in conjunction with other tools and perform thorough analysis before making trading decisions.
Feel free to ask any questions

Multi-Indicator Signals with Selectable Options by DiGetMulti-Indicator Signals with Selectable Options
Script Overview
This Pine Script is a multi-indicator trading strategy designed to generate buy/sell signals based on combinations of popular technical indicators: RSI (Relative Strength Index) , CCI (Commodity Channel Index) , and Stochastic Oscillator . The script allows you to select which combination of signals to display, making it highly customizable and adaptable to different trading styles.
The primary goal of this script is to provide clear and actionable entry/exit points by visualizing buy/sell signals with arrows , labels , and vertical lines directly on the chart. It also includes input validation, dynamic signal plotting, and clutter-free line management to ensure a clean and professional user experience.
Key Features
1. Customizable Signal Types
You can choose from five signal types:
RSI & CCI : Combines RSI and CCI signals for confirmation.
RSI & Stochastic : Combines RSI and Stochastic signals.
CCI & Stochastic : Combines CCI and Stochastic signals.
RSI & CCI & Stochastic : Requires all three indicators to align for a signal.
All Signals : Displays individual signals from each indicator separately.
This flexibility allows you to test and use the combination that works best for your trading strategy.
2. Clear Buy/Sell Indicators
Arrows : Buy signals are marked with upward arrows (green/lime/yellow) below the candles, while sell signals are marked with downward arrows (red/fuchsia/gray) above the candles.
Labels : Each signal is accompanied by a label ("BUY" or "SELL") near the arrow for clarity.
Vertical Lines : A vertical line is drawn at the exact bar where the signal occurs, extending from the low to the high of the candle. This ensures you can pinpoint the exact entry point without ambiguity.
3. Dynamic Overbought/Oversold Levels
You can customize the overbought and oversold levels for each indicator:
RSI: Default values are 70 (overbought) and 30 (oversold).
CCI: Default values are +100 (overbought) and -100 (oversold).
Stochastic: Default values are 80 (overbought) and 20 (oversold).
These levels can be adjusted to suit your trading preferences or market conditions.
4. Input Validation
The script includes built-in validation to ensure that oversold levels are always lower than overbought levels for each indicator. If the inputs are invalid, an error message will appear, preventing incorrect configurations.
5. Clean Chart Design
To avoid clutter, the script dynamically manages vertical lines:
Only the most recent 50 buy/sell lines are displayed. Older lines are automatically deleted to keep the chart clean.
Labels and arrows are placed strategically to avoid overlapping with candles.
6. ATR-Based Offset
The vertical lines and labels are offset using the Average True Range (ATR) to ensure they don’t overlap with the price action. This makes the signals easier to see, especially during volatile market conditions.
7. Scalable and Professional
The script uses arrays to manage multiple vertical lines, ensuring scalability and performance even when many signals are generated.
It adheres to Pine Script v6 standards, ensuring compatibility and reliability.
How It Works
Indicator Calculations :
The script calculates the values of RSI, CCI, and Stochastic Oscillator based on user-defined lengths and smoothing parameters.
It then checks for crossover/crossunder conditions relative to the overbought/oversold levels to generate individual signals.
Combined Signals :
Depending on the selected signal type, the script combines the individual signals logically:
For example, a "RSI & CCI" buy signal requires both RSI and CCI to cross into their respective oversold zones simultaneously.
Signal Plotting :
When a signal is generated, the script:
Plots an arrow (upward for buy, downward for sell) at the corresponding bar.
Adds a label ("BUY" or "SELL") near the arrow for clarity.
Draws a vertical line extending from the low to the high of the candle to mark the exact entry point.
Line Management :
To prevent clutter, the script stores up to 50 vertical lines in arrays (buy_lines and sell_lines). Older lines are automatically deleted when the limit is exceeded.
Why Use This Script?
Versatility : Whether you're a scalper, swing trader, or long-term investor, this script can be tailored to your needs by selecting the appropriate signal type and adjusting the indicator parameters.
Clarity : The combination of arrows, labels, and vertical lines ensures that signals are easy to spot and interpret, even in fast-moving markets.
Customization : With adjustable overbought/oversold levels and multiple signal options, you can fine-tune the script to match your trading strategy.
Professional Design : The script avoids clutter by limiting the number of lines displayed and using ATR-based offsets for better visibility.
How to Use This Script
Add the Script to Your Chart :
Copy and paste the script into the Pine Editor in TradingView.
Save and add it to your chart.
Select Signal Type :
Use the "Signal Type" dropdown menu to choose the combination of indicators you want to use.
Adjust Parameters :
Customize the lengths of RSI, CCI, and Stochastic, as well as their overbought/oversold levels, to match your trading preferences.
Interpret Signals :
Look for green arrows and "BUY" labels for buy signals, and red arrows and "SELL" labels for sell signals.
Vertical lines will help you identify the exact bar where the signal occurred.
Tips for Traders
Backtest Thoroughly : Before using this script in live trading, backtest it on historical data to ensure it aligns with your strategy.
Combine with Other Tools : While this script provides reliable signals, consider combining it with other tools like support/resistance levels or volume analysis for additional confirmation.
Avoid Overloading the Chart : If you notice too many signals, try tightening the overbought/oversold levels or switching to a combined signal type (e.g., "RSI & CCI & Stochastic") for fewer but higher-confidence signals.

Overbought / Oversold Screener## Introduction
**The Versatile RSI and Stochastic Multi-Symbol Screener**
**Unlock a wealth of trading opportunities with this customizable screener, designed to pinpoint potential overbought and oversold conditions across 17 symbols, with alert support!**
## Description
This screener is suitable for tracking multiple instruments continuously.
With the screener, you can see the instant RSI or Stochastic values of the instruments you are tracking, and easily catch the moments when they are overbought / oversold according to your settings.
The purpose of the screener is to facilitate the continuous tracking of multiple instruments. The user can track up to 17 different instruments in different time intervals. If they wish, they can set an alarm and learn overbought oversold according to the values they set for the time interval of the instruments they are tracking.**
Key Features:
Comprehensive Analysis:
Monitors RSI and Stochastic values for 17 symbols simultaneously.
Automatically includes the current chart's symbol for seamless integration.
Supports multiple timeframes to uncover trends across different time horizons.
Personalized Insights:
Adjust overbought and oversold thresholds to align with your trading strategy.
Sort results by symbol, RSI, or Stochastic values to prioritize your analysis.
Choose between Automatic, Dark, or Light mode for optimal viewing comfort.
Dynamic Visual Cues:
Instantly highlights oversold and overbought symbols based on threshold levels.
Timely Alerts:
Stay informed of potential trading opportunities with alerts for multiple oversold or overbought symbols.
## Settings
### Display
**Timeframe**
The screener displays the values according to the selected timeframe. The default timeframe is "Chart". For example, if the timeframe is set to "15m" here, the screener will show the RSI and stochastic values for the 15-minute chart.
** Theme **
This setting is for changing the theme of the screener. You can set the theme to "Automatic", "Dark", or "Light", with "Automatic" being the default value. When the "Automatic" theme is selected, the screener appearance will also be automatically updated when you enable or disable dark mode from the TradingView settings.
** Position **
This option is for setting the position of the table on the chart. The default setting is "middle right". The available options are (top, middle, bottom)-(left, center, right).
** Sort By **
This option is for changing the sorting order of the table. The default setting is "RSI Descending". The available options are (Symbol, RSI, Stoch)-(Ascending, Descending).
It is important to note that the overbought and oversold coloring of the symbols may also change when the sorting order is changed. If RSI is selected as the sorting order, the symbols will be colored according to the overbought and oversold threshold values specified for RSI. Similarly, if Stoch is selected as the sorting order, the symbols will be colored according to the overbought and oversold threshold values specified for Stoch.
From this perspective, you can also think of the sorting order as a change in the main indicator.
### RSI / Stochastic
This area is for selecting the parameters of the RSI and stochastic indicators. You can adjust the values for "length", "overbought", and "oversold" for both indicators according to your needs. The screener will perform all RSI and stochastic calculations according to these settings. All coloring in the table will also be according to the overbought and oversold values in these settings.
### Symbols
The symbols to be tracked in the table are selected from here. Up to 16 symbols can be selected from here. Since the symbol in the chart is automatically added to the table, there will always be at least 1 symbol in the table. Note that the symbol in the chart is shown in the table with "(C)". For example, if SPX is open in the chart, it is shown as SPX(C) in the table.
## Alerts
The screener is capable of notifying you with an alarm if multiple symbols are overbought or oversold according to the values you specify along with the desired timeframe. This way, you can instantly learn if multiple symbols are overbought or oversold with one alarm, saving you time.

RSI, SRSI, MACD and DMI cross - Open source codeHello,
I'm a passionate trader who has spent years studying technical analysis and exploring different trading strategies. Through my research, I've come to realize that certain indicators are essential tools for conducting accurate market analysis and identifying profitable trading opportunities. In particular, I've found that the RSI, SRSI, MACD cross, and Di cross indicators are crucial for my trading success.
Detailed explanation:
The RSI is a momentum indicator that measures the strength of price movements. It is calculated by comparing the average of gains and losses over a certain period of time. In this indicator, the RSI is calculated based on the close price with a length of 14 periods.
The Stochastic RSI is a combination of the Stochastic Oscillator and the RSI. It is used to identify overbought and oversold conditions of the market. In this indicator, the Stochastic RSI is calculated based on the RSI with a length of 14 periods.
The MACD is a trend-following momentum indicator that shows the relationship between two moving averages of prices. It consists of two lines, the MACD line and the signal line, which are used to generate buy and sell signals. In this indicator, the MACD is calculated based on the close price with fast and slow lengths of 12 and 26 periods, respectively, and a signal length of 9 periods.
The DMI is a trend-following indicator that measures the strength of directional movement in the market. It consists of three lines, the Positive Directional Indicator (+DI), the Negative Directional Indicator (-DI), and the Average Directional Index (ADX), which are used to generate buy and sell signals. In this indicator, the DMI is calculated with a length of 14 periods and an ADX smoothing of 14 periods.
The indicator generates buy signals when certain conditions are met for each of these indicators.
1) For the RSI, a buy signal is generated when the RSI is below or equal to 35 and the Stochastic RSI %K is below or equal to 15, or when the RSI is below or equal to 28 the Stochastic RSI %K is below or equal to 15 or when the RSI is below or equal to 25 and the Stochastic RSI %K is below or equal to 10 or when the RSI is below or equal to 28.
2) For the MACD, a buy signal is generated when the MACD line is below 0, there is a change in the histogram from negative to positive, the MACD line and histogram are negative in the previous period, and the current histogram value is greater than 0.
3) For the DMI, a buy signal is generated when the Positive Directional Indicator (+DI) crosses above the Negative Directional Indicator (-DI), and the -DI is less than the +DI.
The indicator generates sell signals when certain conditions are met for each of these indicators:
1) For the RSI, a sell signal is generated when the RSI is above or equal to 75 and the Stochastic RSI %K is above or equal to 85, or when the RSI is above or equal to 80 and the Stochastic RSI %K is above or equal to 85, or when the RSI is above or equal to 85 and the Stochastic RSI %K is above or equal to 90 or when the RSI is above or equal to 82.
2)For the MACD, a sell signal is generated when the MACD line is above 0, there is a change in the histogram from positive to negative, the MACD line and histogram are positive in the previous period, and the current histogram value is less than the previous histogram value. On the other hand, a buy signal is generated when the MACD line is below 0, there is a change in the histogram from negative to positive, the MACD line and histogram are negative in the previous period, and the current histogram value is greater than the previous histogram value.
3)For the DMI a bearish signal is generated when plusDI crosses above minusDI, indicating that bulls are losing strength and bears are taking control.
The indicator uses a combination of these four indicators to generate potential buy and sell signals. The buy signals are generated when RSI and SRSI values are in oversold conditions, while sell signals are generated when RSI and SRSI values are in overbought conditions. The indicator also uses MACD crossovers and DMI crossovers to generate additional buy and sell signals.
When a signal is strong?
The use of multiple signals within a specific timeframe can increase the accuracy and reliability of the signals generated by this indicator. It is recommended to look for at least two signals within a range of 5-8 candles in order to increase the probability of a successful trade.
Why it's original?
1) There is no indicator in the library that combine all of these indicators and give you a 360 view
2)The combination of the RSI, Stochastic RSI, MACD, and DMI indicators in a single script it's unique and not available in the libray.
3)The specific parameters and conditions used to calculate the signals may be unique and not found in other scripts or libraries.
4)The use of plotshape() to plot the signals as shapes on the chart may be unique compared to other scripts that simply plot lines or bars to indicate signals.
5)The use of alertcondition() to trigger alerts based on the signals may be unique compared to other scripts that do not have custom alert functionality.
Keep attention!
It is important to note that no trading indicator or strategy is foolproof, and there is always a risk of losses in trading. While this indicator may provide useful information for making conclusions, it should not be used as the sole basis for making trading decisions. Traders should always use proper risk management techniques and consider multiple factors when making trading decisions.
Support me:)
If you find this new indicator helpful in your trading analysis, I would greatly appreciate your support! Please consider giving it a like, leaving feedback, or sharing it with your trading network. Your engagement will not only help me improve this tool but will also help other traders discover it and benefit from its features. Thank you for your support!

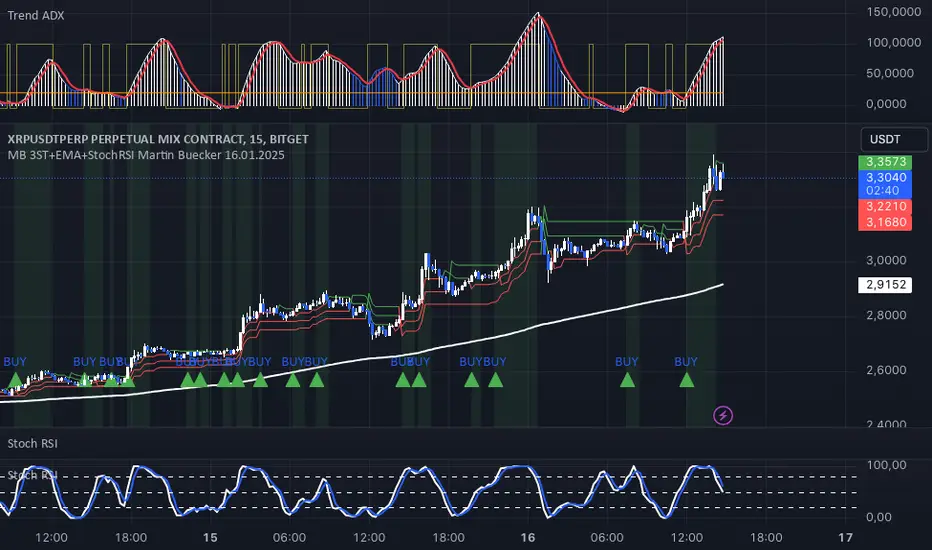
MB 3ST+EMA+StochRSI Martin Buecker 16.01.2025Short Description of the Indicator "MB 3ST+EMA+StochRSI Martin Buecker 16.01.2025"
This trend-following and momentum-based indicator combines Supertrend, EMA 200, and Stochastic RSI to generate buy and sell signals with improved accuracy.
1. Key Components
Supertrend (3 variations):
Uses three Supertrend indicators with different periods to confirm trend direction.
Buy signal when at least 2 Supertrends are bearish.
Sell signal when at least 2 Supertrends are bullish.
EMA 200 (Exponential Moving Average):
Buy signals only when the price is above EMA 200 (uptrend confirmation).
Sell signals only when the price is below EMA 200 (downtrend confirmation).
Multi-Timeframe Stochastic RSI:
Uses a higher timeframe Stoch RSI (default: 15 minutes) to filter signals.
Buy signal when %K crosses above %D (bullish momentum).
Sell signal when %K crosses below %D (bearish momentum).
2. Signal Generation
📈 Buy Signal Conditions:
✅ At least 2 of 3 Supertrends are bearish
✅ Price is above EMA 200
✅ Stoch RSI shows a bullish crossover (%K > %D)
📉 Sell Signal Conditions:
✅ At least 2 of 3 Supertrends are bullish
✅ Price is below EMA 200
✅ Stoch RSI shows a bearish crossover (%K < %D)
3. Visual Representation & Alerts
Supertrend Lines:
Green = Bullish, Red = Bearish
EMA 200: White Line
Buy/Sell Signals:
Green triangle (below bar) = Buy
Red triangle (above bar) = Sell
Alerts:
Notifies users when a buy or sell signal is triggered.
Background Coloring:
Green for Buy signals, Red for Sell signals
4. Purpose & Benefits
🔥 Combines trend (EMA 200, Supertrend) and momentum analysis (Stoch RSI) for better signal accuracy.
🔥 Works best in trending markets, filtering out false signals in sideways movements.
🔥 Suitable for scalping and day trading, providing clear and structured trade entries.
Trend Checker by Hally - IndicatorIt is an indicator that overlaps MACD and Stochastics.
It has both characteristics.
The trend changes when two lines intersect.
I think the reaction is bad in the range market.
Also, when there are Stochastics and MACD lines above the indicator, it is possible to think whether it is overbought while riding the trend, and it may be helpful for making decisions such as "maybe it will reverse soon". Hmm.
Also, I think it is better to use it in combination with other indicators.
This is my first pine script, and I couldn't find it even if I searched for the script with overlapping indicators of different scales, so I tried making it by trial and error.
I hope it helps somebody trying to do the same.
MACDとStochasticsを重ね合わせたインジケーターです。
それぞれの特徴を併せ持っています。
2本のラインが交差する時トレンドが変化します。
レンジ相場では反応が悪いと思います。
また、インジケーターの上の位置にStochasticsとMACDラインがあるときはトレンドに乗りながらも買われすぎかどうか考えられることが出来ますし、「そろそろ反転するかも」などの判断の助けになるかもしれません。
また、他の指標との併用して使うほうが良いと思います。
pineスクリプトは初めてで、異なるスケールのインジケーターを重ね合わせていスクリプトは探しても見つからなかったので試行錯誤で作ってみました。
同じようなことをやろうとしてる誰かの参考になれば幸いです。
