Trading Volatility Clock⏰ TRADING VOLATILITY CLOCK - Know When the Action Happens (Anywhere in the World)
A real-time session tracker with multi-timezone support for active traders who need to know when US market volatility strikes - no matter where they are in the world. Perfect for day traders, scalpers, and anyone trading liquid US markets.
══════════════════════════════════════════════════════
📊 WHAT IT DOES
This indicator displays a live clock showing:
- Current time in YOUR selected timezone (10 major timezones supported)
- Active US market session with color-coded volatility levels
- Countdown timer showing time remaining in current session
- Preview of the next upcoming session
- Optional alerts when entering high-volatility periods
══════════════════════════════════════════════════════
🌍 MULTI-TIMEZONE SUPPORT
SESSIONS ALWAYS TRACK US MARKET HOURS (Eastern Time):
No matter which timezone you select, the sessions always trigger at the correct US market times. Perfect for international traders who want to:
• See their local time while tracking US market sessions
• Know exactly when US volatility hits in their timezone
• Plan their trading day around US market hours
SUPPORTED TIMEZONES:
• America/New_York (ET) - Eastern Time
• America/Chicago (CT) - Central Time
• America/Los_Angeles (PT) - Pacific Time
• Europe/London (GMT) - Greenwich Mean Time
• Europe/Berlin (CET) - Central European Time
• Asia/Tokyo (JST) - Japan Standard Time
• Asia/Shanghai (CST) - China Standard Time
• Asia/Hong_Kong (HKT) - Hong Kong Time
• Australia/Sydney (AEDT) - Australian Eastern Time
• UTC - Coordinated Universal Time
EXAMPLE: A trader in Tokyo selects "Asia/Tokyo"
• Clock shows: 11:30 PM JST
• Session shows: "Opening Drive" 🔥 HIGH
• They know: US market just opened (9:30 AM ET in New York)
══════════════════════════════════════════════════════
🎯 WHY IT'S USEFUL
Whether you trade futures, high-volume stocks, or ETFs, volatility isn't constant throughout the day. Knowing WHEN to expect movement is critical:
🔥 HIGH VOLATILITY (Red):
• Opening Drive (9:30-10:30 AM ET) - Highest volume of the day
• Power Hour (3:00-4:00 PM ET) - Second-highest volume, final push
⚡ MEDIUM VOLATILITY (Yellow):
• Pre-Market (8:00-9:30 AM ET) - Building momentum
• Lunch Return (1:00-2:00 PM ET) - Traders returning
• Afternoon Session (2:00-3:00 PM ET) - Trend continuation
• After Hours (4:00-5:00 PM ET) - News reactions
💤 LOW VOLATILITY (Gray):
• Overnight Grind (12:00-8:00 AM ET) - Thin volume
• Mid-Morning Chop (10:30-11:30 AM ET) - Ranges form
• Lunch Hour (11:30 AM-1:00 PM ET) - Dead zone
• Evening Fade (5:00-8:00 PM ET) - Volume dropping
══════════════════════════════════════════════════════
⚙️ CUSTOMIZATION OPTIONS
TIMEZONE SETTINGS:
• Select from 10 major timezones worldwide
• Clock automatically displays in your local time
• Sessions remain locked to US market hours
SESSION TIME CUSTOMIZATION:
• Every session boundary is adjustable (in minutes from midnight ET)
• Perfect for traders who define sessions differently
• Advanced users can create custom volatility schedules
DISPLAY OPTIONS:
• Toggle next session preview on/off
• Enable/disable high volatility alerts
• Clean, unobtrusive table display in top-right corner
══════════════════════════════════════════════════════
💡 HOW TO USE
1. Add indicator to any chart (works on all timeframes)
2. Select your timezone in Settings → Timezone Settings
3. Set your chart to 1-minute timeframe for real-time updates
4. Customize session times if needed (Settings → Session Time Customization)
5. Watch the top-right corner for live session tracking
TRADING APPLICATIONS:
• Avoid trading during dead zones (lunch hour, mid-morning chop)
• Increase position size during high volatility windows
• Set alerts for Opening Drive and Power Hour
• Plan your trading day around US market volatility schedule
• International traders can track US sessions in their local time
══════════════════════════════════════════════════════
🎓 EDUCATIONAL VALUE
This indicator teaches traders:
• Market microstructure and volume patterns
• Why certain times produce better opportunities
• How institutional flows create intraday patterns
• The importance of timing in active trading
• How to adapt US market trading to any timezone
══════════════════════════════════════════════════════
⚠️ IMPORTANT NOTES
- Works best on 1-minute charts for frequent updates
- Sessions are ALWAYS based on US Eastern Time (ET)
- Timezone selection only changes the clock display
- Clock updates when new bar closes (not tick-by-tick)
- Alerts trigger once per bar when enabled
- Perfect for international traders tracking US markets
══════════════════════════════════════════════════════
📈 BEST USED WITH
- High-volume US stocks: TSLA, NVDA, AAPL, AMD, META
- Major US ETFs: SPY, QQQ, IWM, DIA
- US Futures: ES, NQ, RTY, YM, MES, MNQ
- Any liquid US instrument with clear intraday volume patterns
══════════════════════════════════════════════════════
🌏 FOR INTERNATIONAL TRADERS
This tool is specifically designed for traders outside the US who need to:
• Track US market sessions in their local timezone
• Know when to be at their desk for US volatility
• Avoid waking up for low-volatility periods
• Maximize trading efficiency around US market hours
No more timezone confusion. No more missing the opening bell. Just set your timezone and trade with confidence.
══════════════════════════════════════════════════════
This is an open-source educational tool. Feel free to modify and adapt to your trading style!
Happy Trading! 🚀
In den Scripts nach "session" suchen

Asia & London Session High/Low – EOD Segments (v4.5)What it does
Plots the Asia and London session high & low each day.
When a session ends, its high/low are locked (non-repainting) and drawn as horizontal segments that auto-extend to the end of that same day (no infinite rays).
Optional labels show the exact level at session close.
Toggle whether to keep prior days on the chart or auto-clear them on the first bar of a new day.
Why traders use it
Quickly see overnight liquidity levels that often act as magnets or barriers during the U.S. session.
Map session range extremes for breakout/reversal planning, partials, and invalidation.
Works great alongside VWAP, 8/20/200 MAs, or your NY session tools to build confluence.
How it works
You define the session windows (defaults: Asia 00:00–06:00, London 07:00–11:00).
While a session is active, the script tracks running high/low.
On the bar after the session ends, the level is finalized and drawn; the segment’s right edge updates each bar until EOD, then stops automatically.
Inputs
Session Timezone: “Exchange”, UTC, or a specific region (set this to match your venue).
Asia / London Session: editable HHMM-HHMM windows.
Show Asia / Show London: enable either/both sessions.
Keep history: keep or auto-delete previous days.
Show labels: price labels at session close.
Colors & width: customize high/low colors and line width.
Best practices
Use on intraday timeframes (1–60m).
For equities/futures, set timezone to your exchange (e.g., America/New_York). For FX/crypto, pick what matches your workflow.
Common tweak: London 08:00–12:00 local; Asia 00:00–05:00 or your broker’s definition.
Notes
Non-repainting: levels only print once the session is complete.
Designed to be light and reliable—no boxes, just clean lines and labels.
If you want NY session levels, midlines (50%), anchored stop-time, or alerts on touches, this script can be extended.
For educational use only. Not financial advice.

ATT + Key Levels with SessionsKey Features:
ATT Turning Point Numbers:
This input allows the user to define specific numbers (e.g., "3,11,17,29,41,47,53,59") that mark turning points in price action, which are checked using the bar_index modulo 60. If the current bar index matches one of these turning points, it triggers potential buy or sell signals.
RSI (Relative Strength Index):
The RSI is calculated based on a user-defined period (rsi_period), typically 14, and used to indicate overbought or oversold conditions. The script defines overbought (70) and oversold (30) levels, which are used to filter buy or sell signals.
Session Times:
The script includes predefined session times for major trading markets:
New York: From 9:30 AM EST to 4:00 PM EST.
London: From 8:00 AM GMT to 4:30 PM GMT.
Asia: From 12:00 AM GMT to 9:00 AM GMT.
These session times are used to restrict the buy and sell signals to specific market sessions.
Key Levels:
The script calculates and plots key market levels for the current day and week:
Daily High and Low: The highest and lowest prices of the current day.
Weekly High and Low: The highest and lowest prices of the current week.
These levels are plotted with different colors for visual reference.
Signal Logic:
Buy Signal: Triggered when the current bar is a turning point (according to the ATT model), the RSI is below the oversold threshold, and the current time is within the active session times (New York, London, or Asia).
Sell Signal: Triggered when the current bar is a turning point, the RSI is above the overbought threshold, and the current time is within the active session times.
Signal Limitations:
A user-defined limit (max_signals_per_session) controls the maximum number of signals that can be plotted within each session. This prevents excessive signal generation.
Plotting and Background Highlights:
Buy and Sell Signals: The script plots shapes (labels) above or below the bars to indicate buy or sell signals when the conditions are met.
Background Highlight: The background color is highlighted in yellow when the current bar matches one of the defined ATT turning points.
In Summary:
The indicator combines multiple technical factors to generate trading signals:
Turning points in price action (based on custom ATT numbers),
RSI levels (overbought/oversold),
Market session times (New York, London, Asia),
Key price levels (daily and weekly highs and lows).
This combination helps traders identify potential buying and selling opportunities while considering broader market dynamics and limiting the number of signals during each session.

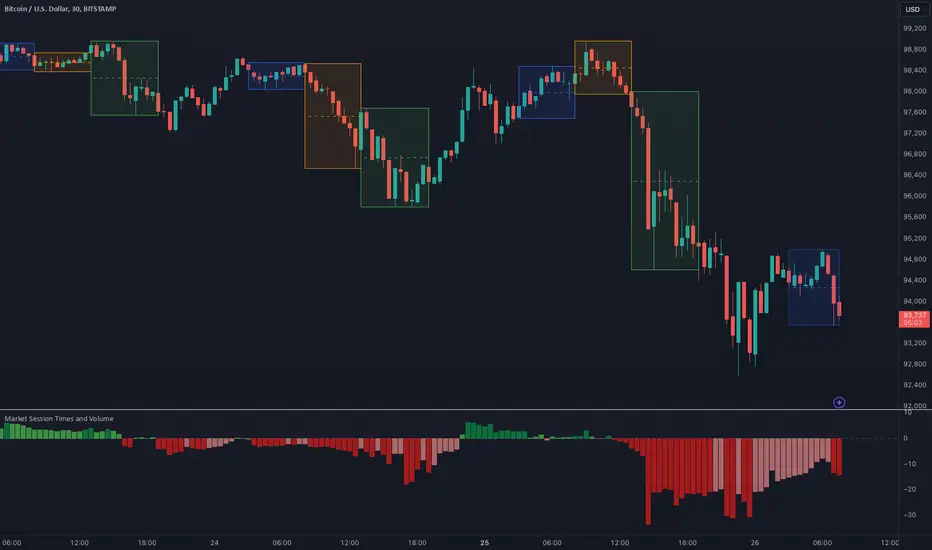
Market Session Times and Volume [Market Spotter]Market Session Times and Volume
Market Session Times
Inputs
The inputs tab consists of timezone adjustment which would be the chosen timezone for the plotting of the market sessions based on the market timings.
Further it contains settings for each box to show/hide and change box colour and timings for Asian, London and New York Sessions.
How it works
The indicator primarily works by marking the session highs and lows for the chosen time in the inputs, each of the sessions can be input a custom time value which would plot the box. It helps to identify the important price levels and the trading range for each individual session.
The midpoint of each session is marked with a dashed line. The indicator also marks a developing session while it being formed as well to identify potential secondary levels.
Usage
It can be used to trade session breakouts, false breaks and also divide the daily movement into parts and identify possible patterns while trading.
2. Volumes
Inputs
The volume part has 2 inputs - Smoothing and Normalisation. The smoothing period can simply be used to take in charge volumes of last X bars and normalisation can be used for calculating relative volumes based on last Y bars.
How it works
The indicator takes into account the buy and sell volumes of last X bars and then displays that as a relative smoothed volume which helps to identify longer term build or distribution of volume. It plots the positive volume from 0 to 100 and negative volume from 0 to -100 which has been normalised. The colors identify gradual increase or decrease in volumes
Usage
It can also be used to trade volume spikes well and can identify potential market shifts
ORB Sessions w/ MidlineORB Sessions with Midline – Customizable Opening Range Breakout Indicator
📌 Overview:
This indicator allows traders to visualize Opening Range Breakout (ORB) sessions with customizable high, low, and midline levels. It supports both predefined ORB sessions and user-defined custom sessions. The ORB levels update in real-time and are automatically hidden on higher timeframes.
🔹 Features:
✅ Predefined ORB Sessions – Toggle commonly used ORB periods to match your strategy.
✅ Custom ORB Sessions – Define up to three additional ORB sessions with custom start and end times.
✅ Live ORB Updates – ORB high, low, and midline update dynamically as bars close within the session.
✅ Customizable Colors & Labels – Set unique colors for high, midline, and low levels, and enable/disable price labels.
✅ Smart Timeframe Filtering – ORB lines automatically hide on higher timeframes when they exceed the ORB duration.
✅ Futures Market Adjustments – Automatically shifts ORB session times for NQ, ES, YM, RTY, and M2K to align with market hours.
🛠️ How to Use:
1️⃣ Enable ORB Sessions – Select which predefined sessions you want to track.
2️⃣ Customize Your Own ORBs – Define up to three custom ORB sessions with specific start and end times.
3️⃣ Adjust Visualization – Modify ORB colors and labels for better chart clarity.
4️⃣ Trade ORB Breakouts – Use these key levels to identify potential breakouts, reversals, and trend continuation setups.

FT SessionsFT Sessions
Overview
The FT Sessions is a highly customizable and powerful indicator designed for intraday traders who focus on session-based analysis. This script visually highlights global market sessions—Asia, Frankfurt, London, and New York (AM & PM)—on the chart, making it easier to track session ranges and analyze intraday price movements.
Key Features
Customizable Session Times and Colors:
Define your own session times and assign unique colors for better visibility.
Session Range Visualization:
Displays high and low ranges for each session.
Optional transparent range areas with outlines for clarity.
Configurable session range labels for enhanced readability.
Flexible Timezone Settings:
Choose a UTC offset or sync with the exchange's timezone.
User-Friendly Customization:
Compact settings for easier adjustments.
Enable or disable specific sessions to focus on relevant market activity.
How This Script Differs from LuxAlgo
This script draws inspiration from LuxAlgo's session tracking concept but has been developed with significant modifications and unique features:
Built from Scratch in Pine Script v5:
Fully optimized for Pine Script’s latest version, improving performance and functionality.
Expanded Session Range Features:
Five unique sessions (Asia, Frankfurt, London, New York AM, New York PM) with customizable ranges, colors, and labels.
Real-time updating of session ranges for improved intraday analysis.
4H Timeframe Optimization:
Automatically notifies users if applied to an unsupported timeframe, ensuring session accuracy.
Highly Configurable Input Options:
Advanced timezone handling and compact session management settings.
Unique Coding Structure:
Designed to maximize efficiency and minimize resource usage on TradingView.
While LuxAlgo focuses on session concepts, this script brings a fresh, customizable approach specifically tailored for intraday traders seeking precision in tracking session activity.
How It Works
The indicator tracks price movements within each session.
Highlights the high and low range of each session directly on the chart.
Updates session ranges in real-time to reflect evolving market conditions.
Practical Applications
Intraday Trading: Plan trades based on major market session ranges.
Breakout Strategies: Use session high and low levels to identify potential breakouts.
Session-Specific Patterns: Spot consolidations and reversals within session activity.
Important Notes
Optimized for the 4H timeframe. If applied to another timeframe, a notification will appear.
Best used in combination with other tools (e.g., volume or trend indicators) for a complete trading strategy.
Credits
This script draws inspiration from LuxAlgo's open-source session-tracking methodology. However, it introduces substantial improvements and unique features that set it apart. Full credit is given to LuxAlgo for their original open-source concept.
Disclaimer
This script is for informational and educational purposes only. Always test on a demo account before applying to live markets.

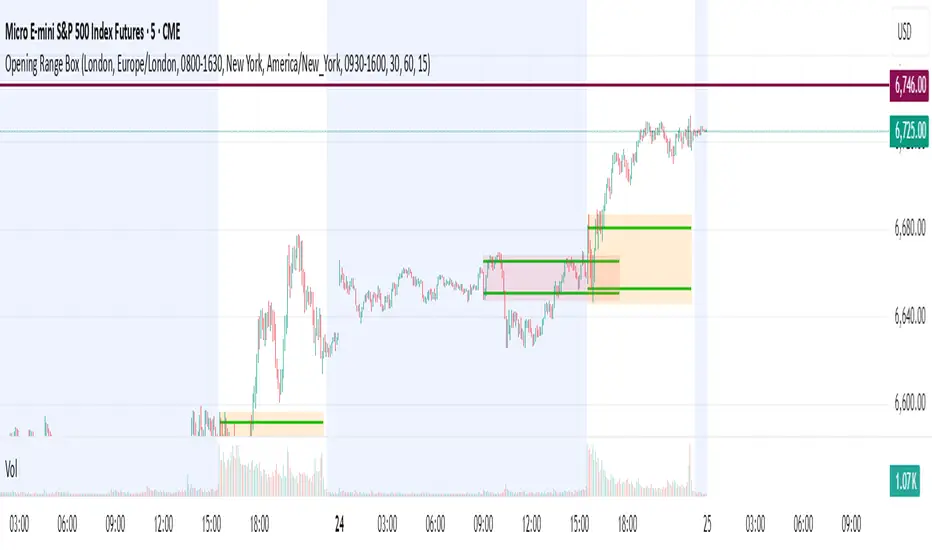
Opening Range Box, 2 SessionsOpening Range & Session Box Indicator
This indicator automatically draws Opening Range (OR) boxes and Session Boxes based on specific time zone settings, helping you visualize key trading periods across different global markets.
Key Features:
Custom Sessions: Define two independent trading sessions (e.g., New York and London).
Time Zone Selection: Choose the exact time zone for each session from a simple dropdown menu, ensuring accurate session mapping regardless of your chart's time zone.
Opening Range Definition: The initial portion of each session (defined by the Opening Range Minutes input) establishes the high and low of the box.
Offset Lines: Automatically draws two percentage offset lines inside the box, allowing you to easily track price movement relative to the Opening Range high and low (e.g., 10% retracement levels).
How to Use the Inputs:
Session A/B Timezone - Select the time zone for Session A (e.g., America/New_York).
Session A/B Time - Define the start and end time for Session A (e.g., 0930-1600).
Opening Range Minutes - Set how long the initial opening range period lasts (e.g., 30 minutes).
Percent from High/Low for Line - Set the percentage distance for the inner offset lines (e.g., 10.0 for 10% retracement).
Number of Boxes to Show - Controls the number of historical session boxes and lines that remain visible on the chart.
Custom Two Sessions H/L/50% LevelsTrack high/low/midpoint levels across two customizable time sessions. Perfect for monitoring H4 blocks, session ranges, or any custom time periods as reference levels for lower timeframe trading.
What This Indicator Does:
Tracks and projects High, Low, and 50% Midpoint levels for two fully customizable time sessions. Unlike fixed-session indicators, you define EXACTLY when each session starts and ends.
Key Features:
• Two independent sessions with custom start/end times (hour and minute)
• High/Low/50% midpoint tracking for each session
• Visual session boxes showing calculation periods
• Horizontal lines projecting levels into the future
• Historical session levels remain visible for reference
• Works on any chart timeframe (M1, M5, M15, H1, H4, etc.)
• Full visual customization (colors, line styles, widths)
• DST timezone support
Common Use Cases:
H4 Candle Tracking - Set sessions to 4-hour blocks (e.g., 6-10am, 10am-2pm) to track individual H4 highs/lows
H1 Candle Tracking - 1-hour blocks for scalping reference levels
Session Trading - ETH vs RTH, London vs NY, Asian session, etc.
Custom Time Periods - Any time range you want to monitor
How to Use:
The indicator identifies key price levels from higher timeframe periods. Use previous session H/L/50% as reference levels for:
Identifying sweep and reclaim setups
Lower timeframe structural flip confirmations
Support/resistance zones for entries
Delivery targets after breaks of structure
Settings:
Configure each session's start/end times independently. The indicator automatically triggers at the first bar crossing into your specified time, making it compatible with all chart timeframes.
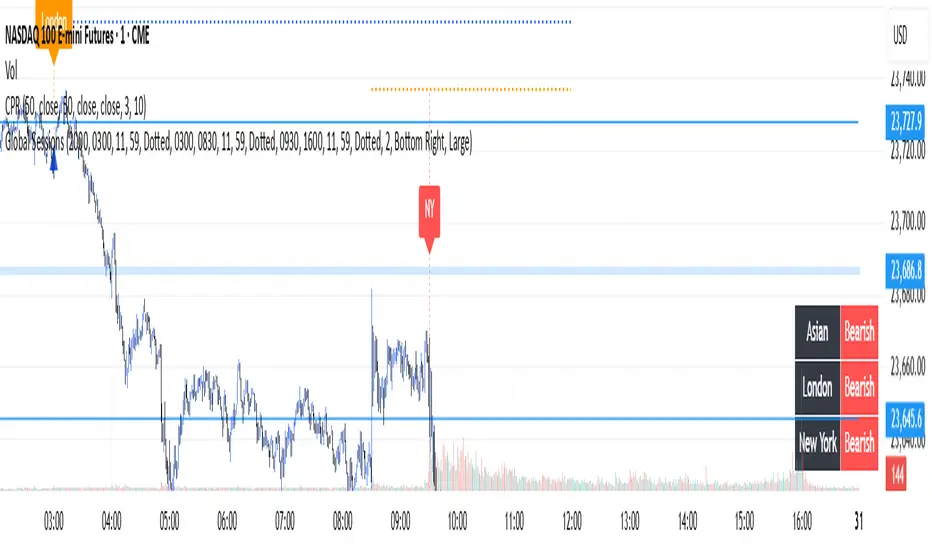
Global Sessions with Trend & Liquidity Features:
-Session ranges with customizable lines & colors
-Opening range markers and optional background shading
-Automatic trend detection per session (Bullish / Bearish / Neutral)
-Indicators when highs/lows are broken
-Clean visual design with toggles for minimal or detailed display
This Pine Script code is designed to help traders visualize and analyze different market sessions. It's a tool that displays the trading hours for the Asian, London, and New York sessions right on the chart.
The main purpose is to show when these key markets are open and to highlight their price ranges. It also includes features to track the trend within each session and to identify "liquidity sweeps" or moments when the price breaks the high or low of a previous session.
In simple terms, it helps a trader see what the market is doing and where the price is likely to go, all based on the major global trading times. It's especially useful for day traders who want to align their strategies with the activity of specific markets.
P.S. Apologies to users not in the EST timezone! This version is hardcoded to Eastern Standard Time, and I'm not currently sure how to automatically adjust it for different timezones. But you can adjust manually and click the dropdown menu to Save As Default.
Full Session ATR Range (Live) - with Position ToggleBelow is a publication-ready text for the "Full Session ATR Range (Live) - with Position Toggle" indicator, written in a professional yet accessible style suitable for a trading community (e.g., TradingView or a blog). The text highlights the indicator's features, usage, and benefits, while avoiding overly technical jargon for a broad audience.
---
### Introducing the Full Session ATR Range (Live) Indicator with Position Toggle
Enhance your trading strategy with the **Full Session ATR Range (Live) Indicator**, a powerful tool designed to provide real-time insights into market volatility and session dynamics. This customizable indicator, now available with a position toggle feature, compares the current session's range to a 10-day Average True Range (ATR), helping traders gauge market activity and anticipate potential movements.
#### Key Features
- **Live Range Tracking**: Displays the current session's range (high minus low) alongside a 10-day ATR, updated in real-time during market hours.
- **Session Mode Flexibility**: Includes an auto-toggle option to switch between Electronic Trading Hours (ETH) and Regular Trading Hours (RTH), adapting to your preferred trading session. Manually select ETH or RTH, or let the indicator auto-detect based on market hours.
- **Comprehensive Metrics**: Offers a detailed breakdown including:
- Range/Avg %: Percentage of the current range relative to the 10-day ATR.
- Points Left: Remaining points to reach the average range.
- 100% Range Up/Dn: Potential upper and lower targets based on the ATR difference.
- **Position Customization**: Adjust the table's location on your chart with options like top-left, top-right, middle-center, or bottom-right for optimal visibility.
- **Visual Appeal**: Features a customizable background and text color to match your chart theme.
#### How It Works
The indicator calculates the 10-day ATR using daily data and tracks the current session's range, resetting at the start of each day or session change. During market hours (e.g., 6 AM - 8 PM CDT, adjustable), it updates live, providing actionable insights. When the market is closed, it displays historical ATR while marking live metrics as "n/a" to avoid confusion. The ETH/RTH toggle ensures the range reflects either the full extended session or the core trading hours, tailored to your strategy.
#### Why Use It?
Whether you're a day trader monitoring intraday volatility or a swing trader assessing longer-term trends, this indicator helps you:
- Identify overextended or underactive sessions compared to historical norms.
- Plan entries and exits with targets based on the 100% Range Up/Dn levels.
- Stay informed with a clean, adjustable display that fits your workflow.
#### Installation & Customization
1. Add the indicator to your TradingView chart.
2. Adjust the ATR length (default: 10 days) and table position via the input settings.
3. Choose your session mode (Auto, ETH, or RTH) and customize colors to suit your style.
4. Test during market hours for live updates—note that static values may appear outside trading sessions.
#### Feedback & Support
This indicator is designed for flexibility and ease of use. Share your feedback or request enhancements by commenting below or contacting the developer. Happy trading!

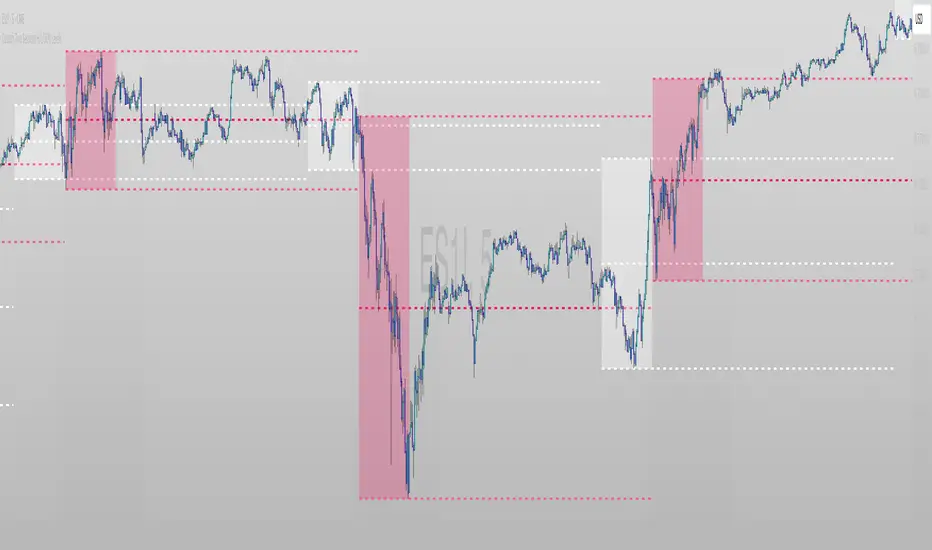
FX Session High/Low Bands - Last 5 EST Days
FX Session High/Low Bands - Last 5 Days
Description:
This indicator plots horizontal bands representing the high and low price levels from the major forex trading sessions over the last 5 days. It helps traders identify key support and resistance zones based on recent session activity.
Features:
Multiple Session Tracking: Displays high/low levels for major FX sessions:
Asian Session (Tokyo)
European Session (London)
US Session (New York)
5-Day Lookback: Captures the highest high and lowest low from each session over the previous 5 trading days
Visual Bands: Clear horizontal lines or filled zones showing session boundaries
Dynamic Updates: Automatically recalculates as new session data becomes available
How to Use:
Support/Resistance: Previous session highs/lows often act as key price levels
Breakout Trading: Watch for price breaking above/below session bands
Range Trading: Trade within the bands during consolidation periods
Session Overlap: Pay attention to multiple session bands converging
Ideal For:
Forex day traders
Session-based trading strategies
Support/resistance identification
Multi-timeframe analysis

Custom Daily Session Zones by KoenigseggCustom Daily Session Zones
🟣 Description
This indicator displays customizable trading session time zones as background highlights on your chart, on any timeframe you choose. The inline info tooltip provides the precise start and end times of the three largest market sessions—the US, the EU, and ASIA—for quick reference. It provides flexible control over session times for different days of the week, making it ideal for traders who need to visualize specific market hours or trading sessions.
🟣 Key Features
- Flexible Session Configuration: Set a common session time for all days or customize individual sessions for each day of the week
- Per-Day Control: Enable or disable sessions for specific days (Monday through Sunday)
- Color Customization: Choose unique colors for each day's session zones
- UTC Timezone Standard: All session times are defined in UTC to ensure consistency across charts
- Clean Visual Display: Non-intrusive background highlighting that doesn't interfere with price action
🟣 How to Use
- Common Session Mode: Use the default mode to apply the same session time across all enabled days
- Manual Per-Day Mode: Enable "Manual per-day sessions" to set different session times for each day
- Day Selection: Toggle individual days on/off based on your trading schedule
- Color Coding: Customize colors for each day to easily distinguish between different sessions
🟣 Technical Details
- Uses Pine Script v6 for optimal performance
- Implements proper session time detection using TradingView's built-in time functions
- Operates in UTC timezone for all session calculations
- Lightweight code that doesn't impact chart performance
🟣 Use Cases
- Highlight specific trading sessions (London, New York, Tokyo, etc.)
- Mark important market hours for your trading strategy
- Visualize different session overlaps
- Create custom trading time windows
- Track market activity during specific hours
🟣 Compatibility
- Works on all timeframes
- Compatible with all asset classes (Forex, Stocks, Crypto, Futures, etc.)
- Supports all TradingView chart types
- Responsive design that adapts to different screen sizes
🟣 Image Descriptions
- First Image (main image): Shows multiple New York Stock Exchange sessions from 1:30 p.m. to 8:00 p.m. (UTC), on the 15-minute timeframe, with each day’s zone colored differently to demonstrate the indicator’s customizable color settings.
- Second Image: A zoomed‑in fractal chart view of the same New York session on the 15-minute timeframe, illustrating how the background session zone appears even at higher detail levels.
Third Image: A close‑up of the New York session (1:30 p.m. to 8:00 p.m.) on the 3-minute timeframe, reaffirming the consistency of zone highlighting across different zoom levels.
🟣 Future Updates (v2)
In the next release, you’ll be able to define multiple session blocks per day—displaying two distinct colored zones within the same trading day. This will help you visualize when one market session ends and another begins without losing chart clarity.
🟣 Conclusion
This indicator is perfect for traders who need precise control over Market Session visualization and want to maintain a clean, professional chart appearance.
🟣 Disclaimer
This script is provided for educational and illustrative purposes only. It is not financial or trading advice, nor a recommendation to buy or sell any asset. Always conduct your own research and consult a professional before making any trading decisions.

FeraTrading Sessions High/LowThe FeraTradiang Sessions High/Low Indicator plots precise high and low levels for the New York, London, and Asian trading sessions — without any clutter.
We designed this tool for simplicity, clarity and accuracy, automatically adjusting to any timeframe and time zone — no manual setup required.
🔍 Key Features:
Clean horizontal lines marking session highs and lows
Lines start at the actual high/low
Session times:
New York: 09:30 – 17:00
London: 03:00 – 08:00
Asian: 18:00 – 03:00
Real-time updates that trail live candles
Only shows the most relevant sessions:
Yesterday’s NY
Last night’s Asia + morning continuation
Today’s London
Fully customizable:
Session colors
Session toggles
Label toggles
Line extension settings
Enable extended trading hours on your chart for best results.
Whether you're trading futures, forex, or crypto, this indicator provides clean session context without the mess. Open-source for extra customization and designed for real-time usability.

Advanced Session Profile Predictor with SR Boxes & ORAdvanced Session Profile Predictor with Momentum Arrows
Designed for intraday traders, this indicator analyzes price action across Asia, London, and New York sessions to predict market profiles and highlight key trading opportunities. By combining session-based profiling, Opening Range (OR) visualization, and momentum signals from Traders Dynamic Index (TDI), it offers a unique tool for anticipating trends, reversals, and breakouts. Ideal for forex, indices, and crypto on 15M–1H charts.
What Makes This Indicator Unique?
Unlike typical session indicators that only mark time zones or standard TDI scripts that focus on momentum, this tool:
Predicts market profiles (e.g., "Trend Continuation," "NY Manipulation") by analyzing session ranges and directional moves, offering actionable insights into how sessions interact.
Visualizes Opening Range (OR) boxes for the first 15 minutes of each session, helping traders spot early breakout levels.
Integrates TDI with momentum to generate precise bullish/bearish arrows, filtered by session context for improved reliability.
Simplifies decision-making with dynamic profile labels showing real-time long/short conditions based on price levels.
How Does It Work?
Session Tracking:
Asia (00:00–08:00 UTC, yellow), London (08:00–16:00 UTC, red), and New York (13:00–21:00 UTC, blue) sessions are highlighted with background colors and high/low lines (crosses).
OR boxes (first 15 minutes) are drawn for each session: yellow for Asia, red for London, blue for NY.
Profile Prediction:
Compares Asia and London session ranges and directions (e.g., trending if range > 1.5x 5-period SMA).
Examples:
Trend Continuation: Asia and London trend in the same direction—long above Asia high (uptrend) or short below Asia low (downtrend).
NY Manipulation: Asia trends, London consolidates—watch for NY breakouts at London high/low.
Displays the predicted profile and entry conditions in labels (e.g., "IF price hits 1.2000 LONG").
Momentum Arrows:
Uses TDI (RSI period 21, bands 34, fast MA 2) and 12-period momentum.
Green up arrow: Fast MA > upper band (>68) and momentum rising (bullish).
Red down arrow: Fast MA < lower band (<32) and momentum falling (bearish).
Support/Resistance (SR):
Plots dynamic SR boxes based on pivot highs/lows, filtered by volume (inspired by ChartPrime’s methodology, credited below).
How to Use It
Setup: Apply to a 15M–1H chart. Adjust time zone (default: UTC) and session times if needed. Customize TDI/momentum settings for sensitivity.
Trading:
Check the top-right labels for the current profile and entry conditions (e.g., "IF price hits LONG/SHORT").
Confirm entries with green up arrows (bullish) or red down arrows (bearish).
Use OR boxes and session high/low lines to identify breakout or reversal levels.
Example: In "NY Manipulation," wait for price to hit London high (long) or low (short) during NY session, confirmed by an arrow.
Best Markets: Forex (EUR/USD), indices (SPX500), crypto (BTC/USD) with sufficient intraday volatility.
Underlying Concepts
Session Profiling: Detects trends (range > SMA * threshold) and manipulation (e.g., London breaking Asia’s high/low) to predict NY behavior.
OR Boxes: Marks the first 15 minutes’ high/low as a breakout zone (time-based, 900,000 ms).
TDI + Momentum: Combines RSI-based bands with price change (close – close ) for momentum signals.
SR Boxes: Identifies pivots over a lookback period (default 20), scaled by ATR and filtered by volume thresholds.
Credits
The SR box logic is inspired by ChartPrime’s volume-filtered support/resistance methodology, adapted with custom breakout/hold detection. Original authors are credited for their foundational work.
Chart Setup
Displays session backgrounds, OR boxes, high/low lines, TDI arrows, and profile labels. Keep other indicators off for clarity.

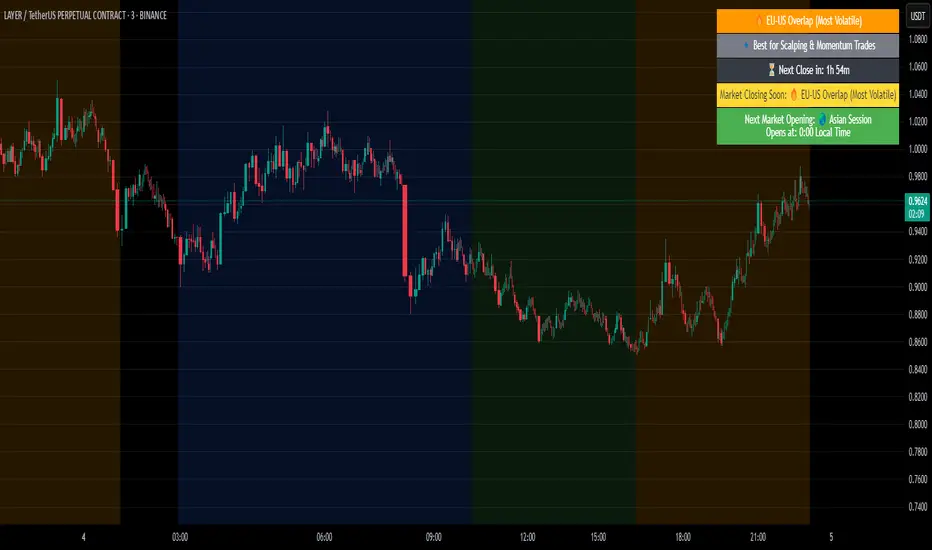
Crypto Market Session Guide with Local TimeMaster the Markets with the Ultimate Trading Session Indicator
Timing is everything in trading. Knowing when liquidity is at its peak and when market sessions overlap can make all the difference in your strategy. This Market Session Guide Indicator helps you navigate the trading day with real-time session tracking, countdown timers, and local time adjustments—giving you a clear edge in the market.
Key Features
Live Session Tracking – Instantly see which trading session is active: Asian, European, US, or the high-volatility EU-US overlap.
Automatic Local Time Conversion – No need to convert UTC manually—session times adjust automatically based on your TradingView exchange settings.
Daylight Saving Time Adjustments – The US market opening and closing times are automatically adjusted for summer and winter shifts.
Countdown Timer for Session Close – Know exactly when the current session will end so you can time your trades effectively.
Next Market Opening Display – Always be prepared by knowing which market opens next and at what exact time in your local timezone.
Clear Visual Guide – A structured table in the top-right of your chart provides all essential session details without cluttering your screen.
How It Works
This indicator tracks the three main trading sessions:
Asian Session (Tokyo, Sydney): 00:00 - 09:00 UTC
European Session (London, Frankfurt): 07:00 - 16:00 UTC
US Session (New York, Chicago): 13:30 - 22:00 UTC (adjusts automatically for Daylight Saving Time)
EU-US Overlap: 12:00 - 16:00 UTC, the most volatile period of the trading day
It also highlights when a session is about to close and when the next one will begin, ensuring you are always aware of liquidity shifts in the market.
Why You Need This Indicator
Optimized for Forex, Crypto, and Indices – Helps traders align their strategies with the most active market hours.
Ideal for Scalping and Day Trading – Enter trades during peak volatility to maximize opportunities.
Eliminates Guesswork – Stop manually tracking time zones and market schedules—everything updates dynamically for you.
Upgrade Your Trading Strategy Today
This indicator simplifies market timing, ensuring you're always trading when liquidity and volatility are at their highest. Whether you're trading Forex, Crypto, or Stocks, knowing when markets open and close is essential for making informed decisions.
Try it out, and if you find it useful, consider sharing it with other traders. Your feedback is always welcome!
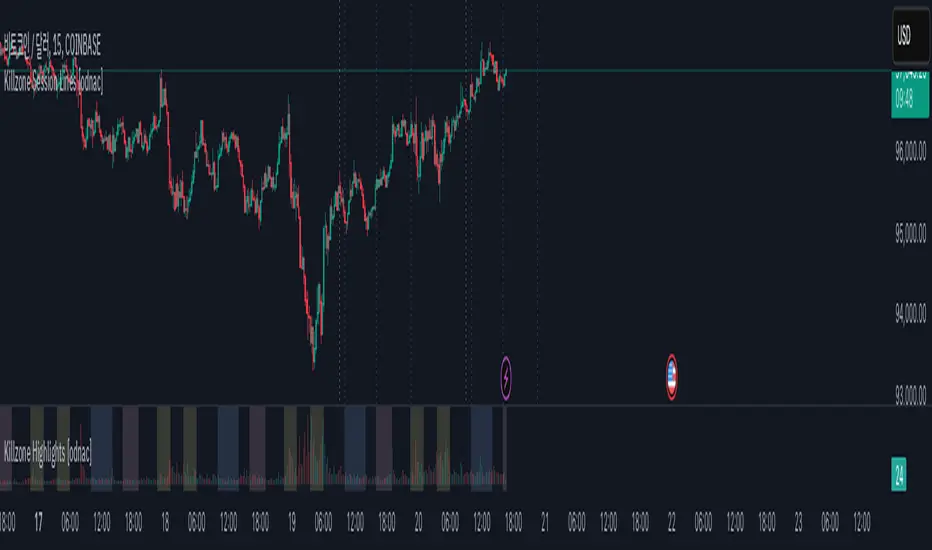
Killzone Session Lines [odnac]This Pine Script indicator displays vertical lines marking the start of key market sessions, known as Killzones, for both today and yesterday. These lines help traders identify important trading hours for the Asia, Europe, and New York sessions.
Killzone Vertical Lines:
Draws vertical lines for the start of the Asia, Europe, and New York sessions.
Displays lines for both today and the previous day to compare price action across sessions.
Customizable Time Settings:
Users can set the exact start hour and minute for each Killzone.
Time zones adjust automatically based on the chart's time zone.
Visual Customization:
Change the color, width, and style of the vertical lines (solid, dotted, dashed).
Toggle each session's lines individually for a cleaner chart.
Previous Start Lines:
Optional lines for the opening of today, the previous day, and the previous week, providing historical context for support and resistance levels.
Why Use This Indicator?
Session Awareness: Know exactly when major market sessions start to identify potential volatility spikes.
Historical Context: Compare today’s price action with previous sessions to spot recurring patterns.
Clean Charting: Automatic updates prevent clutter, keeping your workspace organized.
Flexible Customization: Tailor the display to fit your trading style and preferences.
AMD Session Structure Levels# Market Structure & Manipulation Probability Indicator
## Overview
This advanced indicator is designed for traders who want a systematic approach to analyzing market structure, identifying manipulation, and assessing probability-based trade setups. It incorporates four core components:
### 1. Session Price Action Analysis
- Tracks **OHLC (Open, High, Low, Close)** within defined sessions.
- Implements a **dual tracking system**:
- **Official session levels** (fixed from the session open to close).
- **Real-time max/min tracking** to differentiate between temporary spikes and real price acceptance.
### 2. Market Manipulation Detection
- Identifies **manipulative price action** using the relationship between the open and close:
- If **price closes below open** → assumes **upward manipulation**, followed by **downward distribution**.
- If **price closes above open** → assumes **downward manipulation**, followed by **upward distribution**.
- Normalized using **ATR**, ensuring adaptability across different volatility conditions.
### 3. Probability Engine
- Tracks **historical wick ratios** to assess trend vs. reversal conditions.
- Calculates **conditional probabilities** for price moves.
- Uses a **special threshold system (0.45 and 0.03)** for reversal signals.
- Provides **real-time probability updates** to enhance trade decision-making.
### 4. Market Condition Classification
- Classifies market conditions using a **wick-to-body ratio**:
```pine
wick_to_body_ratio = open > close ? upper_wick / (high - low) : lower_wick / (high - low)
```
- **Low ratio (<0.25)** → Likely a **trend day**.
- **High ratio (>0.25)** → Likely a **range day**.
---
## Why This Indicator Stands Out
### ✅ Smarter Level Detection
- Uses **ATR-based dynamic levels** instead of static support/resistance.
- Differentiates **manipulation from distribution** for better decision-making.
- Updates probabilities **in real-time**.
### ✅ Memory-Efficient Design
- Implements **circular buffers** to maintain efficiency:
```pine
var float manipUp = array.new_float(lookbackPeriod, 0.0)
var float manipDown = array.new_float(lookbackPeriod, 0.0)
```
- Ensures **constant memory usage**, even over extended trading sessions.
### ✅ Advanced Probability Calculation
- Utilizes **conditional probabilities** instead of simple averages.
- Incorporates **market context** through wick analysis.
- Provides **actionable signals** via a probability table.
---
## Trading Strategy Guide
### **Best Entry Setups**
✅ Wait for **price to approach manipulation levels**.
✅ Confirm using the **probability table**.
✅ Check the **wick ratio for context**.
✅ Enter when **conditional probability aligns**.
### **Smart Exit Management**
✅ Use **distribution levels** as **profit targets**.
✅ Scale out **when probabilities shift**.
✅ Monitor **wick percentiles** for confirmation.
### **Risk Management**
✅ Size positions based on **probability readings**.
✅ Place stops at **manipulation levels**.
✅ Adjust position size based on **trend vs. range classification**.
---
## Configuration Tips
### **Session Settings**
```pine
sessionTime = input.session("0830-1500", "Session Hours")
weekDays = input.string("23456", "Active Days")
```
- Match these to your **primary trading session**.
- Adjust for different **market opens** if needed.
### **Analysis Parameters**
```pine
lookbackPeriod = input.int(50, "Lookback Period")
low_threshold = input.float(0.25, "Trend/Range Threshold")
```
- **50 periods** is a good starting point but can be optimized per instrument.
- The **0.25 threshold** is ideal for most markets but may need adjustments.
---
## Market Structure Breakdown
### **Trend/Continuation Days**
- **Characteristics:**
✅ Small **opposing wicks** (minimal counter-pressure).
✅ Clean, **directional price movement**.
- **Bullish Trend Day Example:**
✅ Small **lower wicks** (minimal downward pressure).
✅ Strong **closes near the highs** → **Buyers in control**.
- **Bearish Trend Day Example:**
✅ Small **upper wicks** (minimal upward pressure).
✅ Strong **closes near the lows** → **Sellers in control**.
### **Reversal Days**
- **Characteristics:**
✅ **Large opposing wicks** → Failed momentum in the initial direction.
- **Bullish Reversal Example:**
✅ **Large upper wick early**.
✅ **Strong close from the lows** → **Sellers failed to maintain control**.
- **Bearish Reversal Example:**
✅ **Large lower wick early**.
✅ **Weak close from the highs** → **Buyers failed to maintain control**.
---
## Summary
This indicator systematically quantifies market structure by measuring **manipulation, distribution, and probability-driven trade setups**. Unlike traditional indicators, it adapts dynamically using **ATR, historical probabilities, and real-time tracking** to offer a structured, data-driven approach to trading.
🚀 **Use this tool to enhance your decision-making and gain an objective edge in the market!**

Normalised ATR - Configurable Session Volatility AnalysisThis indicator analyzes price volatility across different trading sessions throughout the day. Here are its key features:
1. **Configurable Time Periods**
- Users can set specific date ranges for analysis
- Supports up to 12 customizable trading sessions
- Adjustable session durations (1-8 hours each)
2. **Volatility Measurements**
- Offers two calculation methods:
* Normalized Range: (High-Low)/Midpoint Price × 100 (as percentage)
* Absolute Range: Simple High-Low difference
- Tracks key statistics for each session:
* Maximum range
* Minimum range
* Average range
* 25% quartile range
3. **Statistical Analysis**
- Calculates 5th and 95th percentiles across all sessions
- Provides visual reference lines for these percentiles
- Shows detailed statistics in a color-coded table
4. **Visual Display**
- Clear tabular display of session statistics
- Color-coded for easy reading
- Plot of daily ranges with percentile bounds
- Session times displayed in UTC
This tool is particularly useful for:
- Understanding market volatility patterns across different trading sessions
- Identifying optimal trading hours
- Planning trading strategies based on historical volatility patterns
- Comparing volatility across different market periods

Average Session Range [QuantVue]The Average Session Range or ASR is a tool designed to find the average range of a user defined session over a user defined lookback period.
Not only is this indicator is useful for understanding volatility and price movement tendencies within sessions, but it also plots dynamic support and resistance levels based on the ASR.
The average session range is calculated over a specific period (default 14 sessions) by averaging the range (high - low) for each session.
Knowing what the ASR is allows the user to determine if current price action is normal or abnormal.
When a new session begins, potential support and resistance levels are calculated by breaking the ASR into quartiles which are then added and subtracted from the sessions opening price.
The indicator also shows an ASR label so traders can know what the ASR is in terms of dollars.
Session Time Configuration:
The indicator allows users to define the session time, with default timing set from 13:00 to 22:00.
ASR Calculation:
The ASR is calculated over a specified period (default 14 sessions) by averaging the range (high - low) of each session.
Various levels based on the ASR are computed: 0.25 ASR, 0.5 ASR, 0.75 ASR, 1 ASR, 1.25 ASR, 1.5 ASR, 1.75 ASR, and 2 ASR.
Visual Representation:
The indicator plots lines on the chart representing different ASR levels.
Customize the visibility, color, width, and style (Solid, Dashed, Dotted) of these lines for better visualization.
Labels for these lines can also be displayed, with customizable positions and text properties.
Give this indicator a BOOST and COMMENT your thoughts!
We hope you enjoy.
Cheers!

New York Sessions Morning, Lunch and afternoon. AMKDescription
The script is designed to highlight the New York Stock Exchange's trading day, broken down into three specific sub-sessions: morning, lunchtime, and afternoon. Each sub-session is color-coded to provide an immediate visual cue about which portion of the trading day is currently active. Additionally, this script allows the user to adjust the time zone offset, making it adaptable for traders in different time zones around the world.
Originality
While there are scripts that highlight the entire trading day or specific market hours, this script adds granularity by breaking down the New York trading session into its typical behavioral parts: the morning rush, the lunchtime lull, and the afternoon action. The addition of an adjustable time zone offset is a unique feature that makes the tool more versatile and accommodating to a global user base.
Usefulness
The ability to visualize these different trading sessions can be valuable for various types of traders:
Day Traders: The script helps to immediately identify which session they are in, aiding in their trading strategy as market behavior can vary between these periods.
Swing Traders: They may use these sub-sessions to time their entries or exits, especially if they're based in different time zones.
Market Analysts: The color-coded sessions provide a quick way to analyze the historical performance and volatility of an asset during different trading periods.
Global Traders: The time zone adjustment feature makes it easy for traders outside of the Eastern Time Zone to customize the script according to their local time, increasing its utility across different markets.
Educational Purpose: For new traders, this could serve as an educational tool to understand the typical behavior of the stock market at different times of the day.
So, whether you're timing an intraday entry or looking for patterns tied to specific market sessions, this script offers a straightforward, visual way to keep track of where you are in the trading day.
Futures Exchange SessionsIn the 24-hour trading of the futures market, this indicator provides the user with full customization concerning the most important factor: time. This indicator is centered around three main visualizations: labels, backgrounds, and lines that minimalistically allows the user to keep track of the many time intervals that occur during a futures market 24-hour trading cycle. It also artfully displays the previous days highs and lows. And everything can be individually toggled and configured so the user can get exactly what they want.
Labels
There are three main futures market sessions in a 24-hour period: the London, New York, and Asian Sessions. Each session is given an independent label for the open and close times. The six labels (LO, LC, NYO, NYC, AO, AC) can be individually toggled on or off, the label background color changed, the text switched between black or white, and the height can be lowered or raised. These customizations are intended to give the user full control of the session they are interested in at the moment.
Backgrounds
Backgrounds are the heart of this indicator. There are different colored transparent backgrounds for each of the futures sessions. So the user can clearly see the session they want to highlight without cluttering their chart and getting in the way of analyzing the candles.
If you are familiar with the London and New York killzones, these backgrounds are each individually configured.
If you are familiar with the Inner Circle Trader’s (ICT) NY Morning and Afternoon sessions, these are available. Also, most times weird price action occurs during the lunch hour of these sessions. The London and New York have a background for their respective lunch hours so the user is never caught of guard during these periods.
Lines
The markets are constantly looking for liquidity. To help the user see runs on liquidity, this indicator projects the previous days highs and lows on to the current day with a line and a price label. The line make it very easy to see where price may be headed. See the image below for the perfect example of this phenomenon. Each of the lines can be independently controlled by color, style, and width. And even the labels can be toggled on or off if the user would prefer just to see the lines. Lastly, there is a line that marks the midnight open price in EST.
Special Notes
This indicator is specifically designed for futures tickers.
All of the backgrounds are not designed to be turned on a once (there are many that overlap). They are designed to give the user ultimate control over exactly what timeframe backgrounds to display on their charts.
The labels only appear when timeframe is 1 hour or less.

Volume by SessionThis indicator shows volume separated by session. The aim is clarify which session a volume bar occurred in and how it compares to the average of that session - NOT ALL SESSIONS.
The logic is that there is little value comparing for example the volume of the London session against volume of the London-NY session - the London-NY will always have higher volume. But how does today's london compare to yesterdays london or the london average.
The indicator has moving averages that only consider the average of previous episodes of the same session - so the average on the london session is the average of the past 5 london sessions (NY and asia and London-NY are not included in the calculation of the MA).
The indicator goes as high as 1H timeframe and the average line does not function below 5 mins - thats a limitation on available data to calculate it.
There's also a 'dark screen' function. Thats because I like a black background so the colours need to be inverted.
Hope its useful. Good luck.
John

sima-Prev HTF & Sessions (Tehran)This indicator automatically plots the Opening, Closing, High, and Low levels of the major global trading sessions: London, New York, and Asia. It is designed to help traders visualize intraday liquidity zones, session-based volatility, and potential reaction levels where price commonly expands or reverses.
The script includes fully adjustable session times and highlights each session using clean visual markers so traders can easily identify market structure within different time windows. By displaying the Open, Close, High, and Low of each session, the indicator helps forecast areas of interest such as breakout levels, range boundaries, and session-based support/resistance.
This tool is especially useful for intraday traders, scalpers, and anyone who relies on session dynamics to analyze market behavior. It works on all timeframes and all markets, including Forex, indices, metals, and crypto. No repainting is used; all levels are plotted based on completed session data.
