Impactful pattern and candles pattern AlertThe Alertion indicator!
impactful pattern:
pattern that happen near the zone or in the zone at lower timeframe and give us entry and stop limit price.
It is helpful for price action traders and those who want to decrease their risk.
There are 3 IP patterns:
Quasimodo
Head and shoulder
whipsaw engulfing
These patterns may occur near the zone or may not occur but by them, you can decrease your trading risk for example you can
trade with half lot before IP pattern and enter with other half after pattern.
how to use?
for example:
you find zone at 1h timeframe for short position
when price enter to your zone
you run this indicator and choose your lower timeframe, for example 15m and click on short position.
Then make the alert by right-click on your chart and choose the add alert and at condition box choose the impactful pattern and then click on create
now wait for message :)
Candles pattern:
like reversal bar, key reversal bar, exhaustion bar, pin bar, two-bar reversal, tree-bar reversal, inside bar, outside bar
these occur when the trend turn, so it is usable when the price enter to your zone or near your zone.
This pattern can decrease your risk.
Inside bar and outside bar:
if this pattern engulf up, it is bullish pattern and if engulf down, it is bearish pattern.
what does this indicator do?
this indicator is for making alert
it helps you to decrease your risk and failure.
You optimize it to alert you when IP pattern happen or candle pattern happen or inside bar or outside bar engulfing or all of them.
For IP pattern, it will message you entry and stop limit price.
It works at 2 different timeframes, so you can make alert for example in 1h TF for candles pattern and 15m TF for IP pattern.
Indicator will alert you for candles pattern at your chart timeframe and for IP pattern at timeframe you've chosen when you run the indicator, and it is changeable
in setting.
setting options
TIMEFRAME
IP: select the timeframe for IP patterns it means when IP pattern happen at that timeframe the indicator will alert you
example = your TF is 1h, you found the supply zone and want to trade, note that IP pattern happen in lower TF, so you select 15m TF or TF lower than 1h.
Short position: select it if you want to make short position.
BUFFERING
indicator send you entry and stop limit price
you can change it by amount of percent
it is your strategy to change your entry and stop loss or not
example= in head and shoulder pattern at short position, the stop limit is high price of head in pattern
so the indicator will message you the exact price but if you want to put
your stop limit 5 percent upper than exact price you can enter 5 in front of stop loss
or you want to enter 5 percent lower than exact high price of shoulder, you can optimize it.
ALERTION
you choose what alert you want
IP alert or candle alert or inside and outside bar alert
type your text for alert
you can write additional text for your message
ADVANCE
IP alert frequency option:
1. Once per bar : indicator will alert you for IP pattern once at your chat timeframe bar, and you should wait til next bar for next alert.
2. Once per bar close : alert you when your chart timeframe bar closed and next alert will happen when next bar is closed.
3. All: alert you all the times IP pattern happen
pivot left and right bars: lower will find smaller pattern
at the END:
this indicator is not strategy
it is part of your strategy that help you to increase your winning rate.
It is helpful for scalping and candle patterns finding.
After you make an alert, you can delete the indicator or change your timeframe or make another alert, your previous alert won’t change.
Thank you all.
In den Scripts nach "scalping" suchen

Relative Andean ScalpingThis is an experimental signal providing script for scalper that uses 2 of open source indicators.
First one provides the signals for us called Andean Oscillator by @alexgrover . We use it to create long signals when bull line crosses over signal line while being above the bear line. And reverse is true for shorts where bear line crosses over signal line while being above bull line.
Second one is used for filtering out low volatility areas thanks to great idea by @HeWhoMustNotBeNamed called Relative Bandwidth Filter . We use it to filter out signals and create signals only when the Relative Bandwith Line below middle line.
The default values for both indicators changed a bit, especially used linreg values to create relatively better signals. These can be changed in settings. Please be aware that i did not do extensive testing with this indicator in different market conditions so it should be used with caution.

TrapLightTrap Light is built off the stochastic RSI to provide convenience and make your entries while scalping either long/short more straightforward.
Notes/Disclaimer:
This indicator is not guaranteed to work every time. Use it at your own discretion and perform your own due diligence. None of this is financial advice.
The main idea behind this is that when the stochastic RSI reaches such extremes that it often moves in a favorable direction.
K = momentum or the blue line of the stochastic RSI indicator.
Perks:
Don't have to look away from candlesticks and measure stochastic RSI's K level.
Simple visual indication of what to do.
Don't have to stare at your chart all day waiting for things to get exciting.
How to Use:
(Above the current candlestick on any timeframe)
1. When K is greater than or equal to 99.5, it shows a sell signal. This is to indicate a short entry.
2. When K is less than or equal to 0.5, it shows a buy signal. This is to indicate a long entry.
3. If neither the conditions for a short/long entry are present, it shows a circle that is like a traffic light.
Red Light: When K is between 99.5 and 95, a red circle is shown to indicate that a short entry may be available soon.
Yellow Light: When K is between 95 and 5, a yellow circle is shown to indicate that neither a long nor short entry may be available soon.
Green Light: When K is between 5 and 0.5, a green circle is shown to indicate that a long entry may be available soon.
Alerts:
Set an alert on the ticker you trade to notify you when either the green or red light is present so that you have time to prepare to make an entry either long/short.
The Code:
The PineScript is open-source and annotated to explain different parts of the script for ease of understanding.
@Credit to Kingson1 for this strategy and his feedback on its creation/implementation.

Pips-Stepped PDFMA [Loxx]Pips-Stepped PDFMA is and Pips-stepped moving average that uses a probability density function moving average. This is tuned for Forex. You must adjust the step size to extreme levels for this to work for crypto or stocks. Try 30000 for BTC on the daily chart, for example.
What is Probability Density Function?
Probability density function based MA is a sort of weighted moving average that uses probability density function to calculate the weights.
Included:
Bar coloring
Alerts
Expanded source types
Signals
Flat-level coloring for scalping

Kam+ ScalpingThis study project is a Scalping trading Tool that incorporates the majority of the indicators needed to analyse and scalp Trends for 1min, 5min or 15min charts. Incorporated within this tool are the following indicators:
1. Major industry (Banks) recognised important SMAs
3SMA
2. Kijun Sen+ for entry
3. Atr Stop Loss For Stop Loss Entry/Exit.
Hint:- Use With Rsi Time Frame 15 min Custom, And Volume Flow Indicator For Trade Conformation

SP IndicatorSP Indicator - One of the best indicators for scalping trading on any timeframes. The best readings are given on 5, 15 and 30 minute frames.
For readings, several indicators are combined into one, which allows you to get a more accurate forecast, which is more than 90%.
Instruction.
The indicator is easy to use. Just install it and follow the arrows to go long or short. Stop loss set small, about 1-2%. In most cases, this is sufficient.
Good luck in bidding!
Wick/ Long / Short Monitor- Wanted to check if price movement on a particular candle for day trading is less than my target movement.
- A user can place this on chart and on the candles where the price movement is not as predicted from the open price, a red * will be placed above or below the bar
- it is best used in fixed profit scalping strategy

Simple Moving Averages (10 & 20 & 50 & 200) for ScalpingSimple Moving Averages for Scalping (10 / 20 / 50 / 200 SMAs)

Imbalance Identifier With Target BoxTarget Area to help me with my target area for visual reference
Imbalance Identifier - Helps me to see where the trade may come back to
EMA on 1 Minute Time frame for helping to identify Direction to take trades in
I primarily use this as a tool to help me identify very short term direction for scalping small target area (Adjustable)
Preset for the main 28 Forex Pairs, US30,US100,US500 Dax40 and Gold on the 1 Minute timeframe

NazhoThis is a simple scalping strategy that works for all time frames... I have only tested it on FOREX
It works by checking if the price is currently in an uptrend and if it crosses the 20 EMA .
If it crosses the 20 EMA and its in and uptrend it will post a BUY SIGNAL.
If it crosses the 20 EMA and its in and down it will post a SELL SIGNAL.
The red line is the highest close of the previous 8 bars --- This is resistance
The green line is the lowest close of the previous 8 bars -- This is support
+SuperTrend

Reversal zone finderThis script would find potential reversal price zones according to RSI over bought or sell condition and big reversal candle.
It works better in range markets and lower time frames like 5M and especially in Support/Resistance zones.
Suit for scalping in forex or crypto markets.
* Use it as a trade assistant not a trade signal!

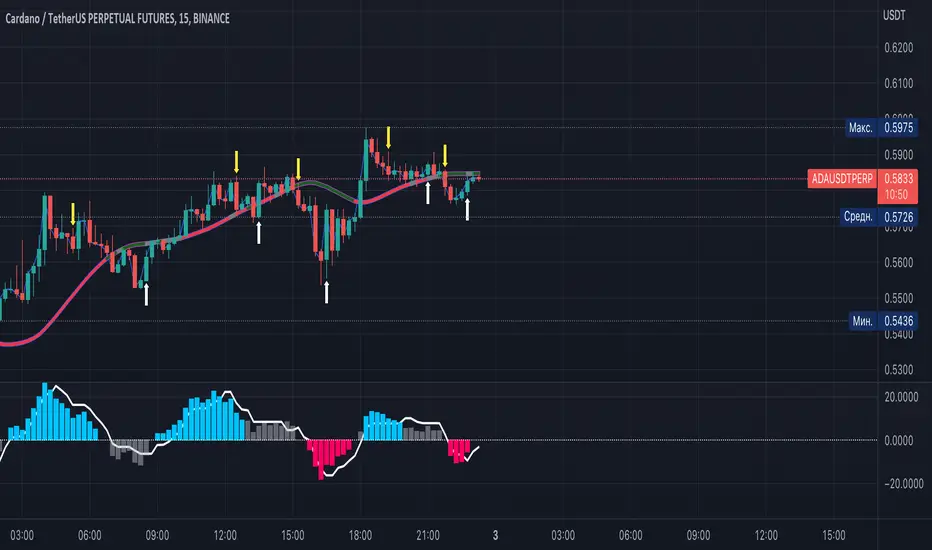
Rolling VWAP - Vhunt Scalper botBINANCE:ADAUSDTPERP
Modified VWAP to use scalping in lower timeframe.
Use 1minute TF for best results but can also use up to 30min.
This indicator is made for crypto but may also work for other assets.
The bands serve as support and resistance and used for opening quick profit position if conditions below are met:
Indicators:
Blue - modified rolling vwap
Orange - Band1
Green - Band2
Opening position Conditions:
Long:
Band2 < Band1
Price < Band2
Short:
Band2 > Band1
Price > Band2

Scalp ProScalp Pro is a scalping tool that uses the MACD mechanism. MACD lines are smoothed using fibonacci numbers and pi numbers. In this way, the noise on the signal is reduced. A " BUY " signal is generated when the lines cross upwards. If the lines cross down, a " SELL " signal is generated. The logic is very simple and the Indicator is very useful.
I wish you many profitable trades.


CCI45/SMA50 indy for 30 min SP500SPCFD:SPX
The script determines entry points using 45 period CCI and 50 period SMA.
Long condition: When CCI crosses up 150 treshold while price above 50 period SMA
Short condition: When CCI crosses down -150 treshold while price below 50 period SMA
Trades are executed above/below 1 point of high/low for long/short positions. Stops are just 1 point below/above of SMA. After 4 points of profit stops should be tightened. If you do not plan to hold the position for a long time, it can produce quick profit within 5-6 bars namely 2.5-3 hour. Otherwise you can manage the trade using SMA as trailing stop. This can be treated as a strategy of scalping which turns out a trend trading eventually if conditions good.
Have a nice trading

TMA + OSMA Scalping SystemSystem is based on TMA Bands + OSMA + EMA Zone. Signal is generated when:
- price recently touched lower or upper band
- price is crossing EMA Zone
- OSMA is aligned in direction of trade to be taken
Natural Target would be opposite band set by TMA.

Ultimate VWAP Bands- Ultimate VWAP Bands is a script that helps to decide and further clarify areas of oversold and overbought conditions.
- For example, when the price is in the lowest band it is extremely oversold relative to the VWAP . Hence it should be considered a good place to buy with a high risk to reward payoff.
- Each band is set at a fixed offset away from the VWAP . The "VWAP Band Multiplier" adjusts this and is a key part of the script. This allows the indicator to be adjusted based on the assets volatility . For example, with Crypto. A multiplier of 1 would be strongly advised. Whilst a multiplier of 0.1-0.25 would be useful for currency pairs.
- This indicator can be used for all manners of trading. However, it is most effective when used for scalping and swing trading.

mForex - Keltner channel + EMA Scalping systemTransaction setup parameters
Time frame: M5, M15
Currency pair: EUR / USD , GPB / USD
Transaction: London, USA
Number of orders / day: 10 - 15 orders
Trading strategies
=== BUY ===
Candles close on the upper Keltner
EMA10 crosses the upper Keltner range from below
Stop loss in the middle band or up to 12 pips
Profit target: 15-25 pips
=== SELL ===
Candles close below Keltner below
EMA10 crosses the Keltner range below from above
Stop loss in the middle band or up to 12 pips
Profit target: 15-25 pips

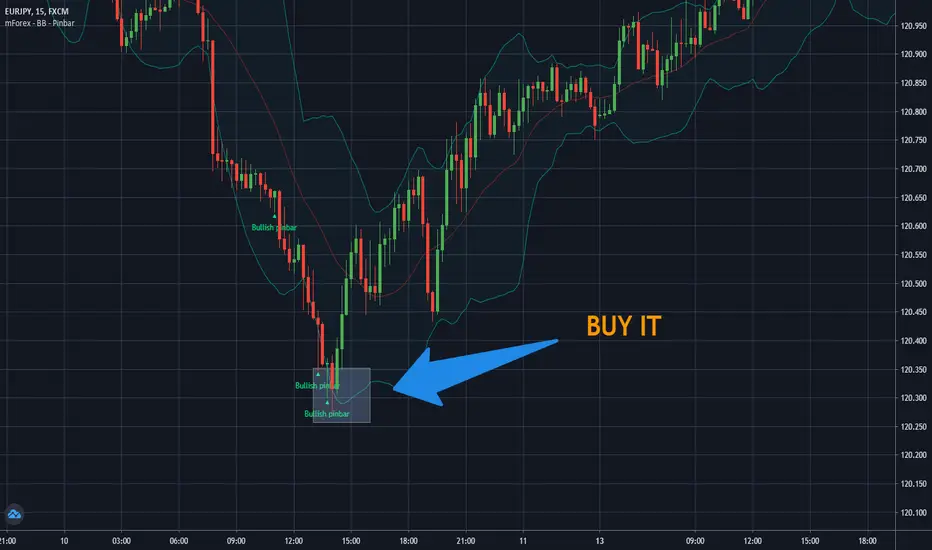
mForex - Bollinger Bands - Pinbar scalping systemTransaction setup parameters
Time frame: M5, M15
Currency pair: Any except XAU/USD
Trading strategies
=== BUY ===
Price break out of the lower Bollinger Bands
The Pinbar reversal candlestick appears and closes the candle on the lower Bollinger Bands
Stop loss: Nearest bottom + 3-5 pips
Profit target: 10-20 pips
=== SELL ===
Price break out of the upper Bollinger Bands
The Pinbar reversal candle appeared and closed below the upper
Stop loss: Nearest peak + 3-5 pips
Profit target: 10-20 pips
* If you have any questions or suggestions for this strategy, feel free to ask us.
ADD for SPX intraday (NYSE Adv-Decl) -Tom1traderThis is the NYSE Advancers - decliners which the SPX pretty much follows. You can chart it like any index (ADD -NYSE $ADV MINUS $DECL) but I find it more useful in a separate panel with colors for direction.
The level gives an idea of days move (example: plus or minus 500 is not much movement through the session) but I follow the direction as when more stocks advance (green) or decline (red) the index tends to track it pretty closely.
On SPX, SPY and correlateds - very useful for intra-day trading (Scalping or 0DTE option trades) but not for higher time frames at all. If you chart the ADD in a chart and compare 5 minute to daily you will see what I mean.
I left it at 5 minutes timeframe which displays well on any intraday chart. You can change it by changing the "5" in the security function on line 13 to what you want ("1" 1 minute, "15" 15 minutes) or change it to timeframe.period (no quotes) so that it will follow the timeframe of the current chart. I like 5 min as it displays better on higher timeframes i.e. 15 min. or hour.
A simple moving average with a length of 10 is added to help gauge momemtum.
Hope this helps with trading or scripting ideas, questions or feed back welcome. Keep Smiling.

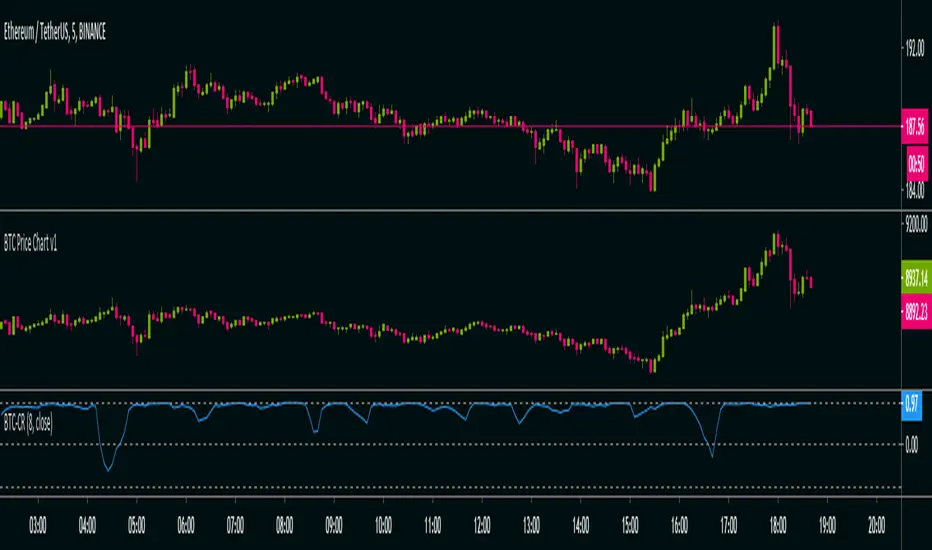
BTC Co-Relation v1Calculate Pearson-correlation-coefficient of selected cryptocurrency with Bitcoin average price of 10 different exchanges.
This is helpful in scalping(at least for me), by using this we can find co-relation between a cryptocurrency and Bitcoin .
Here we are using Bitcoin average price of 10 different exchanges.
It is an oscillator with minimum value -1 and maximum value +1.
👉-1 means current selected cryptocurrency price is completely out of relation with Bitcoin price, means Bitcoin price increasing and it's price decreasing or Bitcoin price decreasing and it's price increasing in selected time-frame.
👉+1 means current selected cryptocurrency price is completely in co-relation with Bitcoin price, means Bitcoin price increasing and it's price also increasing or Bitcoin price decreasing and it's price also decreasing in selected time-frame.
Happy trading 👍.
DB-X + DSMAJust a quick hack to combine both studies. Could be used for scalping or whatever you find it useful for... ;)
Alerts should work but no backtesting done on it.

M waves Mk3 'Magical M's v1
V2
V3
So I forgot this existed so here is the Opened sourced code (pm me for older sorce code there are 600+ Saves)(pm me for other scrips course code too lazy to republish everything)
Changes: Simplified and annotated code/upgraded to v4 format
as always adjust before using
i use this indicator combined with the other frequency one to help me identify time and direction of next move.
Pair with rsi
Pair with detrended tsi (have unpublished script might share later)
‘Redraw’ safe
Slightly detrented(adjustable) to avoid traps
quick how to use:
Meant as and adjustable indicator to “tune" to personal risk/reward preference
Green means buy red means sell
arrow indicators for long term sell and buy
Highly customizable (candles too)
Check out my profile for previous versions they are less customizable but also easier to get started with
similar to rsi you want to buy/sell when the indicator turns green/red and lines are as pinched as posible (the lines that are being filled).
keep an eye on the other line that moves around ;) if its not matching the other 2 moving averages and the main color indicator chances are its a trap(works both ways)
use the candles to help you keep your eye on the indicator when scalping (look at the original post for some color ideas)
