AI Probabilistic OrderFlow Scalper⭐ Description:
📌 AI Probabilistic OrderFlow Scalper
This script combines Order Flow, Auction Market Theory, Volume Imbalance, Market Structure (HH/LL), RSI bias filtering, and a probability-based direction model inspired by AI and statistics.
It produces high-precision scalping entries designed for fast markets such as Futures, while remaining compatible with all markets (indices, crypto, forex, metals).
This is not a typical indicator — it is a probabilistic predictive model engineered to provide sniper entries, a tick-based Take Profit, a volatility-adaptive ATR Stop Loss, and optional Value Area levels (VAH/VAL/POC).
⭐ Main Features:
🔥 Directional probability model (AI-style weighted scoring)
📊 Order Flow imbalance (delta-like logic)
📈 HH/LL market structure detection
🎯 Smart RSI bias filter
🚀 One signal per trend shift (anti-spam)
🎯 Tick-based Take Profit (perfect for NQ / futures)
🛡️ ATR-based dynamic Stop Loss
📉 Value Area display: VAH, VAL, POC
🔊 Volume confirmation filter
📡 Directional probability plot
✔️ Works for Futures, Crypto, Forex, Indices
🧠 Probabilistic AI Approach
The model uses a 3-factor scoring system:
Order Flow imbalance
Market structure (HH/LL)
RSI trend bias
Each validated condition = 1 point.
The total score is converted into Buy/Sell probabilities, and the higher-probability direction is selected.
When probability exceeds the threshold (e.g. 80%), the system triggers a high-confidence sniper signal.
This mirrors Revenue Management logic:
→ Only take a decision when probability of success is maximized.
🎯 Buy/Sell Signals (Sniper Entries)
🔵 Green triangle under the candle = high-probability Buy
🔴 Red triangle above the candle = high-probability Sell
✔️ Only one signal per directional shift
✔️ Signals appear only when all strict filters are satisfied
📌 Automatic TP / SL
TP: fixed tick-based (e.g. 100 ticks for NQ scalping)
SL: ATR-based, adapts to volatility
TP/SL display can be enabled or disabled
Perfectly calibrated for high-speed scalping.
📘 How to Use
Use on every timeframe
Adjust probability threshold (75–90 recommended)
Enable strict mode for maximum precision
Let the model filter entries automatically
Choose a TP suitable for your market
Optionally display VAH/VAL/POC for Auction Theory context
Always test using backtesting before going live
🏆 Advantages
Extremely fast for scalping
High win-rate potential via probabilistic filtering
Clean signals (no noise or spam)
Combines the strongest trading frameworks:
Order Flow
Market Structure
Statistical modeling
Volume profiling
Automated risk management
In den Scripts nach "scalping" suchen

AI Probabilistic OrderFlow Scalper⭐ Main Name
AI Probabilistic OrderFlow Scalper
⭐Description:
📌 AI Probabilistic OrderFlow Scalper — Predictive Auction Theory Model for Futures
This script combines Order Flow, Auction Market Theory, Volume Imbalance, Market Structure (HH/LL), RSI bias filtering, and a probability-based direction model inspired by AI and Revenue Management.
It produces high-precision scalping entries designed for fast markets such as Nasdaq Futures (NQ), while remaining compatible with all markets (indices, crypto, forex, metals).
This is not a typical indicator — it is a probabilistic predictive model engineered to provide sniper entries, a tick-based Take Profit, a volatility-adaptive ATR Stop Loss, and optional Value Area levels (VAH/VAL/POC).
⭐ Main Features
🔥 Directional probability model (AI-style weighted scoring)
📊 Order Flow imbalance (delta-like logic)
📈 HH/LL market structure detection
🎯 Smart RSI bias filter
🚀 One signal per trend shift (anti-spam)
🎯 Tick-based Take Profit (perfect for NQ / futures)
🛡️ ATR-based dynamic Stop Loss
📉 Value Area display: VAH, VAL, POC
🔊 Volume confirmation filter
📡 Directional probability plot
✔️ Works for Futures, Crypto, Forex, Indices
🧠 Probabilistic AI Approach
The model uses a 3-factor scoring system:
Order Flow imbalance
Market structure (HH/LL)
RSI trend bias
Each validated condition = 1 point.
The total score is converted into Buy/Sell probabilities, and the higher-probability direction is selected.
When probability exceeds the threshold (e.g. 80%), the system triggers a high-confidence sniper signal.
This mirrors Hight probability decision:
→ Only take a decision when probability of success is maximized.
🎯 Buy/Sell Signals (Sniper Entries)
🔵 Green triangle under the candle = high-probability Buy
🔴 Red triangle above the candle = high-probability Sell
✔️ Only one signal per directional shift
✔️ Signals appear only when all strict filters are satisfied
📌 Automatic TP / SL
TP: fixed tick-based (e.g. 100 ticks for NQ scalping)
SL: ATR-based, adapts to volatility
TP/SL display can be enabled or disabled
Perfectly calibrated for high-speed scalping.
📘 How to Use
Use any timeframe
Adjust probability threshold (75–90 recommended)
Enable strict mode for maximum precision
Let the model filter entries automatically
Choose a TP suitable for your market
Optionally display VAH/VAL/POC for Auction Theory context
Always test using backtesting before going live
🏆 Advantages
Extremely fast for scalping
High win-rate potential via probabilistic filtering
Clean signals (no noise or spam)
Combines the strongest trading frameworks:
Order Flow
Market Structure
Statistical modeling
Volume profiling
Automated risk management

Smart RSI Money Flow - Core Bands V1.01SMART RSI – Money Flow Bands (Technical Overview)
1. Background: RSI and Its Behavior on Lower Timeframes
The Relative Strength Index (RSI) originally is a momentum oscillator calculated from average gains and losses over a selected period. In its standard form, RSI is derived solely from price changes; it does not incorporate volume data or order-flow information in its formula.
Because RSI is price-based, its interpretation depends strongly on the timeframe:
• On higher timeframes, each bar aggregates more trading activity, and RSI tends to behave more smoothly.
• On lower timeframes (1-hour down to intraday scalping intervals), price fluctuations are quicker, and RSI becomes more sensitive to short-term noise.
This does not imply that RSI becomes invalid, but that its signals on fast charts can be more reactive and may benefit from additional context such as volume behavior or structural information.
2. Purpose of This Indicator
This indicator extends the classical RSI by adding information that RSI does not include:
• Mapping RSI values into price-based bands instead of the 0–100 oscillator space.
• Retrieving lower timeframe volume data and separating it into buy and sell components.
• Comparing the slope (angle) of price movement with the slope of buy and sell volume.
The goal is to provide a structural interpretation of where price sits relative to RSI conditions and how volume is behaving on a lower timeframe.
3. Technical Differences Compared to Classical RSI
A) Classical RSI
• Input: price only (usually close).
• Output: normalized oscillator between 0 and 100.
• Does not incorporate intra-bar volume distribution.
• Does not separate buy/sell volume.
B) SMART RSI – Money Flow Bands
1) RSI-to-Price Mapping
Converts RSI values into upper/lower price bands using recent price extremes.
2) Lower Timeframe Volume Decomposition
Retrieves LTF data and splits each bar’s volume into buy (close>open) and sell (close

Smart Money Precision Structure [BullByte]Smart Money Precision Structure
Advanced Market Structure Analysis Using Institutional Order Flow Concepts
---
OVERVIEW
Smart Money Precision Structure (SMPS) is a comprehensive market analysis indicator that combines six analytical frameworks to identify high-probability market structure patterns. The indicator uses multi-dimensional scoring algorithms to evaluate market conditions through institutional order flow concepts, providing traders with professional-grade market analysis.
---
PURPOSE AND ORIGINALITY
Why This Indicator Was Developed
• Addresses the gap between retail and institutional analysis methods
• Consolidates multiple analysis techniques that professionals use separately
• Automates complex market structure evaluation into actionable insights
• Eliminates the need for multiple indicators by providing comprehensive analysis
What Makes SMPS Original
• Six-Layer Confluence System - Unique combination of market regime, structure, volume flow, momentum, price action, and adaptive filtering
• Institutional Pattern Recognition - Identifies smart money accumulation and distribution patterns
• Adaptive Intelligence - Parameters automatically adjust based on detected market conditions
• Real-Time Market Scoring - Proprietary algorithm rates market quality from 0-100%
• Structure Break Detection - Advanced pivot analysis identifies trend reversals early
---
HOW IT WORKS - TECHNICAL METHODOLOGY
1. Market Regime Analysis Engine
The indicator evaluates five core market dimensions:
• Volatility Score - Measures current volatility against 50-period historical baseline
• Trend Score - Analyzes alignment between 8, 21, and 50-period EMAs
• Momentum Score - Combines RSI divergence with MACD signal alignment
• Structure Score - Evaluates pivot point formation clarity
• Efficiency Score - Calculates directional movement efficiency ratio
These scores combine to classify markets into five regimes:
• TRENDING - Strong directional movement with aligned indicators
• RANGING - Sideways movement with mixed directional signals
• VOLATILE - Elevated volatility with unpredictable price swings
• QUIET - Low volatility consolidation periods
• TRANSITIONAL - Market shifting between different regimes
2. Market Structure Analysis
Advanced pivot point analysis identifies:
• Higher Highs and Higher Lows for bullish structure
• Lower Highs and Lower Lows for bearish structure
• Structure breaks when established patterns fail
• Dynamic support and resistance from recent pivot points
• Key level proximity detection using ATR-based buffers
3. Volume Flow Decoding
Institutional activity detection through:
• Volume surge identification when volume exceeds 2x average
• Buy versus sell pressure analysis using price-volume correlation
• Flow strength measurement through directional volume consistency
• Divergence detection between volume and price movements
• Institutional threshold alerts when unusual volume patterns emerge
4. Multi-Period Momentum Synthesis
Weighted momentum calculation across four timeframes:
• 1-period momentum weighted at 40%
• 3-period momentum weighted at 30%
• 5-period momentum weighted at 20%
• 8-period momentum weighted at 10%
Result smoothed with 6-period EMA for noise reduction.
5. Price Action Quality Assessment
Each bar evaluated for:
• Range quality relative to 20-period average
• Body-to-range ratio for directional conviction
• Wick analysis for rejection pattern identification
• Pattern recognition including engulfing and hammer formations
• Sequential price movement analysis
6. Adaptive Parameter System
Parameters automatically adjust based on detected regime:
• Trending markets reduce sensitivity and confirmation requirements
• Volatile markets increase filtering and require additional confirmations
• Ranging markets maintain neutral settings
• Transitional markets use moderate adjustments
---
COMPLETE SETTINGS GUIDE
Section 1: Core Analysis Settings
Analysis Sensitivity (0.3-2.0)
• Default: 1.0
• Lower values require stronger price movements
• Higher values detect more subtle patterns
• Scalpers use 0.8-1.2, swing traders use 1.5-2.0
Noise Reduction Level (2-7)
• Default: 4
• Controls filtering of false patterns
• Higher values reduce pattern frequency
• Increase in volatile markets
Minimum Move % (0.05-0.50)
• Default: 0.15%
• Sets minimum price movement threshold
• Adjust based on instrument volatility
• Forex: 0.05-0.10%, Stocks: 0.15-0.25%, Crypto: 0.20-0.50%
High Confirmation Mode
• Default: True (Enabled)
• Requires all technical conditions to align
• Reduces frequency but increases reliability
• Disable for more aggressive pattern detection
Section 2: Market Regime Detection
Enable Regime Analysis
• Default: True (Enabled)
• Activates market environment evaluation
• Essential for adaptive features
• Keep enabled for best results
Regime Analysis Period (20-100)
• Default: 50 bars
• Determines regime calculation lookback
• Shorter for responsive, longer for stable
• Scalping: 20-30, Swing: 75-100
Minimum Market Clarity (0.2-0.8)
• Default: 0.4
• Quality threshold for pattern generation
• Higher values require clearer conditions
• Lower for more patterns, higher for quality
Adaptive Parameter Adjustment
• Default: True (Enabled)
• Enables automatic parameter optimization
• Adjusts based on market regime
• Highly recommended to keep enabled
Section 3: Market Structure Analysis
Enable Structure Validation
• Default: True (Enabled)
• Validates patterns against support/resistance
• Confirms trend structure alignment
• Essential for reliability
Structure Analysis Period (15-50)
• Default: 30 bars
• Period for structure pattern analysis
• Affects support/resistance calculation
• Match to your trading timeframe
Minimum Structure Alignment (0.3-0.8)
• Default: 0.5
• Required structure score for valid patterns
• Higher values need stronger structure
• Balance with desired frequency
Section 4: Analysis Configuration
Minimum Strength Level (3-5)
• Default: 4
• Minimum confirmations for pattern display
• 5 = Maximum reliability, 3 = More patterns
• Beginners should use 4-5
Required Technical Confirmations (4-6)
• Default: 5
• Number of aligned technical factors
• Higher = fewer but better patterns
• Works with High Confirmation Mode
Pattern Separation (3-20 bars)
• Default: 8 bars
• Minimum bars between patterns
• Prevents clustering and overtrading
• Increase for cleaner charts
Section 5: Technical Filters
Momentum Validation
• Default: True (Enabled)
• Requires momentum alignment
• Filters counter-trend patterns
• Essential for trend following
Volume Confluence Analysis
• Default: True (Enabled)
• Requires volume confirmation
• Identifies institutional participation
• Critical for reliability
Trend Direction Filter
• Default: True (Enabled)
• Only shows patterns with trend
• Reduces counter-trend signals
• Disable for reversal hunting
Section 6: Volume Flow Analysis
Institutional Activity Threshold (1.2-3.5)
• Default: 2.0
• Multiplier for unusual volume detection
• Lower finds more institutional activity
• Stock: 2.0-2.5, Forex: 1.5-2.0, Crypto: 2.5-3.5
Volume Surge Multiplier (1.8-4.5)
• Default: 2.5
• Defines significant volume increases
• Adjust per instrument characteristics
• Higher for stocks, lower for forex
Volume Flow Period (12-35)
• Default: 18 bars
• Smoothing for volume analysis
• Shorter = responsive, longer = smooth
• Match to timeframe used
Section 7: Analysis Frequency Control
Maximum Analysis Points Per Hour (1-5)
• Default: 3
• Limits pattern frequency
• Prevents overtrading
• Scalpers: 4-5, Swing traders: 1-2
Section 8: Target Level Configuration
Target Calculation Method
• Default: Market Adaptive
• Three modes available:
- Fixed: Uses set point distances
- Dynamic: ATR-based calculations
- Market Adaptive: Structure-based levels
Minimum Target/Risk Ratio (1.0-3.0)
• Default: 1.5
• Minimum acceptable reward vs risk
• Higher filters lower probability setups
• Professional standard: 1.5-2.0
Fixed Mode Settings:
• Fixed Target Distance: 50 points default
• Fixed Invalidation Distance: 30 points default
• Use for consistent instruments
Dynamic Mode Settings:
• Dynamic Target Multiplier: 1.8x ATR default
• Dynamic Invalidation Multiplier: 1.0x ATR default
• Adapts to volatility automatically
Market Adaptive Settings:
• Use Structure Levels: True (default)
• Structure Level Buffer: 0.1% default
• Places levels at actual support/resistance
Section 9: Visual Display Settings
Color Theme Options
• Professional (Teal/Red)
- Bullish: Teal (#26a69a)
- Bearish: Red (#ef5350)
- Neutral: Gray (#78909c)
- Best for: Traditional traders, clean appearance
• Dark (Neon Green/Pink)
- Bullish: Neon Green (#00ff88)
- Bearish: Hot Pink (#ff0044)
- Neutral: Dark Gray (#333333)
- Best for: Dark theme users, high contrast
• Light (Green/Red Classic)
- Bullish: Green (#4caf50)
- Bearish: Red (#f44336)
- Neutral: Light Gray (#9e9e9e)
- Best for: Light backgrounds, traditional colors
• Vibrant (Cyan/Magenta)
- Bullish: Cyan (#00ffff)
- Bearish: Magenta (#ff00ff)
- Neutral: Medium Gray (#888888)
- Best for: High visibility, modern appearance
Dashboard Position
• Options: Top Left, Top Right, Bottom Left, Bottom Right, Middle Left, Middle Right
• Default: Top Right
• Choose based on chart layout preference
Dashboard Size
• Full: Complete information display (desktop)
• Mobile: Compact view for small screens
• Default: Full
Analysis Display Style
• Arrows : Simple directional markers
• Labels : Detailed text information
• Zones : Colored areas showing pattern regions
• Default: Labels (most informative)
Display Options:
• Display Analysis Strength: Shows star rating
• Display Target Levels: Shows target/invalidation lines
• Display Market Regime: Shows regime in pattern labels
---
HOW TO USE SMPS - DETAILED GUIDE
Understanding the Dashboard
Top Row - Header
• SMPS Dashboard title
• VALUE column: Current readings
• STATUS column: Condition assessments
Market Regime Row
• Shows: TRENDING, RANGING, VOLATILE, QUIET, or TRANSITIONAL
• Color coding: Green = Favorable, Red = Caution
• Status: FAVORABLE or CAUTION trading conditions
Market Score Row
• Percentage from 0-100%
• Above 60% = Strong conditions
• 40-60% = Moderate conditions
• Below 40% = Weak conditions
Structure Row
• Direction: BULLISH, BEARISH, or NEUTRAL
• Status: INTACT or BREAK
• Orange BREAK indicates structure failure
Volume Flow Row
• Direction: BUYING or SELLING
• Intensity: STRONG or WEAK
• Color indicates dominant pressure
Momentum Row
• Numerical momentum value
• Positive = Upward pressure
• Negative = Downward pressure
Volume Status Row
• INST = Institutional activity detected
• HIGH = Above average volume
• NORM = Normal volume levels
Adaptive Mode Row
• ACTIVE = Parameters adjusting
• STATIC = Fixed parameters
• Shows required confirmations
Analysis Level Row
• Minimum strength level setting
• Pattern separation in bars
Market State Row
• Current analysis: BULLISH, BEARISH, NEUTRAL
• Shows analysis price level when active
T:R Ratio Row
• Current target to risk ratio
• GOOD = Meets minimum requirement
• LOW = Below minimum threshold
Strength Row
• BULL or BEAR dominance
• Numerical strength value 0-100
Price Row
• Current price
• Percentage change
Last Analysis Row
• Previous pattern direction
• Bars since last pattern
Reading Pattern Signals
Bullish Structure Pattern
• Upward triangle or "Bullish Structure" label
• Star rating shows strength (★★★★★ = strongest)
• Green line = potential target level
• Red dashed line = invalidation level
• Appears below price bars
Bearish Structure Pattern
• Downward triangle or "Bearish Structure" label
• Star rating indicates reliability
• Green line = potential target level
• Red dashed line = invalidation level
• Appears above price bars
Pattern Strength Interpretation
• ★★★★★ = 6 confirmations (exceptional)
• ★★★★☆ = 5 confirmations (strong)
• ★★★☆☆ = 4 confirmations (moderate)
• ★★☆☆☆ = 3 confirmations (minimum)
• Below minimum = filtered out
Visual Elements on Chart
Lines and Levels:
• Gray Line = 21 EMA trend reference
• Green Stepline = Dynamic support level
• Red Stepline = Dynamic resistance level
• Green Solid Line = Active target level
• Red Dashed Line = Active invalidation level
Pattern Markers:
• Triangles = Arrow display mode
• Text Labels = Label display mode
• Colored Boxes = Zone display mode
Target Completion Labels:
• "Target" = Price reached target level
• "Invalid" = Pattern invalidated by price
---
RECOMMENDED USAGE BY TIMEFRAME
1-Minute Charts (Scalping)
• Sensitivity: 0.8-1.2
• Noise Reduction: 3-4
• Pattern Separation: 3-5 bars
• High Confirmation: Optional
• Best for: Quick intraday moves
5-Minute Charts (Precision Intraday)
• Sensitivity: 1.0 (default)
• Noise Reduction: 4 (default)
• Pattern Separation: 8 bars
• High Confirmation: Enabled
• Best for: Day trading
15-Minute Charts (Short Swing)
• Sensitivity: 1.0-1.5
• Noise Reduction: 4-5
• Pattern Separation: 10-12 bars
• High Confirmation: Enabled
• Best for: Intraday swings
30-Minute to 1-Hour (Position Trading)
• Sensitivity: 1.5-2.0
• Noise Reduction: 5-7
• Pattern Separation: 15-20 bars
• Regime Period: 75-100
• Best for: Multi-day positions
Daily Charts (Swing Trading)
• Sensitivity: 1.8-2.0
• Noise Reduction: 6-7
• Pattern Separation: 20 bars
• All filters enabled
• Best for: Long-term analysis
---
MARKET-SPECIFIC SETTINGS
Forex Pairs
• Minimum Move: 0.05-0.10%
• Institutional Threshold: 1.5-2.0
• Volume Surge: 1.8-2.2
• Target Mode: Dynamic or Market Adaptive
Stock Indices (ES, NQ, YM)
• Minimum Move: 0.10-0.15%
• Institutional Threshold: 2.0-2.5
• Volume Surge: 2.5-3.0
• Target Mode: Market Adaptive
Individual Stocks
• Minimum Move: 0.15-0.25%
• Institutional Threshold: 2.0-2.5
• Volume Surge: 2.5-3.5
• Target Mode: Dynamic
Cryptocurrency
• Minimum Move: 0.20-0.50%
• Institutional Threshold: 2.5-3.5
• Volume Surge: 3.0-4.5
• Target Mode: Dynamic
• Increase noise reduction
---
PRACTICAL APPLICATION EXAMPLES
Example 1: Strong Trending Market
Dashboard Reading:
• Market Regime: TRENDING
• Market Score: 75%
• Structure: BULLISH, INTACT
• Volume Flow: BUYING, STRONG
• Momentum: +0.45
Interpretation:
• Strong uptrend environment
• Institutional buying present
• Look for bullish patterns as continuation
• Higher probability of success
• Consider using lower sensitivity
Example 2: Range-Bound Conditions
Dashboard Reading:
• Market Regime: RANGING
• Market Score: 35%
• Structure: NEUTRAL
• Volume Flow: SELLING, WEAK
• Momentum: -0.05
Interpretation:
• No clear direction
• Low opportunity environment
• Patterns are less reliable
• Consider waiting for regime change
• Or switch to a range-trading approach
Example 3: Structure Break Alert
Dashboard Reading:
• Previous: BULLISH structure
• Current: Structure BREAK
• Volume: INST flag active
• Momentum: Shifting negative
Interpretation:
• Trend reversal potentially beginning
• Institutional participation detected
• Watch for bearish pattern confirmation
• Adjust bias accordingly
• Increase caution on long positions
Example 4: Volatile Market
Dashboard Reading:
• Market Regime: VOLATILE
• Market Score: 45%
• Adaptive Mode: ACTIVE
• Confirmations: Increased to 6
Interpretation:
• Choppy conditions
• Parameters auto-adjusted
• Fewer but higher quality patterns
• Wider stops may be needed
• Consider reducing position size
Below are a few chart examples of the Smart Money Precision Structure (SMPS) indicator in action.
• Example 1 – Bullish Structure Detection on SOLUSD 5m
• Example 2 – Bearish Structure Detected with Strong Confluence on SOLUSD 5m
---
TROUBLESHOOTING GUIDE
No Patterns Appearing
Check these settings:
• High Confirmation Mode may be too restrictive
• Minimum Strength Level may be too high
• Market Clarity threshold may be too high
• Regime filter may be blocking patterns
• Try increasing sensitivity
Too Many Patterns
Adjust these settings:
• Enable High Confirmation Mode
• Increase Minimum Strength Level to 5
• Increase Pattern Separation
• Reduce Sensitivity below 1.0
• Enable all technical filters
Dashboard Shows "CAUTION"
This indicates:
• Market conditions are unfavorable
• Regime is RANGING or QUIET
• Market score is low
• Consider waiting for better conditions
• Or adjust expectations accordingly
Patterns Not Reaching Targets
Consider:
• Market may be choppy
• Volatility may have changed
• Try Dynamic target mode
• Reduce target/risk ratio requirement
• Check if regime is VOLATILE
---
ALERTS CONFIGURATION
Alert Message Format
Alerts include:
• Pattern type (Bullish/Bearish)
• Strength rating
• Market regime
• Analysis price level
• Target and invalidation levels
• Strength percentage
• Target/Risk ratio
• Educational disclaimer
Setting Up Alerts
• Click Alert button on TradingView
• Select SMPS indicator
• Choose alert frequency
• Customize message if desired
• Alerts fire on pattern detection
---
DATA WINDOW INFORMATION
The Data Window displays:
• Market Regime Score (0-100)
• Market Structure Bias (-1 to +1)
• Bullish Strength (0-100)
• Bearish Strength (0-100)
• Bull Target/Risk Ratio
• Bear Target/Risk Ratio
• Relative Volume
• Momentum Value
• Volume Flow Strength
• Bull Confirmations Count
• Bear Confirmations Count
---
BEST PRACTICES AND TIPS
For Beginners
• Start with default settings
• Use High Confirmation Mode
• Focus on TRENDING regime only
• Paper trade first
• Learn one timeframe thoroughly
For Intermediate Users
• Experiment with sensitivity settings
• Try different target modes
• Use multiple timeframes
• Combine with price action analysis
• Track pattern success rate
For Advanced Users
• Customize per instrument
• Create setting templates
• Use regime information for bias
• Combine with other indicators
• Develop systematic rules
---
IMPORTANT DISCLAIMERS
• This indicator is for educational and informational purposes only
• Not financial advice or a trading system
• Past performance does not guarantee future results
• Trading involves substantial risk of loss
• Always use appropriate risk management
• Verify patterns with additional analysis
• The author is not a registered investment advisor
• No liability accepted for trading losses
---
VERSION NOTES
Version 1.0.0 - Initial Release
• Six-layer confluence system
• Adaptive parameter technology
• Institutional volume detection
• Market regime classification
• Structure break identification
• Real-time dashboard
• Multiple display modes
• Comprehensive settings
## My Final Thoughts
Smart Money Precision Structure represents an advanced approach to market analysis, bringing institutional-grade techniques to retail traders through intelligent automation and multi-dimensional evaluation. By combining six analytical frameworks with adaptive parameter adjustment, SMPS provides comprehensive market intelligence that single indicators cannot achieve.
The indicator serves as an educational tool for understanding how professional traders analyze markets, while providing practical pattern detection for those seeking to improve their technical analysis. Remember that all trading involves risk, and this tool should be used as part of a complete analysis approach, not as a standalone trading system.
- BullByte

VWAP BANDS [qrsq]Description
This indicator is used to find support and resistance utilizing both buying and selling volume. It can be used on lower and higher time frames to understand where price is likely to reject or bounce.
How it works
Instead of calculating the VWAP using the total volume, this script estimates the buying/selling volume and respectively calculates their individual VWAP's. The standard deviations of these are then calculated to create the set of two bands. The top bands being the VWAP from buying volume and bottom bands are from selling volume, with the option to use a double band on either pair.
How to use it
I like to use the bands for LTF scalping as well as HTF swings, I also like to use it alongside my SMA VWAP BANDS.
For scalping:
I tend to use either the 5m or 15m TF
I then set the indicator's TF to 1m
I will take a scalp based on the bands confluence with other PA methods, if price is being either supported or rejected.
For swings:
I tend to use a variety of TFs, including: 30m, 1H, 4H, D
I then set the indicator's TF to "Chart"
I will take a swing based on the bands confluence with other PA methods, if price is being either supported or rejected.
I also tend to use them on perpetual contracts as the volume seems to be more consistent and hence results in more accurate support and resistance.

SMA VWAP BANDS [qrsq]Description
This indicator is used to find support and resistance utilizing both SMA and VWAP. It can be used on lower and higher time frames to understand where price is likely to reject or bounce.
How it works
Rather than using the usual calculation for the VWAP, instead this script smooths the volume first with the SMA and then respectively calculates the smoothed multiplication of high, low and close price with the volume individually. These values are then divided by the smoothed volume to find individual VWAP's for each of the sources. The standard deviations of these are calculated, resulting in an upper, lower and middle band. It is essentially VWAP bands with some smoothed calculations in the middle.
How to use it
I like to use the bands for LTF scalping as well as HTF swings.
For scalping:
I tend to use either the 5m or 15m TF
I then set the indicator's TF to 1m
I will take a scalp based on the bands confluence with other PA methods, if price is being either supported or rejected.
For swings:
I tend to use a variety of TFs, including: 30m, 1H, 4H, D
I then set the indicator's TF to "Chart"
I will take a swing based on the bands confluence with other PA methods, if price is being either supported or rejected.
I also tend to use them on perpetual contracts as the volume seems to be more consistent and hence results in more accurate support and resistance.

RSI Scalping & Swing Signals With AlertsThis RSI indicator shows a green or red ribbon when the smoothed RSI is bullish or bearish. It also includes a long moving average for overall trend confirmation. Wait until the ribbon holds above or below the long moving average and take positions in that direction.
To get an easier to read RSI indicator, I smoothed the RSI out and paired it next to a short term RMA. These two together form the ribbon that will show you early reversals and trend direction. The long moving average is used as an overall trend detector and confirmation for longer term trends.
***HOW TO USE***
Scalping: Enter longs when the ribbon turns green and enter shorts when the ribbon turns red. Exit positions when the ribbon turns the opposite color or crosses the long moving average.
Swing Trading: When the ribbon holds above the long moving average or breaks out and retests it, look for long positions and exit when the ribbon turns red or crosses the long moving average. When the ribbon holds below the long moving average or breaks down and retests it, look for short positions and exit when the ribbon turns green or crosses the long moving average.
***DETAILS***
This indicator gives early reversal signals very well and waiting for the RSI ribbon to cross the long moving average helps to get you into positions when the market is ready to really move while filtering out some of the noise.
The ribbon and background will change to green or red depending on whether it is currently bullish or bearish.
There is also a label that changes colors and tells you if RSI is bullish or bearish and also whether the RSI ribbon is above or below the long moving average.
Green or red circles will appear on the indicator when there is a bullish or bearish cross of the RSI ribbon and the long moving average.
It also has alerts that trigger when RSI is turning bullish/bearish or when the RSI ribbon is crossing the long moving average.
***CUSTOMIZATION***
Each piece of this indicator can be customized to suit your preferences including the RSI source, length, smoothing length, short moving average length and long moving average length. You can also turn off the labels, signals and long moving average. All of these settings can be managed within the indicator settings input tab.
***MARKETS***
This indicator can be used as a signal on all markets, including stocks, crypto, futures and forex.
***TIMEFRAMES***
This RSI Scalping & Swing Signals indicator can be used on all timeframes.
***TIPS***
Try using numerous indicators of ours on your chart so you can instantly see the bullish or bearish trend of multiple indicators in real time without having to analyze the data. Some of our favorites are Trend Friend Scalp & Swing Trade Signals, Volume Spike Scanner, Buy & Sell Pressure Volume Profile, and Momentum Scalper in combination with this RSI indicator. They all have real time Bullish and Bearish labels as well so you can immediately understand each indicator's trend.

Momentum Scalping & Swing Signals With AlertsThis Momentum indicator shows a green or red ribbon when smoothed momentum is bullish or bearish. It also includes a long moving average for overall trend confirmation. Wait until the ribbon holds above or below the long moving average and take positions in that direction.
To get an easier to read momentum indicator, I smoothed the momentum out and paired it next to a short term RMA. These two together form the ribbon that will show you early reversals and trend direction. The long moving average is used as an overall trend detector and confirmation for longer term trends.
***HOW TO USE***
Scalping: Enter longs when the ribbon turns green and enter shorts when the ribbon turns red. Exit positions when the ribbon turns the opposite color or crosses the long moving average.
Swing Trading: When the ribbon holds above the long moving average or breaks out and retests it, look for long positions and exit when the ribbon turns red or crosses the long moving average. When the ribbon holds below the long moving average or breaks down and retests it, look for short positions and exit when the ribbon turns green or crosses the long moving average.
***DETAILS***
This indicator gives early reversal signals very well and waiting for the momentum ribbon to cross the long moving average helps to get you into positions when the market is ready to really move while filtering out some of the noise.
The ribbon and background will change to green or red depending on whether it is currently bullish or bearish.
There is also a label that changes colors and tells you if momentum is bullish or bearish and also whether the momentum ribbon is above or below the long moving average.
Green or red circles will appear on the indicator when there is a bullish or bearish cross of the momentum ribbon and the long moving average.
It includes alerts that trigger when momentum is turning bullish/bearish or when the momentum ribbon is crossing the long moving average.
***CUSTOMIZATION***
Each piece of this indicator can be customized to suit your preferences including the momentum source, length, smoothing length, short moving average length and long moving average length. You can also turn off the labels, signals and long moving average. All of these settings can be managed within the indicator settings input tab.
***MARKETS***
This indicator can be used as a signal on all markets, including stocks, crypto, futures and forex.
***TIMEFRAMES***
This Momentum Scalping & Swing Signals indicator can be used on all timeframes.
***TIPS***
Try using numerous indicators of ours on your chart so you can instantly see the bullish or bearish trend of multiple indicators in real time without having to analyze the data. Some of our favorites are Trend Friend Scalp & Swing Trade Signals, Volume Spike Scanner, Buy & Sell Pressure Volume Profile, and RSI Scalper in combination with this momentum indicator. They all have real time Bullish and Bearish labels as well so you can immediately understand each indicator's trend.

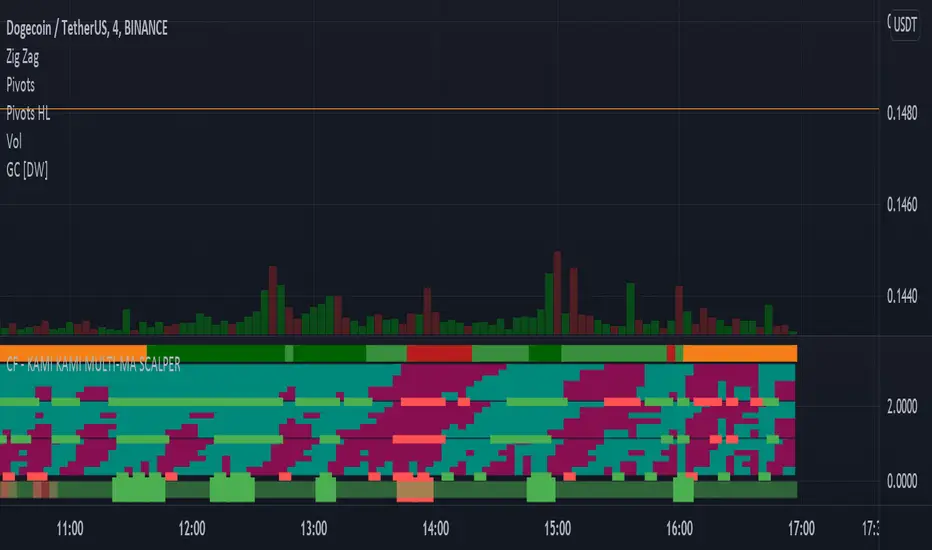
CF - KAMI KAMI EMA-HMA-VWMA SCALPERThis is your dark knight, your shining light in the crypto darkness... It's you and me against the machine..... rage, rage against the dying of the night!
This my greedy minions is the ticket..... the disruptive technology, the red pill, that breaks the Matrix.... get ready to join the revolution.
DESCRIPTION:
Lowest green/red line
The lowest alternating green red band is simply a general market indicator. It's EMA 50 over 200. This is a generally good indicator of current market conditions. If the band is red, you should favor taking short positions. If the band is green, long positions.
The three MA colored bands
This sophisticated indicator uses 3 central MA's in calculating its goodness. The HMA (Hull's Moving Average), at the bottom (of the three principal bands), is the most sensitive and responsive to immediate market conditions. It will generally give you the signal to enter or exit at the beginning of the price action move. But, this could also be a "false" signal - that doesn't continue in the expected direction.
The middle band is VWMA, volume-weighted moving average, and it is sensitive to volume - so it may turn green or red faster as volume increases or decreases. It gives somewhat similar signals to the top moving average which is the EMA or exponential moving average.
The GREEN RED signals
The signals below the bands which are true green and true red are "SUPER" signals which represent that all of the six small bands of each MA agree. These are very strong signals to enter and exit a position. If multiple SUPER signals agree this is even more confirmation.
SETTINGS
You can change the ema signals. They are currently optimized for scalping, but this indicator can work for larger timeframes.
I couldn't make this open-source as it represents a lot of work to get it to this point. If you are interested in this indicator and would like to have a custom version coded for your purposes, let me know.
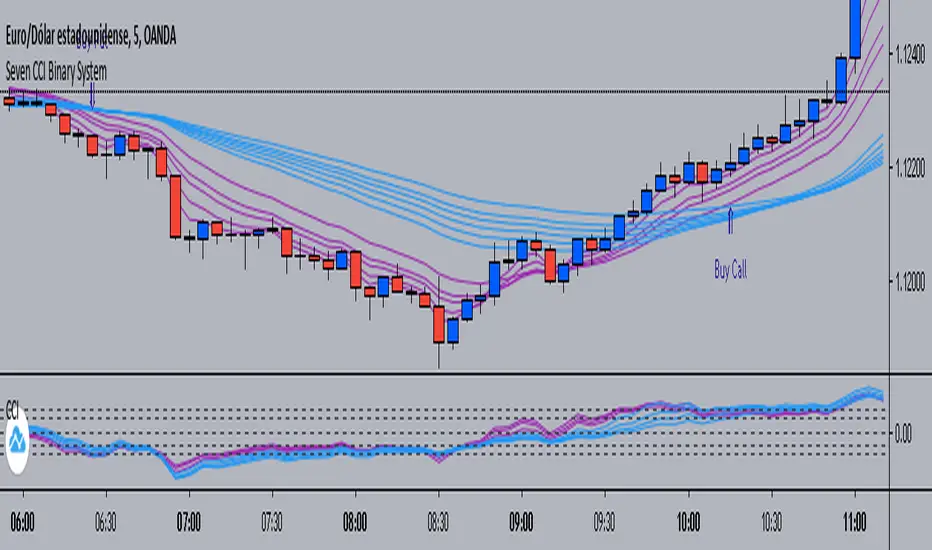
Seven CCI Binary System by Hashtag_binarySeven CCI binary system is trend-momentum strategy based on CCI and exponential moving averages. This trading system is also good for scalping and intraday trading.
Rules for Binary Options:
- Time Frame 5 min or 15 min.
- Expiry time 4-5 candles.
- Trades only in trend.
Buy Call:
- EMA's lines color magenta above EMA's lines color blue;
- CCI lines color magenta are above CCI lines color blue and zero level.
- When thes conditions are agree buy call at opening of the next bar.
Buy Put:
- EMA's lines color magenta below EMA's lines color blue;
- CCI lines color magenta are below CCI lines color blue and zero level.
- When thes conditions are agree buy put at opening of the next bar.
Scalping:
-Time Frame 5 min, 15min.
- Currency Pairs: EUR/USD, GBP/USD, AUD/USD, USD/CHF, USD/JPY.
- The rules for buy and sell are the same.
- When the price is within the bundle of the moving averages do not trade.
Exit position
- Make Profit on the pivot points levels or with fast profit target.
- Initial stop loss on the previous swing price.
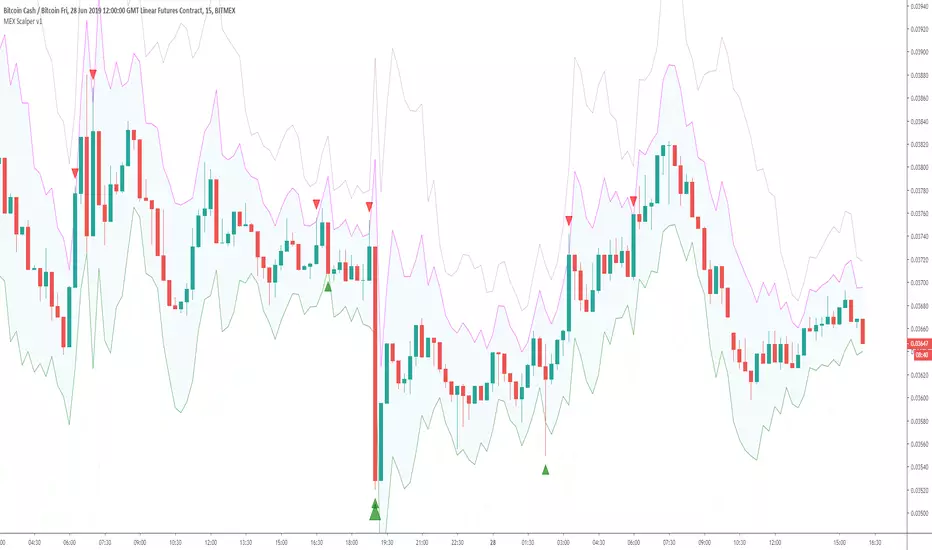
Market SCALPER v0.1This is my personnal script and rules for scalping Cryptocurrencies (on bitmex) and SP500 (or DAX or DJI) on 1 minute timeframe
Advantages:
-Simple to use with clear rules
-High success rate (if you follow the rules)
-cheap Stoploss
- Mean risk-reward ratio>2.2
-Possibility to catch and stay in big move
Rules:
1) Use heinkin ashi candles (remove noise)
2)Long entry:
- Price above SMA50 (SMA 50 rising is better)
-White line = entry long if RSI is not red
-Stop loss few ticks below the recent low
-Take profit when red line or dots appear above bars
3) Short entry
- Price belowSMA50 (SMA 50 fallingis better)
-redline = entry short if RSI is not green
-Stop loss few ticks above the recent low
-Take profit when white line or dots appear below bars
Contact by MP for access rules
BitMEX Profit Scalper v1I keep getting asked to create a script for Scalping on BitMEX so here is the initial version!
Default settings created for XBTUSD 15m and designed for getting decent profits when using around a 10x margin.
Settings can be tweaked so you can alter this for any time frame
ACCESS For CryptoProTools.com members only!! (Visit our website if you wish to sign up)
Higher Timeframe Price Action ScannerThis is a higher timeframe scanner that detects the price action trend on multiple timeframes and displays them all as red or green dots. You’ll be able to see the real time and historical price action trends so you can trade in the same direction of the overall trend on higher timeframes. You can also set it to scan a different ticker if you choose. If you find pairs that correlate very well, you can use two scanners and look at both of them for extra trend confluence.
CALCULATIONS
This scanner uses the same price action formula from our other indicator titled 1 Minute Scalping Indicator which can be found on our profile. It has Scalp Mode and Swing Mode. Both modes use the exact same price action parameters for signals, but Swing Mode will only give signals when the price action parameters are met AND the close is higher than the previous high for bull signals or when the close is lower than the previous low for bear signals.
HOW TO USE
The top line of the scanner shows the price action trend for the current chart timeframe and the rest are using the higher timeframe that you set in the input settings. They start with higher timeframe #1 as the second line from the top and go down from there.
When most or all of the dots are green, you should be looking for long positions and when most or all of the dots are red, you should be looking for short positions.
Since this scanner is using pure price action to identify trends, it’s a reliable way to see what multiple timeframes are doing.
PAIRINGS
Use this with the 1 Minute Scalping Indicator so you can get the signals and candles colored per the price action on your chart as well as see the higher timeframe price action trend from the scanner. Using both together will help you make better trading decisions.
MARKETS
You can use this scanner on any market.
TIMEFRAMES
This scanner will scan the current chart timeframe and display the result on the top line, then the lines below that will display the results from the higher timeframes you choose in the settings. It has timeframes from 1 minute all the way up to 1 year.

XAUUSD Family Scalping (5min)🟡 XAUUSD Family Scalping 5-Min — Momentum Precision Indicator
Overview
This indicator is built for XAUUSD (Gold) on the 5-minute timeframe and is designed for short-term momentum scalping.
It helps traders identify early reversal zones, confirm momentum direction, and detect exhaustion points during high-volatility market moves.
Core Concept
The indicator measures momentum strength and price acceleration using a smoothed oscillator.
It features two adjustable thresholds:
Overbought level: 58
Oversold level: -58
When the momentum line crosses above or below these zones, it signals potential trend continuation or reversal opportunities.
Features
Detects short-term momentum shifts on XAUUSD 5M.
Works with EMA-based trend confirmation (optional).
Adaptive smoothing reduces noise and false reversals.
Highlights overbought/oversold areas visually.
Can be combined with price action or other oscillators for confluence.
Usage
Instrument: XAUUSD (Gold)
Best timeframe: 5-minute (scalping setup)
Use case: Detecting momentum exhaustion and reversal entries.
Sessions: London & New York recommended.
Disclaimer
This indicator is for market analysis and educational purposes.
No indicator guarantees profit — use proper risk management and test before live trading.

Improved Scalping Consolidation and Squeeze IndicatorThe Improved Scalping Consolidation and Squeeze Indicator (Improved Scalp C&S) is a custom TradingView indicator designed for short-term trading, specifically scalping. It detects price consolidation and potential breakout scenarios using a combination of technical analysis tools, such as the Rate of Change (ROC), Relative Strength Index (RSI), Moving Average Convergence Divergence (MACD), Bollinger Bands, and Keltner Channels. To reduce the number of false signals, this improved version introduces a "consolidation strength" parameter, which represents the minimum number of consecutive bars required for a valid consolidation or squeeze signal.
How it works:
Consolidation Detection:
The indicator identifies price consolidation when the following conditions are met:
a. RSI is between 45 and 55, indicating a lack of strong momentum.
b. The absolute value of the MACD histogram is less than 0.1% of the closing price, suggesting a lack of directional movement.
c. The Rate of Change (ROC) is less than 1.5%, indicating relatively stable prices over the specified period.
Squeeze Detection:
The indicator detects a squeeze (a potential breakout scenario) when the Bollinger Bands are within the Keltner Channels, represented by the following conditions:
a. The lower Bollinger Band is above the lower Keltner Channel.
b. The upper Bollinger Band is below the upper Keltner Channel.
Consolidation Strength:
The consolidation strength parameter filters out weaker signals by requiring a minimum number of consecutive bars for a valid consolidation or squeeze signal. By adjusting this parameter, traders can control the sensitivity of the indicator to short-term price movements and potentially reduce the number of false signals.
When the consolidation strength criteria are met, the indicator colors the price bars within the pattern yellow for consolidation and orange for a squeeze, signaling potential trading opportunities.
Trading Strategy:
The Improved Scalping Consolidation and Squeeze Indicator can be used in various ways, depending on the trader's strategy and risk appetite. Here are some suggestions:
Range trading: During consolidation (yellow bars), traders can buy at support levels and sell at resistance levels within the range, using stop-loss orders to manage risk. However, this approach might not work well in the case of a sudden breakout.
Breakout trading: When a squeeze is detected (orange bars), traders can wait for a confirmed breakout from the consolidation pattern before entering a trade. A breakout can be confirmed by a strong price move accompanied by increased volume, a significant change in momentum, or a breach of important support or resistance levels.
Momentum-based strategies: Traders can use other momentum-based indicators (e.g., Stochastic Oscillator, On Balance Volume) in conjunction with the Improved Scalp C&S indicator to identify potential entry and exit points during consolidation or breakout scenarios.
Fine-tuning the consolidation strength: Adjust the "consolidation strength" input to find the optimal balance between the number of signals and their accuracy. A higher value will result in fewer signals, potentially reducing the number of false signals, but it may also make the indicator less sensitive to short-term price movements.

Scalp Boost LONG✦ Overview
Scalp Boost LONG is a visual tool designed to highlight potential short-term upward impulses.
A signal is generated only when multiple market conditions align at the candle close, combining momentum dynamics, local probability shifts, and abnormal volume behavior.
The indicator does not repaint.
✦ Concept
The tool focuses on selective situations where the market shows signs of micro-breakout potential.
If all internal conditions are confirmed — a LONG event is displayed.
If not — the chart remains clean.
This builds a low-noise signal model, prioritizing quality over frequency.
✦ Signal Logic
The LONG signal requires confirmation of all core conditions:
• Local impulse dynamics
Identifies short-term acceleration suggesting a breakout from a compressed price structure.
• Probability beyond a statistical zone
Uses relative breakout probability instead of fixed levels, checking whether price exceeds expected local ranges.
• Abnormal volume activity
Highlights candles with monetary flow above a custom threshold, signaling increased market interest.
• Anti-overheat filter
Conditions avoiding exhausted or low-momentum phases where continuation is less likely.
Only when all filters are aligned a LONG marker appears.
✦ Visual Structure
The chart display is intentionally minimal:
• ROC Curve
Subdued line, showing short-term momentum without distraction.
• LONG Marker
Green triangle below the candle on confirmed events.
• Candle Highlight
Soft background highlight on the signal bar.
• Volume Marker
Small red dot at the bottom of candles with abnormal monetary flow.
All visual elements appear only on candle close.
✦ Alerts
A clean event structure is available for notifications:
LONG Signal
This allows receiving alerts during chart analysis or in automated workflows while keeping full control over decision-making.
✦ Notes & Guidelines
This tool:
is not a trading system,
does not provide targets or stops,
may trigger against the dominant trend,
should be combined with the user’s own methodology.
Signals are rare by design.
Do not interpret each event as a trend continuation — it highlights conditions, not outcomes.
✦ Suggested Use
-(Non-mandatory ideas for advanced users)
-identifying potential micro-breakouts,
-timing entries around volume spikes,
-adding context to scalping models,
-filtering impulsive moves from noise.
-suitable for a 5-minute timeframe
The indicator can be helpful as a confirmation layer, not a standalone decision tool.

Universal Scalper Indicator [Crypto/Forex/Gold]Universal Scalper Pro is an all-in-one scalping system designed for the 15-Minute Timeframe. It automates the analysis of trend, volatility, and risk management into a single, high-contrast dashboard.
Unlike standard crossover indicators, this system filters out low-volatility "noise" using a built-in ADX engine and automatically calculates dynamic Stop Loss and Take Profit levels based on market volatility (ATR).
It is engineered to work universally on:
Crypto (BTC, ETH, SOL, Altcoins)
Commodities (Gold, Silver, Oil)
Forex (Major & Minor Pairs)
Stocks (High volume tech stocks like NVDA, TSLA)
📈 How It Works (The Strategy)
1. The Trend Engine (9/21 EMA) The core logic utilizes a Fast (9) and Slow (21) Exponential Moving Average crossover.
Bullish Signal: The 9 EMA crosses above the 21 EMA.
Bearish Signal: The 9 EMA crosses below the 21 EMA. This specific combination is chosen for its responsiveness to 15-minute intraday trends.
2. The Noise Filter (ADX > 15) To prevent "whipsaws" (fake signals during sideways markets), the script includes a Volatility Filter based on the Average Directional Index (ADX).
Signals are rejected if the ADX is below 15.
This ensures you only receive alerts when there is sufficient momentum to sustain a move.
3. Dynamic Risk Management (ATR) The script uses the Average True Range (ATR) to calculate Stop Loss and Take Profit levels that adapt to the specific asset's volatility.
Stop Loss: Placed at 1.5x ATR from the entry. (Tight enough to preserve capital, wide enough to survive standard market noise).
Take Profit: Placed at 2.0x ATR from the entry. (Provides a healthy 1:1.3 Risk/Reward ratio).
🚀 Key Features
Universal Dashboard: A bottom-right panel displays the live Trend Status, Entry Price, Stop Loss, and Take Profit. It automatically formats decimals for any asset (e.g., 2 decimals for Gold, 5 for Forex, 8 for Crypto).
"Sticky" Memory: The dashboard retains the prices of the last valid signal, allowing you to manage your trade even after the signal candle closes.
Trend Cloud: A visual Green/Red zone between the EMAs helps you instantly identify the market bias.
Unified Alerts: A single alert setup ("Any alert() function call") sends the Asset Name, Entry, SL, and TP directly to your phone.
🛠️ How to Use
Timeframe: Set your chart to 15 Minutes (15m).
Wait for the Signal: Look for the "BUY" (Green) or "SELL" (Red) label on the chart.
Check the Dashboard: Ensure the "STATUS" is BULLISH (for buys) or BEARISH (for sells). If the status says "WAIT", do not trade.
Execute: Enter the trade using the exact Stop Loss and Take Profit levels shown on the dashboard.
⚠️ Risk Disclaimer
Trading financial markets involves high risk and may not be suitable for all investors. This indicator is a technical analysis tool and does not constitute financial advice. Past performance is not indicative of future results. Always practice with a demo account before trading real capital.

BOCS AdaptiveBOCS Adaptive Strategy - Automated Volatility Breakout System
WHAT THIS STRATEGY DOES:
This is an automated trading strategy that detects consolidation patterns through volatility analysis and executes trades when price breaks out of these channels. Take-profit and stop-loss levels are calculated dynamically using Average True Range (ATR) to adapt to current market volatility. The strategy closes positions partially at the first profit target and exits the remainder at the second target or stop loss.
TECHNICAL METHODOLOGY:
Price Normalization Process:
The strategy begins by normalizing price to create a consistent measurement scale. It calculates the highest high and lowest low over a user-defined lookback period (default 100 bars). The current close price is then normalized using the formula: (close - lowest_low) / (highest_high - lowest_low). This produces values between 0 and 1, allowing volatility analysis to work consistently across different instruments and price levels.
Volatility Detection:
A 14-period standard deviation is applied to the normalized price series. Standard deviation measures how much prices deviate from their average - higher values indicate volatility expansion, lower values indicate consolidation. The strategy uses ta.highestbars() and ta.lowestbars() functions to track when volatility reaches peaks and troughs over the detection length period (default 14 bars).
Channel Formation Logic:
When volatility crosses from a high level to a low level, this signals the beginning of a consolidation phase. The strategy records this moment using ta.crossover(upper, lower) and begins tracking the highest and lowest prices during the consolidation. These become the channel boundaries. The duration between the crossover and current bar must exceed 10 bars minimum to avoid false channels from brief volatility spikes. Channels are drawn using box objects with the recorded high/low boundaries.
Breakout Signal Generation:
Two detection modes are available:
Strong Closes Mode (default): Breakout occurs when the candle body midpoint math.avg(close, open) exceeds the channel boundary. This filters out wick-only breaks.
Any Touch Mode: Breakout occurs when the close price exceeds the boundary.
When price closes above the upper channel boundary, a bullish breakout signal generates. When price closes below the lower boundary, a bearish breakout signal generates. The channel is then removed from the chart.
ATR-Based Risk Management:
The strategy uses request.security() to fetch ATR values from a specified timeframe, which can differ from the chart timeframe. For example, on a 5-minute chart, you can use 1-minute ATR for more responsive calculations. The ATR is calculated using ta.atr(length) with a user-defined period (default 14).
Exit levels are calculated at the moment of breakout:
Long Entry Price = Upper channel boundary
Long TP1 = Entry + (ATR × TP1 Multiplier)
Long TP2 = Entry + (ATR × TP2 Multiplier)
Long SL = Entry - (ATR × SL Multiplier)
For short trades, the calculation inverts:
Short Entry Price = Lower channel boundary
Short TP1 = Entry - (ATR × TP1 Multiplier)
Short TP2 = Entry - (ATR × TP2 Multiplier)
Short SL = Entry + (ATR × SL Multiplier)
Trade Execution Logic:
When a breakout occurs, the strategy checks if trading hours filter is satisfied (if enabled) and if position size equals zero (no existing position). If volume confirmation is enabled, it also verifies that current volume exceeds 1.2 times the 20-period simple moving average.
If all conditions are met:
strategy.entry() opens a position using the user-defined number of contracts
strategy.exit() immediately places a stop loss order
The code monitors price against TP1 and TP2 levels on each bar
When price reaches TP1, strategy.close() closes the specified number of contracts (e.g., if you enter with 3 contracts and set TP1 close to 1, it closes 1 contract). When price reaches TP2, it closes all remaining contracts. If stop loss is hit first, the entire position exits via the strategy.exit() order.
Volume Analysis System:
The strategy uses ta.requestUpAndDownVolume(timeframe) to fetch up volume, down volume, and volume delta from a specified timeframe. Three display modes are available:
Volume Mode: Shows total volume as bars scaled relative to the 20-period average
Comparison Mode: Shows up volume and down volume as separate bars above/below the channel midline
Delta Mode: Shows net volume delta (up volume - down volume) as bars, positive values above midline, negative below
The volume confirmation logic compares breakout bar volume to the 20-period SMA. If volume ÷ average > 1.2, the breakout is classified as "confirmed." When volume confirmation is enabled in settings, only confirmed breakouts generate trades.
INPUT PARAMETERS:
Strategy Settings:
Number of Contracts: Fixed quantity to trade per signal (1-1000)
Require Volume Confirmation: Toggle to only trade signals with volume >120% of average
TP1 Close Contracts: Exact number of contracts to close at first target (1-1000)
Use Trading Hours Filter: Toggle to restrict trading to specified session
Trading Hours: Session input in HHMM-HHMM format (e.g., "0930-1600")
Main Settings:
Normalization Length: Lookback bars for high/low calculation (1-500, default 100)
Box Detection Length: Period for volatility peak/trough detection (1-100, default 14)
Strong Closes Only: Toggle between body midpoint vs close price for breakout detection
Nested Channels: Allow multiple overlapping channels vs single channel at a time
ATR TP/SL Settings:
ATR Timeframe: Source timeframe for ATR calculation (1, 5, 15, 60, etc.)
ATR Length: Smoothing period for ATR (1-100, default 14)
Take Profit 1 Multiplier: Distance from entry as multiple of ATR (0.1-10.0, default 2.0)
Take Profit 2 Multiplier: Distance from entry as multiple of ATR (0.1-10.0, default 3.0)
Stop Loss Multiplier: Distance from entry as multiple of ATR (0.1-10.0, default 1.0)
Enable Take Profit 2: Toggle second profit target on/off
VISUAL INDICATORS:
Channel boxes with semi-transparent fill showing consolidation zones
Green/red colored zones at channel boundaries indicating breakout areas
Volume bars displayed within channels using selected mode
TP/SL lines with labels showing both price level and distance in points
Entry signals marked with up/down triangles at breakout price
Strategy status table showing position, contracts, P&L, ATR values, and volume confirmation status
HOW TO USE:
For 2-Minute Scalping:
Set ATR Timeframe to "1" (1-minute), ATR Length to 12, TP1 Multiplier to 2.0, TP2 Multiplier to 3.0, SL Multiplier to 1.5. Enable volume confirmation and strong closes only. Use trading hours filter to avoid low-volume periods.
For 5-15 Minute Day Trading:
Set ATR Timeframe to match chart or use 5-minute, ATR Length to 14, TP1 Multiplier to 2.0, TP2 Multiplier to 3.5, SL Multiplier to 1.2. Volume confirmation recommended but optional.
For Hourly+ Swing Trading:
Set ATR Timeframe to 15-30 minute, ATR Length to 14-21, TP1 Multiplier to 2.5, TP2 Multiplier to 4.0, SL Multiplier to 1.5. Volume confirmation optional, nested channels can be enabled for multiple setups.
BACKTEST CONSIDERATIONS:
Strategy performs best during trending or volatility expansion phases
Consolidation-heavy or choppy markets produce more false signals
Shorter timeframes require wider stop loss multipliers due to noise
Commission and slippage significantly impact performance on sub-5-minute charts
Volume confirmation generally improves win rate but reduces trade frequency
ATR multipliers should be optimized for specific instrument characteristics
COMPATIBLE MARKETS:
Works on any instrument with price and volume data including forex pairs, stock indices, individual stocks, cryptocurrency, commodities, and futures contracts. Requires TradingView data feed that includes volume for volume confirmation features to function.
KNOWN LIMITATIONS:
Stop losses execute via strategy.exit() and may not fill at exact levels during gaps or extreme volatility
request.security() on lower timeframes requires higher-tier TradingView subscription
False breakouts inherent to breakout strategies cannot be completely eliminated
Performance varies significantly based on market regime (trending vs ranging)
Partial closing logic requires sufficient position size relative to TP1 close contracts setting
RISK DISCLOSURE:
Trading involves substantial risk of loss. Past performance of this or any strategy does not guarantee future results. This strategy is provided for educational purposes and automated backtesting. Thoroughly test on historical data and paper trade before risking real capital. Market conditions change and strategies that worked historically may fail in the future. Use appropriate position sizing and never risk more than you can afford to lose. Consider consulting a licensed financial advisor before making trading decisions.
ACKNOWLEDGMENT & CREDITS:
This strategy is built upon the channel detection methodology created by AlgoAlpha in the "Smart Money Breakout Channels" indicator. Full credit and appreciation to AlgoAlpha for pioneering the normalized volatility approach to identifying consolidation patterns and sharing this innovative technique with the TradingView community. The enhancements added to the original concept include automated trade execution, multi-timeframe ATR-based risk management, partial position closing by contract count, volume confirmation filtering, and real-time position monitoring.

Liquidity Swing Points [BackQuant]Liquidity Swing Points
This tool marks recent swing highs and swing lows and turns them into persistent horizontal “liquidity” levels. These are places where resting orders often accumulate, such as stop losses above prior highs and below prior lows. The script detects confirmed pivots, records their prices, draws lines and labels, and manages their lifecycle on the chart so you can monitor potential sweep or breakout zones without manual redrawing.
What it plots
LQ-H at confirmed swing highs
LQ-L at confirmed swing lows
Horizontal levels that can optionally extend into the future
Timed removal of old levels to keep the chart clean
Each level stores its price, the bar where it was created, its type (high or low), plus a label and a line reference for efficient updates.
How it works
Pivot detection
A swing high is confirmed when the highest high has swing_length bars on both sides that are lower.
A swing low is confirmed when the lowest low has swing_length bars on both sides that are higher.
Pivots are only marked after they are confirmed, so they do not repaint.
Level creation
When a pivot confirms, the script records the price and the creation bar (offset by the right lookback).
A new line is plotted at that price, labeled LQ-H or LQ-L.
Rendering and extension
Levels can be drawn to the most recent bar only or extended to the right for forward reference.
Label size and line color/transparency are configurable.
Lifecycle management
On each confirmed bar, the script checks level age.
Levels older than a chosen bar count are removed automatically to reduce clutter.
How it can be used
Liquidity sweeps: Watch for price to probe beyond a level then close back inside. That behavior often signals a potential fade back into the prior range.
Breakout validation: If price pushes through a level and holds on closes, traders may treat that as continuation. Retests of the level from the other side can serve as structure checks.
Context for entries and exits: Use nearby LQ-H or LQ-L as reference for stop placement or partial-take zones, especially when other tools agree.
Multi-timeframe mapping: Plot swing points on higher timeframes, then drill down to time entries on lower timeframes as price interacts with those levels.
Why liquidity levels matter
Prior swing points are focal areas where many strategies set stops or pending orders. Price often revisits these zones, either to “sweep” resting liquidity before reversing, or to absorb it and trend. Marking these areas objectively helps frame scenarios like failed breaks, successful breakouts, and retests, and it reduces the subjectivity of eyeballing structure.
Settings to know
Swing Detection Length (swing_length), Controls sensitivity. Lower values find more local swings. Higher values find more significant ones.
Bars until removal (removeafter), Deletes levels after a fixed number of bars to prevent buildup.
Extend Levels Right (extend_levels), Keeps levels projected into the future for easier planning.
Label Size (label_size), Choose tiny to large for chart readability.
One color input controls both high and low levels with transparency for context.
Strengths
Objective marking of recent structure without hand drawing
No repaint after confirmation since pivots are locked once the right lookback completes
Lightweight and fast with simple lifecycle management
Clear visuals that integrate well with any price-action workflow
Practical tips
For scalping: use smaller swing_length to capture more granular liquidity. Keep removeafter short to avoid clutter.
For swing trading: increase swing_length so only more meaningful levels remain. Consider extending levels to the right for planning.
Combine with time-of-day filters, ATR for stop sizing, or a separate trend filter to bias trades taken at the levels.
Keep screenshots focused: one image showing a sweep and reversal, another showing a clean breakout and retest.
Limitations and notes
Levels appear after confirmation, so they are delayed by swing_length bars. This is by design to avoid repainting.
On very noisy or illiquid symbols, you may see many nearby levels. Increasing swing_length and shortening removeafter helps.
The script does not assess volume or session context. Consider pairing with volume or session tools if that is part of your process.

Logarithmic Moving Average (LMA) [QuantAlgo]🟢 Overview
The Logarithmic Moving Average (LMA) uses advanced logarithmic weighting to create a dynamic trend-following indicator that prioritizes recent price action while maintaining statistical significance. Unlike traditional moving averages that use linear or exponential weights, this indicator employs logarithmic decay functions to create a more sophisticated price averaging system that adapts to market volatility and momentum conditions.
The indicator displays a smoothed signal line that oscillates around zero, with positive values indicating bullish momentum and negative values indicating bearish momentum. The signal incorporates trend quality assessment, momentum confirmation, and multiple filtering mechanisms to help traders and investors identify trend continuation and reversal opportunities across different timeframes and asset classes.
🟢 How It Works
The indicator's core innovation lies in its logarithmic weighting system, where weights are calculated using the formula: w = 1.0 / math.pow(math.log(i + steepness), 2) The steepness parameter controls how aggressively recent data is prioritized over historical data, creating a dynamic weight decay that can be fine-tuned for different trading styles. This logarithmic approach provides more nuanced weight distribution compared to exponential moving averages, offering better responsiveness while maintaining stability.
The LMA calculation combines multiple sophisticated components. First, it calculates the logarithmic weighted average of closing prices. Then it measures the slope of this average over a 10-period lookback: lmaSlope = (lma - lma ) / lma * 100 The system also incorporates trend quality assessment using R-squared correlation analysis of log-transformed prices, measuring how well the price data fits a linear trend model over the specified period.
The final signal generation uses the formula: signal = lmaSlope * (0.5 + rSquared * 0.5) which combines the LMA slope with trend quality weighting. When momentum confirmation is enabled, the indicator calculates annualized log-return momentum and applies a multiplier when the momentum direction aligns with the signal direction, strengthening confirmed signals while filtering out weak or counter-trend movements.
🟢 How to Use
1. Signal Interpretation and Threshold Zones
Positive Values (Above Zero): LMA slope indicating bullish momentum with upward price trajectory relative to logarithmic baseline
Negative Values (Below Zero): LMA slope indicating bearish momentum with downward price trajectory relative to logarithmic baseline
Zero Line Crosses: Signal transitions between bullish and bearish regimes, indicating potential trend changes
Long Entry Threshold Zone: Area above positive threshold (default 0.5) indicating confirmed bullish signals suitable for long positions
Short Entry Threshold Zone: Area below negative threshold (default -0.5) indicating confirmed bearish signals suitable for short positions
Extreme Values: Signals exceeding ±1.0 represent strong momentum conditions with higher probability of continuation
2. Momentum Confirmation and Visual Analysis
Signal Color Intensity: Gradient coloring shows signal strength, with brighter colors indicating stronger momentum
Bar Coloring: Optional price bar coloring matches signal direction for quick visual trend identification
Position Labels: Real-time position classification (Bullish/Bearish/Neutral) displayed on the latest bar
Momentum Weight Factor: When short-term log-return momentum aligns with LMA signal direction, the signal receives additional weight confirmation
Trend Quality Component: R-squared values weight the signal strength, with higher correlation indicating more reliable trend conditions
3. Examples: Preconfigured Settings
Default: Universally applicable configuration balanced for medium-term investing and general trading across multiple timeframes and asset classes.
Scalping: Highly responsive setup with shorter period and higher steepness for ultra-short-term trades on 1-15 minute charts, optimized for quick momentum shifts.
Swing Trading: Extended period with moderate steepness and increased smoothing for multi-day positions, designed to filter noise while capturing larger price swings on 1-4 hour and daily charts.
Trend Following: Maximum smoothing with lower steepness for established trend identification, generating fewer but more reliable signals optimal for daily and weekly timeframes.
Mean Reversion: Shorter period with high steepness for counter-trend strategies, more sensitive to extreme moves and reversal opportunities in ranging market conditions.

Adaptive Range Scalper - KetBotAIThe Adaptive Scalper is designed to dynamically adjust entry, take-profit (TP), and stop-loss (SL) levels based on the latest market price. It combines multiple tools to provide traders with actionable insights, suitable for a range of trading styles and timeframes.
How the Indicator Works
Dynamic Levels:
- Yellow Dotted Line: Represents the entry level, following the latest price dynamically.
- Green Line: The Take Profit (TP) level, calculated as a multiple of the current price, adapts in real-time.
- Red Line: The Stop Loss (SL) level, placed below the price and also dynamically adjusts.
Bollinger Bands:
Provides context for market volatility and potential overbought/oversold zones.
Narrowing bands signal consolidation, while expanding bands indicate increased volatility.
Buy and Sell Signals:
Buy Signal: Triggered when the price crosses above the lower Bollinger Band.
Sell Signal: Triggered when the price crosses below the upper Bollinger Band.
These signals help traders time entries and exits based on momentum shifts.
Risk/Reward Analysis:
Visual shading shows the favorable risk/reward zone between the stop loss and take profit levels.
Timeframe Suggestions
Short-Term Traders (Scalping):
Use on 5-minute to 15-minute charts.
Focus on high-volatility periods for quick entries and exits.
Intraday Traders:
Ideal for 30-minute to 1-hour charts.
Provides more stable signals and less noise.
Swing Traders:
Best suited for 4-hour or daily charts.
Captures broader trends with fewer signals, allowing for larger moves.
Tool Combination
Volume Profile:
Combine with volume-based tools to confirm key support/resistance zones around TP and SL levels.
Trend Indicators:
Use with Moving Averages (e.g., 20-period or 50-period) to identify the broader trend direction.
Example: Only take buy signals in an uptrend and sell signals in a downtrend.
Momentum Oscillators:
Pair with tools like RSI or MACD to avoid entering overbought/oversold conditions.
Support/Resistance Lines:
Manually mark significant levels to confirm alignment with the indicator’s TP and SL zones.
Useful Advice for Traders
Risk Management:
- Always assess the risk/reward ratio; aim for at least 1:2 (risking 1 to gain 2).
- Adjust the multiplier to match your trading style (e.g., higher multiplier for swing trades, lower for scalping).
Avoid Overtrading:
Use the indicator in conjunction with clear rules to avoid false signals during low-volatility periods.
Monitor market volatility:
Pay attention to narrowing Bollinger Bands, which signal consolidations. Avoid trading until a breakout occurs.
Test on Demo Accounts:
Practice using the indicator on a demo account to understand its behavior across different assets and timeframes.
Focus on High-Liquidity Markets:
For the best results, trade highly liquid instruments like major currency pairs, gold, or stock indices.
Summary
The Adaptive Range Indicator dynamically adjusts to market conditions, offering clear entry and exit levels. By combining it with Bollinger Bands and other tools, traders can better navigate market trends and avoid noise. It’s versatile across multiple timeframes and assets, making it a valuable addition to any trader’s toolkit.

Ninja Scalping: IndicatorThis is a strategy version for scalping signals. The objective of these signals is to accumulate more BTC through buying and selling of Altcoins. Thus, it is expected that these signals yield BTC gains when the crypto market has bullish days, as when BTC bleeds, other coins bleed even more. Let us get ready for the altseason!!
As mentioned above, the goal is to increase BTC's holdings through buying and selling of Alts. However, different Alts react differently against BTC. Therefore, there is no set of parameters that works for all Alts. The good news is that I tried my best to limit the number of parameters required to be tuned for a specific Alt to two. Also, this strategy helps back-test and tune the parameters for the desired Altcoin, with no guarantee that what happened in the past would happen in the future. This strategy is generally conservative, and it does not enter many trades. However, you can be more aggressive by changing the multiplier value: the smaller the value, the more aggressive the strategies. One can be more aggressive when the market is super bullish. Actually, you can test this by playing with the dates for the back-testing to have an idea of what would be suitable parameters when BTC is strong or weak. For the image attached, the strategy is back-tested from Jan 1, 2021, to March 18, 2021, assuming an initial capital of 1 BTC.
For the time span parameter, typical values are 5, 10, 14, 21, 34, 50, and 100. For the multiplier, typical values range between 0.01 and 2.
Use it at your own risk. Feedbacks are more than welcome. Happy trading!

1 (or) 5-Minute Scalping Strategy - KGP1-Minute Scalping Strategy - KGP
Overview: This indicator is designed for short-term traders who engage in 1 (or) 5-minute scalping. It combines several technical analysis tools to provide buy and sell signals, helping traders make informed decisions quickly.
Key Features:
VWAP (Volume Weighted Average Price):
Purpose: VWAP provides the average price a security has traded at throughout the day, based on both volume and price.
Usage: Helps identify the overall trend and potential entry points. When the price is above VWAP, it indicates a bullish trend; when below, it indicates a bearish trend.
RSI (Relative Strength Index):
Purpose: RSI measures the speed and change of price movements, indicating overbought or oversold conditions.
Usage: The RSI values between 30 and 70 are used to filter trades. A value above 70 indicates overbought conditions, while below 30 indicates oversold conditions.
Custom OBV (On Balance Volume):
Purpose: OBV uses volume flow to predict changes in stock price.
Usage: Helps confirm the strength of a trend. Increasing OBV indicates accumulation (buying pressure), while decreasing OBV indicates distribution (selling pressure).
Multi-Timeframe Analysis:
Purpose: Confirms signals by analyzing RSI on a higher timeframe (5-minute chart).
Usage: Ensures that signals on the 1-minute chart align with the broader trend on the 5-minute chart, reducing false signals.
Signals:
Buy Signal:
Triggered when the price crosses above the VWAP, and the RSI is between 50 and 70 on both the 1-minute and 5-minute charts.
Visual Cue: A green “BUY” label appears below the bar.'
Sell Signal:
Triggered when the price crosses below the VWAP, and the RSI is between 30 and 50 on both the 1-minute and 5-minute charts.
Visual Cue: A red “SELL” label appears above the bar.
Alerts:
Buy Alert: Notifies you when a buy signal is detected.
Sell Alert: Notifies you when a sell signal is detected.
Additional Visuals:
VWAP Line: Plotted in blue to show the average price based on volume.
OBV Line: Plotted in purple to indicate volume flow.
RSI Line: Plotted in orange with horizontal lines at 70 (overbought) and 30 (oversold) levels.
