Multi-Band Breakout IndicatorThe Multi-Band Breakout Indicator was created to help identify potential breakout opportunities in the market. It combines multiple bands (ATR-Based and Donchian) and moving averages to provide valuable insights into the underlying trend and potential breakouts. By understanding the calculations, interpretation, parameter adjustments, potential applications, and limitations of the indicator, traders can effectively incorporate it into their trading strategy.
Calculation:
The indicator utilizes several calculations to plot the bands and moving averages. The length parameter determines the period used for the Average True Range (ATR), which measures volatility. A higher length captures a longer-term view of price movement, while a lower length focuses on shorter-term volatility. The multiplier parameter adjusts the distance of the upper and lower bands from the ATR. A higher multiplier expands the bands, accommodating greater price volatility, while a lower multiplier tightens the bands, reflecting lower volatility. The MA Length parameter determines the period for the moving averages used to calculate the trend and trend moving average. A higher MA Length creates a smoother trend line, filtering out shorter-term fluctuations, while a lower MA Length provides a more sensitive trend line.
The Donchian calculations in the Multi-Band Breakout Indicator play a significant role in identifying potential breakout opportunities and providing additional confirmation for trading signals. In this indicator, the Donchian calculations are applied to the trend line, which represents the average of the upper and lower bands. To calculate the Donchian levels, the indicator uses the Donchian Length parameter, which determines the period over which the highest high and lowest low are calculated. A longer Donchian Length captures a broader price range, while a shorter length focuses on more recent price action. By incorporating the Donchian calculations into the Multi-Band Breakout Indicator, traders gain an additional layer of confirmation for breakout signals.
Interpretation:
The Multi-Band Breakout Indicator offers valuable interpretation for traders. The upper and lower bands represent dynamic levels of resistance and support, respectively. These bands reflect the potential price range within which the asset is expected to trade. The trend line is the average of these bands and provides a central reference point for the overall trend. When the price moves above the upper band, it suggests a potential overbought condition and a higher probability of a pullback. Conversely, when the price falls below the lower band, it indicates a potential oversold condition and an increased likelihood of a bounce. The trend moving average further smooths the trend line, making it easier to identify the prevailing direction.
The crossover of the trend line (representing the average of the upper and lower bands) and the trend moving average holds a significant benefit for traders. This crossover serves as a powerful signal for potential trend changes and breakout opportunities in the market. When the trend line crosses above the trend moving average, it suggests a shift in momentum towards the upside, indicating a potential bullish trend. This provides traders with an early indication of a possible upward movement in prices. Conversely, when the trend line crosses below the trend moving average, it indicates a shift in momentum towards the downside, signaling a potential bearish trend. This crossover acts as an early warning for potential downward price movement. By identifying these crossovers, traders can capture the initial stages of a new trend, enabling them to enter trades at favorable entry points and potentially maximize their profit potential.
Breakout Signals:
For bullish breakouts, the indicator looks for a bullish crossover between the trend line and the trend moving average. This crossover suggests a shift in momentum towards the upside. Additionally, it checks if the current price has broken above the upper band and the previous Donchian high. This confirms that the price is surpassing a previous resistance level, indicating further upward movement.
For bearish breakouts, the indicator looks for a bearish crossunder between the trend line and the trend moving average. This crossunder indicates a shift in momentum towards the downside. It also checks if the current price has broken below the lower band and the previous Donchian low. This confirms that the price is breaking through a previous support level, signaling potential downward movement.
When a bullish or bearish breakout is detected, it suggests a potential trading opportunity. Traders may consider initiating positions in the direction of the breakout, anticipating further price movement in that direction. However, it's important to remember that breakouts alone do not guarantee a successful trade. Other factors, such as market conditions, volume, and confirmation from additional indicators, should be taken into account. Risk management techniques should also be implemented to manage potential losses.
Coloration:
The coloration in the Multi-Band Breakout Indicator is used to visually represent different aspects of the indicator and provide valuable insights to traders. Let's break down the coloration components:
-- Trend/Basis Color : The tColor variable determines the color of the bars based on the relationship between the trend line (trend) and the closing price (close), as well as the relationship between the trend line and the trend moving average (trendMA). If the trend line is above the closing price and the trend moving average is also above the closing price, the bars are colored fuchsia, indicating a potential bullish trend. If the trend line is below the closing price and the trend moving average is also below the closing price, the bars are colored lime, indicating a potential bearish trend. If neither of these conditions is met, the bars are colored yellow, representing a neutral or indecisive market condition.
-- Moving Average Color : The maColor variable determines the color of the filled area between the trend line and the trend moving average. If the trend line is above the trend moving average, the area is filled with a lime color with 70% opacity, indicating a potential bullish trend. Conversely, if the trend line is below the trend moving average, the area is filled with a fuchsia color with 70% opacity, indicating a potential bearish trend. This coloration helps traders visually identify the relationship between the trend line and the trend moving average.
-- highColor and lowColor : The highColor and lowColor variables determine the colors of the high Donchian band (hhigh) and the low Donchian band (llow), respectively. These bands represent dynamic levels of resistance and support. If the highest point in the previous Donchian period (hhigh) is above the upper band, the highColor is set to olive with 90% opacity, indicating a potential resistance level. On the other hand, if the lowest point in the previous Donchian period (llow) is below the lower band, the lowColor is set to red with 90% opacity, suggesting a potential support level. These colorations help traders quickly identify important price levels and assess their significance in relation to the bands.
By incorporating coloration, the Multi-Band Breakout Indicator provides visual cues to traders, making it easier to interpret the relationships between various components and assisting in identifying potential trend changes and breakout opportunities. Traders can use these color cues to quickly assess the prevailing market conditions and make informed trading decisions.
Adjusting Parameters:
The Multi-Band Breakout Indicator offers flexibility through parameter adjustments. Traders can customize the indicator based on their preferences and trading style. The length parameter controls the sensitivity to price changes, with higher values capturing longer-term trends, while lower values focus on shorter-term price movements. By adjusting the parameters, such as the ATR length, multiplier, Donchian length, and MA length, traders can customize the indicator to suit different timeframes and trading strategies. For shorter timeframes, smaller values for these parameters may be more suitable, while longer timeframes may require larger values.
Potential Applications:
The Multi-Band Breakout Indicator can be applied in various trading strategies. It helps identify potential breakout opportunities, allowing traders to enter trades in the direction of the breakout. Traders can use the indicator to initiate trades when the price moves above the upper band or below the lower band, confirming a potential breakout and providing a signal to enter a trade. Additionally, the indicator can be combined with other technical analysis tools, such as support and resistance levels, candlestick patterns, or trend indicators, to increase the probability of successful trades. By incorporating the Multi-Band Breakout Indicator into their trading approach, traders can gain a better understanding of market trends and capture potential profit opportunities.
Limitations:
While the Multi-Band Breakout Indicator is a useful tool, it has some limitations that traders should consider. The indicator performs best in trending markets where price movements are relatively strong and sustained. During ranging or choppy market conditions, the indicator may generate false signals, leading to potential losses. It is crucial to use the indicator in conjunction with other analysis techniques and risk management strategies to enhance its effectiveness. Additionally, traders should consider external factors such as market news, economic events, and overall market sentiment when interpreting the signals generated by the indicator.
By combining multiple bands and moving averages, this indicator offers valuable insights into the underlying trend and helps traders make informed trading decisions. With customization options and careful interpretation, this indicator can be a valuable addition to any trader's toolkit, assisting in identifying potential breakouts, capturing profitable trades, and enhancing overall trading performance.
In den Scripts nach "profitable" suchen

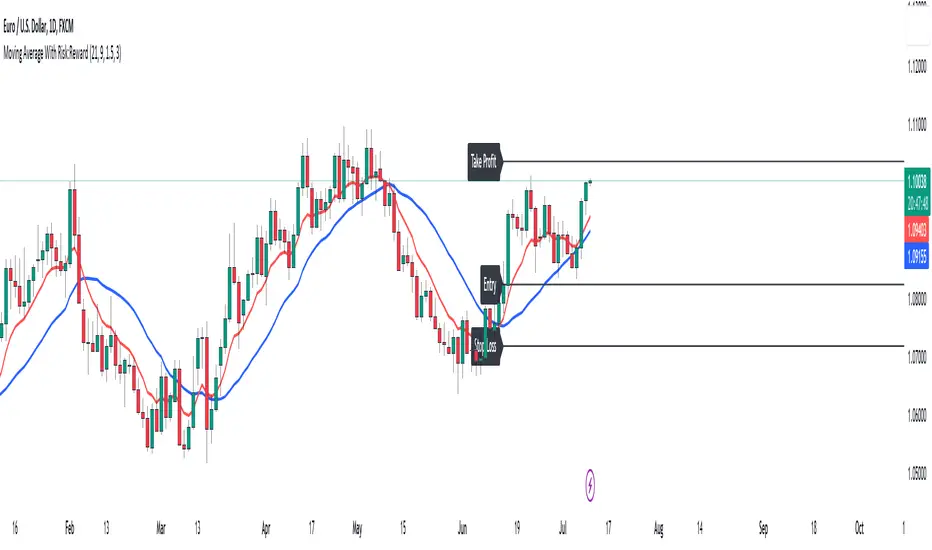
Moving Average With Risk:Reward**Title: A Detailed Guide to Using the Moving Average With Risk:Reward Indicator**
The dynamic world of financial markets offers a myriad of opportunities for market participants to make profitable trades. However, to unlock these opportunities, traders require reliable tools to guide their decisions, tools such as technical indicators. One such indicator is the 'Moving Average With Risk:Reward' Indicator, a versatile tool that combines the simple moving average (SMA), exponential moving average (EMA), Average True Range (ATR) indicator, and automated entry, stop-loss, and take-profit markers to provide a comprehensive analysis of market trends. This article aims to detail the use and interpretation of this indicator.
**Understanding the Building Blocks**
1. **Moving Averages (SMA & EMA):**
Moving averages are arguably some of the most common tools used by traders worldwide. They help smooth out price data to form a trend following indicator. Our custom indicator utilizes both a 21-period SMA, which averages the closing prices of the past 21 periods, and a 9-period EMA, which gives more weight to recent prices. The difference in sensitivity between these two moving averages forms the basis of our trade signals.
2. **Average True Range (ATR):**
The ATR is an essential component of our indicator. It measures market volatility by decomposing the entire range of an asset price for that period. It plays a critical role in determining the stop loss and take profit levels in our indicator, as detailed later.
**How the Indicator Works**
Our custom indicator works by generating buy or sell signals based on crossover and crossunder events between the SMA and EMA. A crossover occurs when the EMA (more sensitive to recent prices) crosses above the SMA, indicating upward momentum and hence triggering a buy signal. Conversely, a crossunder, where the EMA moves below the SMA, indicates increasing downward momentum and generates a sell signal.
Upon the generation of a signal, the indicator draws lines on the chart to represent the entry point, stop loss, and take profit levels. The user has the freedom to adjust the color of these lines for visual clarity. The script will also delete previous lines whenever a new signal is generated to avoid clutter and confusion.
**Determining the Stop Loss and Take Profit Levels**
Our custom indicator uses the ATR and a predetermined multiplier to calculate stop loss and take profit levels, thus incorporating market volatility into these critical decisions. The user can input their preferred multiplier for both stop loss and take profit.
Stop Loss (SL): SL is set at a level that is the ATR value multiplied by the stop-loss multiplier subtracted from (for a long position) or added to (for a short position) the closing price.
Take Profit (TP): Conversely, TP is set at a level that is the ATR value multiplied by the take-profit multiplier added to (for a long position) or subtracted from (for a short position) the closing price.
These SL and TP levels get plotted as horizontal lines on the chart, extending to the right. Labels are also placed to easily identify these levels.
**Making the Most of the Indicator**
A significant advantage of this indicator lies in its simplicity and clarity. Traders can clearly see the entry point, stop loss, and take profit levels on the chart. They can modify these levels based on their risk tolerance or trading strategy.
The combination of SMA and EMA offers the best of both worlds, with SMA providing a lagging, stable trend indication and EMA offering a more responsive indication to recent price changes. The indicator's use of ATR for SL and TP settings also ensures that these levels adapt to changing market volatility.
It is essential to remember that while this indicator can be an invaluable tool in a trader's arsenal, it is not infallible. Markets can often behave unpredictably, and even the most robust and reliable indicators can occasionally generate false signals. Therefore, traders should always employ sound money management strategies and use this indicator in conjunction with other technical analysis tools and fundamental analysis to confirm signals and make informed trading decisions.
In conclusion, the Moving Average With Risk:Reward indicator provides a comprehensive and versatile tool that can significantly enhance trading strategies. Its integration of trend-following moving averages, volatility-adjusted stop loss and take profit levels, and clear chart visualizations make it a potent tool in the financial markets. By fully understanding how to interpret and utilize this indicator, traders can navigate the markets with increased confidence and precision.
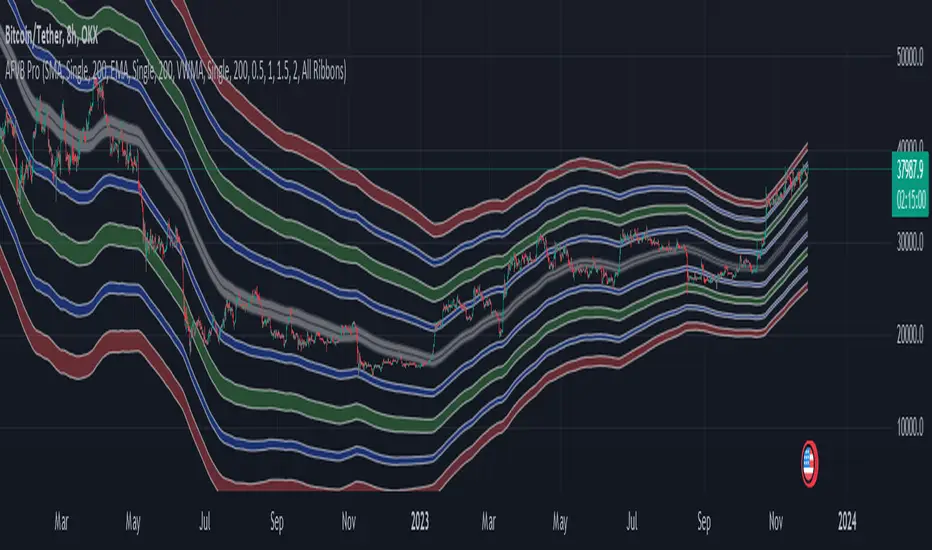
Apeiron Fair Value BandsThe Apeiron Fair Value Bands take into account a given MA and determine a Fair Value Area (FVA) for the price of a certain asset. The script plots a MA and a tolerance ribbon for it, as well as 2 bands (preset to 1 Standard deviations and 2 Standard deviations respectively, which can be manually changed) with a tolerance ribbon as well.
This creates 3 areas of interest:
The MA ribbon
The inside of the first upper and lower band (1 standard deviation) where price should stay within around 68% percent of the time according to the normal distribution
The inside of the second upper and lower band (2 standard deviations) where price should stay within around 95% percent of the time according to the normal distribution
Taking this into account, Fair Value analysis can be done:
Premium and Discount Prices: From a very simplistic point of view, when price is below a MA it can be considered to be at a discount and when it is above at a premium. Combining that idea with the levels given by the bands, we can determine if we are buying at premium or at a discount, specially on HTF and when considering investing, thus allowing to enter or exit the market with a higher probability of being on the right side of the trend and at a good level. As seen on the example, buying or selling at the highlighted levels would have been profitable with little drawdown.
VAH & VAL: (1 Standard Deviation Bands) Same as a Market Profile, price will stay in here "most" of the time. And particularly during ranging periods, they will provide potential revesal levels. As well, once prices breaks out of it, depending of the reaction to the second band, we can consider it a deviation or the beggining of a new trend. During strong trends, the bands can also serve as a correction support as the MA would do
New Fair Vaue Range: Once a new trend has begun, it will often slide on or break through Band 2, which can be interpreted as price creating a new Fair Value Range low or high. As seen on the chart, once price breaks out, those levels tend to be respected and relevant during corrections. I must make it very clear that this is just an analytical feature meant to be used in confluence with S/R, Supply & Demand, FVGs, Fibs or others. While it can be accurate sometimes, it might not be other times and be only "close".
Exhaustions: I call exhaustions to the scenarios when price keeps going up/down but it fails to keep pushing the fair value area with it. This indicates weakness in the trend and a potential reversal or correction. These appear on all Timeframes and symbols and are very good indications of tops and bottoms, specially after strong rallies or crashes. In the latter cases, waiting for price to re-enter it's FVA, provides great entries at the Bands levels.
Other features / Suggested Uses:
Middle levels: On the setup menu you can select different Standard deviation settings for each band including: 0.5, 1, 1.5, 2, 2.5 and 3. While the most relevant settings are 1 & 2, having their middle levels on the chart can provide extra levels for very tight ranges or just in general potential reversal levels.
Multi Timeframe & Multi symbol: The bands work on very low TF as well as High TF, though on HTF it might be limited by the MA length settings and the historical data of the symbol. It is important to note that each symbol and market type will have its own ideal MA and Bands settings.
Multi Bands Confluence: Same as you would use a short and long MA in a single setup, you can do the same with the bands and the confluence of levels can be very accurate.
Multi Timeframe Confluence: One of the best ways to use the bands so far is by using it in confluence with itself in other TFs, when price moves sharply into a confluent level given by multiple TFs, it is more likely for price to reverse there.
Most of the examples show a 200 SMA, but depending on what and how you are trading a shorter or longer MA might be a better fit for you. As well, if you are trading ranges, a VWMA might be much better, and if you are following a trend the EMA could be the better option.
I also want to make it clear that the bands can but are NOT meant to be a standalone indicator. They are meant to be used for confluence with other strategies, systems or indicators.
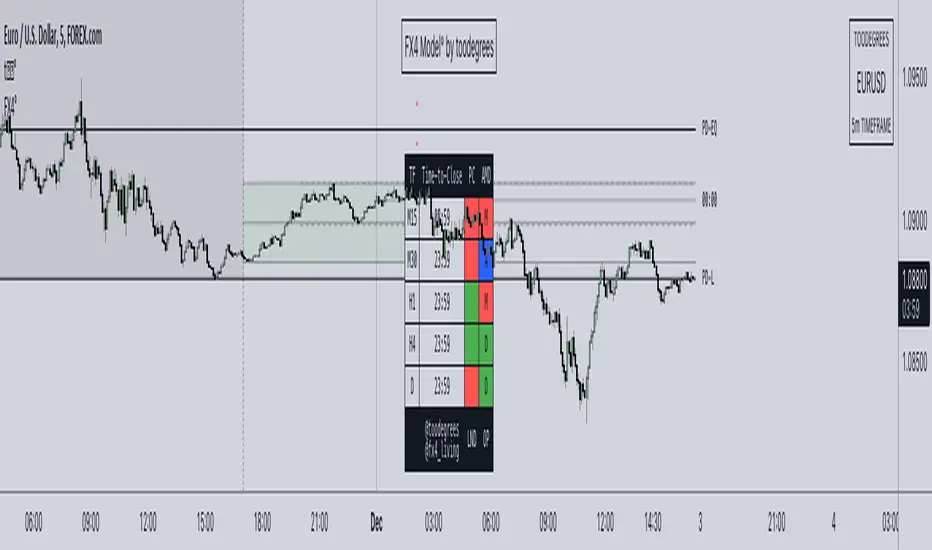
FX4Model° [fx4_living x toodegrees]Introducing the FX4 Model, an advanced automated trading framework designed to optimize your trading positions made by the trader fx4_living. This model integrates the previous day's high and low, and half of that range, to identify premium and discount zones.
The FX4 Model incorporates the ICT Asian range, spanning from 20:00 (New York time) to the midnight open. This period constitutes part of the day's accumulation range, during which a large volume of orders is processed. This implies that the high and low of this range are perceived as crucial liquidity pool zones.
The FX4 Model features a time-based dashboard. This dashboard presents key information such as the close of the previous candle. It also indicates the remaining time before certain significant candle closes (price and time).
With this tool, you gain a robust trading framework that empowers you to capitalize on profitable trading opportunities.
The FX4 accumulation range spans from the previous day's close to 2 AM New York local time. This range is part of the day's accumulation period, during which a lot of orders are triggered. Therefore, the high and the low of this range are seen as vital liquidity pool zones.
The ICT midnight open is marked with a vertical line at 00:00. This refers to the opening price of a financial instrument at midnight New York time. This opening price is significant as it serves as a reference point for trading strategies.
Time-To-Close Dashboard
This outstanding Dashboard displays the Time Frame and its "Time-To-Close".
It shows the Previous Candle Close (Bullish or Bearish).
The Time will appear in Red when there's 5 minutes left before the candle closes.
Previous Day Range (High-Low + 50%)
The previous day's high and low (PD) ranges can be leveraged in your trading strategy for the current day, using them as reference points for potential trading opportunities. The 50% division creates premium and discount zones within the previous day's range. If the price is in the discount zone, you should look for a buy opportunity, whereas if the price is in the premium zone, a sell opportunity should be considered.
FX4 Accumulation Range (High-Low + 50%)
The accumulation range's high and low points provide the most recent liquidity zone for the current day. These points can be used as reference points for potential trading opportunities. The 50% division here also creates premium and discount zones within the accumulation range. If the price is in the discount zone, a buy opportunity should be considered, and if the price is in the premium zone, a sell opportunity should be considered.
Other features:
Automatic Time Zone: As the title suggests, the automatic time zone feature means that you'll never need to adjust any GMT or hour settings. Everything updates automatically, even if you don't live on the East Coast of the United States.
Automatic Dark/Light Mode All graphics will automatically adapt their color based on your background. There's no need to tweak any settings; they're designed to provide consistent visuals.
Developing Market Profile / TPO [Honestcowboy]The Developing Market Profile Indicator aims to broaden the horizon of Market Profile / TPO research and trading. While standard Market Profiles aim is to show where PRICE is in relation to TIME on a previous session (usually a day). Developing Market Profile will change bar by bar and display PRICE in relation to TIME for a user specified number of past bars.
What is a market profile?
"Market Profile is an intra-day charting technique (price vertical, time/activity horizontal) devised by J. Peter Steidlmayer. Steidlmayer was seeking a way to determine and to evaluate market value as it developed in the day time frame. The concept was to display price on a vertical axis against time on the horizontal, and the ensuing graphic generally is a bell shape--fatter at the middle prices, with activity trailing off and volume diminished at the extreme higher and lower prices."
For education on market profiles I recommend you search the net and study some profitable traders who use it.
Key Differences
Does not have a value area but distinguishes each column in relation to the biggest column in percentage terms.
Updates bar by bar
Does not take sessions into account
Shows historical values for each bar
While there is an entire education system build around Market Profiles they usually focus on a daily profile and in some cases how the value area develops during the day (there are indicators showing the developing value area).
The idea of trading based on a developing value area is what inspired me to build the Developing Market Profile.
🟦 CALCULATION
Think of this Developing Market Profile the same way as you would think of a moving average. On each bar it will lookback 200 bars (or as user specified) and calculate a Market Profile from those bars (range).
🔹Market Profile gets calculated using these steps:
Get the highest high and lowest low of the price range.
Separate that range into user specified amount of price zones (all spaced evenly)
Loop through the ranges bars and on each bar check in which price zones price was, then add +1 to the zones price was in (we do this using the OccurenceArray)
After it looped through all bars in the range it will draw columns for each price zone (using boxes) and make them as wide as the OccurenceArray dictates in number of bars
🔹Coloring each column:
The script will find the biggest column in the Profile and use that as a reference for all other columns. It will then decide for each column individually how big it is in % compared to the biggest column. It will use that percentage to decide which color to give it, top 20% will be red, top 40% purple, top 60% blue, top 80% green and all the rest yellow. The user is able to adjust these numbers for further customisation.
The historical display of the profiles uses plotchar() and will not only use the color of the column at that time but the % rating will also decide transparancy for further detail when analysing how the profiles developed over time. Each of those historical profiles is calculated using its own 200 past bars. This makes the script very heavy and that is why it includes optimisation settings, more info below.
🟦 USAGE
My general idea of the markets is that they are ever changing and that in studying that changing behaviour a good trader is able to distinguish new behaviour from old behaviour and adapt his approach before losing traders "weak hands" do.
A Market Profile can visually show a trader what kind of market environment we currently are in. In training this visual feedback helps traders remember past market environments and how the market behaved during these times.
Use the history shown using plotchars in colors to get an idea of how the Market Profile looked at each bar of the chart.
This history will help in studying how price moves at different stages of the Market Profile development.
I'm in no way an expert in trading Market Profiles so take this information with a grain of salt. Below an idea of how I would trade using this indicator:
🟦 SETTINGS
🔹MARKET PROFILING
Lookback: The amount of bars the Market Profile will look in the past to calculate where price has been the most in that range
Resolution: This is the amount of columns the Market Profile will have. These columns are calculated using the highest and lowest point price has been for the lookback period
Resolution is limited to a maximum of 32 because of pinescript plotting limits (64). Each plotchar() because of using variable colors takes up 2 of these slots
🔹VISUAL SETTINGS
Profile Distance From Chart: The amount of bars the market profile will be offset from the current bar
Border width (MP): The line thickness of the Market Profile column borders
Character: This is the character the history will use to show past profiles, default is a square.
Color theme: You can pick 5 colors from biggest column of the Profile to smallest column of the profile.
Numbers: these are for % to decide column color. So on default top 20% will be red, top 40% purple... Always use these in descending order
Show Market Profile: This setting will enable/disable the current Market Profile (columns on right side of current bar)
Show Profile History: This setting will enable/disable the Profile History which are the colored characters you see on each bar
🔹OPTIMISATION AND DEBUGGING
Calculate from here: The Market Profile will only start to calculate bar by bar from this point. Setting is needed to optimise loading time and quite frankly without it the script would probably exceed tradingview loading time limits.
Min Size: This setting is there to avoid visual bugs in the script. Scaling the chart there can be issues where the Market Profile extends all the way to 0. To avoid this use a minimum size bigger than the bugged bottom box

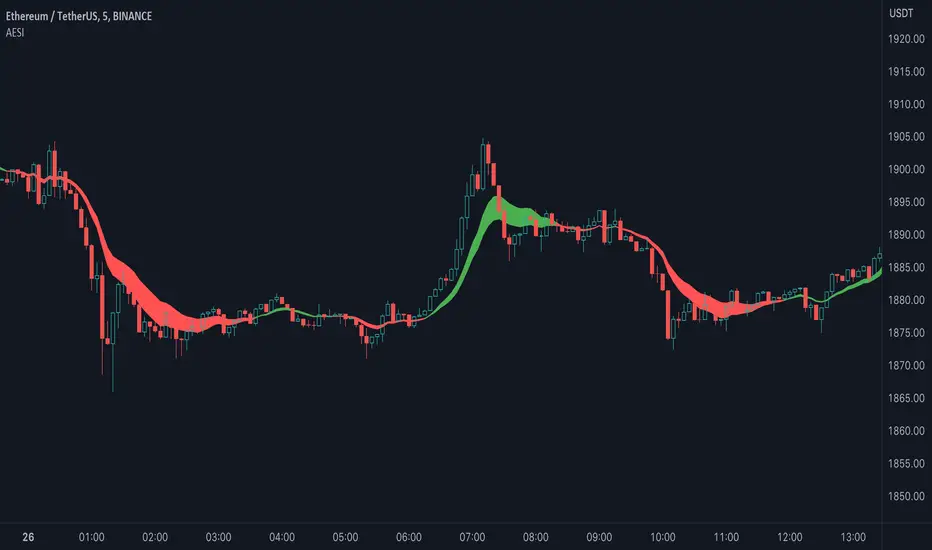
Advanced Exponential Smoothing Indicator (AESI) [AstrideUnicorn]The Advanced Exponential Smoothing Indicator (AESI) provides a smoothed representation of price data using the exponential smoothing technique. It helps traders identify the overall trend and potential reversal points in the market.
SETTINGS
Length: The number of periods used for the calculation of the exponential moving average (EMA). Higher values provide a smoother result but may lag behind price movements.
Alpha: The smoothing factor that determines the weight of the recent price data in the smoothing calculation. Higher values give more weight to recent data, resulting in a more responsive indicator.
Cloud Mode: Determines whether to display a cloud between the AESI line and the EMA line. When enabled, the cloud represents bullish (green) and bearish (red) market conditions.
HOW TO USE
The AESI indicator consists of a single line that represents the advanced exponential smoothing of the price data. It aims to provide a smoother version of the price series, reducing noise and revealing the underlying trend.
Bullish Condition: When the AESI line is above the EMA line, it indicates a bullish market condition. Traders may consider looking for buying opportunities or holding onto existing long positions.
Bearish Condition: When the AESI line is below the EMA line, it suggests a bearish market condition. Traders may consider looking for selling opportunities or holding onto existing short positions.
Optional Cloud Mode:
Enabling the cloud mode allows you to visualize bullish and bearish market conditions more clearly. The cloud appears between the AESI line and the EMA line, providing a visual representation of the prevailing market sentiment.
Bullish Cloud: When the AESI line is above the EMA line, the cloud is green, indicating a potential bullish market condition.
Bearish Cloud: When the AESI line is below the EMA line, the cloud is red, indicating a potential bearish market condition.
Note: The AESI indicator is most effective when used in conjunction with other technical analysis tools and indicators to confirm trading signals and make informed trading decisions.
Adjusting the Parameters:
You can adjust the Length and Alpha parameters to find the best ones for different timeframes and market conditions. Experimenting with different parameter values can help you find the optimal settings for your trading strategy.
It is recommended to backtest the AESI indicator on historical price data and evaluate its performance before using it in live trading. Remember that no indicator can guarantee profitable trades, and it is important to use risk management techniques and exercise caution when making trading decisions.
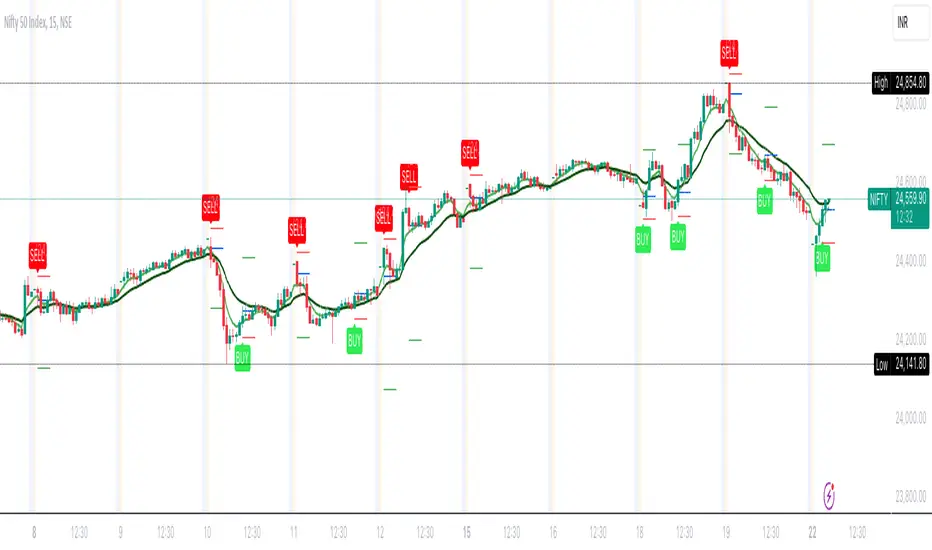
FalconRed 5 EMA Indicator (Powerofstocks)Improved version:
This indicator is based on Subhashish Pani's "Power of Stocks" 5 EMA Strategy, which aims to identify potential buying and selling opportunities in the market. The indicator plots the 5 EMA (Exponential Moving Average) and generates Buy/Sell signals with corresponding Target and Stoploss levels.
Subhashish Pani's 5 EMA Strategy is a straightforward approach. For intraday trading, a 5-minute timeframe is recommended for selling. In this strategy, you can choose to sell futures, sell calls, or buy puts as part of your selling strategy. The goal is to capture market tops by selling at the peak, anticipating a reversal for profitable trades. Although this strategy may result in frequent stop losses, they are typically small, while the minimum target should be at least three times the risk taken. By staying aligned with the trend, significant profits can be achieved. Subhashish Pani claims that this strategy has a 60% success rate.
Strategy for Selling (Short Future/Call/Stock or Buy Put):
1. When a candle completely closes above the 5 EMA (with no part of the candle touching the 5 EMA), it is considered an Alert Candle.
2. If the next candle is also entirely above the 5 EMA and does not break the low of the previous Alert Candle, ignore the previous Alert Candle and consider the new candle as the new Alert Candle.
3. Continue shifting the Alert Candle in this manner. However, when the next candle breaks the low of the Alert Candle, take a short trade (e.g., short futures, calls, stocks, or buy puts).
4. Set the stop loss above the high of the Alert Candle, and the minimum target should be 1:3 (at least three times the stop loss).
Strategy for Buying (Buy Future/Call/Stock or Sell Put):
1. When a candle completely closes below the 5 EMA (with no part of the candle touching the 5 EMA), it is considered an Alert Candle.
2. If the next candle is also entirely below the 5 EMA and does not break the high of the previous Alert Candle, ignore the previous Alert Candle and consider the new candle as the new Alert Candle.
3. Continue shifting the Alert Candle in this manner. However, when the next candle breaks the high of the Alert Candle, take a long trade (e.g., buy futures, calls, stocks, or sell puts).
4. Set the stop loss below the low of the Alert Candle, and the minimum target should be 1:3 (at least three times the stop loss).
Buy/Sell with Additional Conditions:
An additional condition is added to the buying/selling strategy:
1. Check if the closing price of the current candle is lower than the closing price of the Alert Candle for selling, or higher than the closing price of the Alert Candle for buying.
- This condition aims to filter out false moves, potentially preventing entering trades based on temporary fluctuations. However, it may cause you to miss out on significant moves, as you will enter trades after the candle closes, rather than at the breakout point.
Note: According to Subhashish Pani, the recommended timeframe for intraday buying is 15 minutes. However, this strategy can also be applied to positional/swing trading. If used on a monthly timeframe, it can be beneficial for long-term investing as well. The rules remain the same for all types of trades and timeframes.
If you need a deeper understanding of this strategy, you can search for "Subhashish Pani's (Power of Stocks) 5 EMA Strategy" on YouTube for further explanations.
Note: This strategy is not limited to intraday trading and can be applied to positional/swing
QFL Screener [ ZCrypto ]The QFL Screener is a robust tool inspired by Quickfingersluc's trading strategy.
Known as the Base Strategy or Mean Reversals, QFL focuses on identifying moments of panic selling and buying , presenting opportunities to enter trades at deeply discounted prices.
The QFL Screener is designed to enhance your trading efficiency by simultaneously scanning 40 symbols.
You have the flexibility to enable or disable specific symbols from the screening process, allowing you to tailor the screener to your preferred markets and instruments.
The Screener has a built-in alerts system . As soon as the QFL conditions align for any of the scanned symbols, you'll receive instant notifications, empowering you to take prompt action and seize potential trading opportunities.
In addition, I've incorporated a visual element to complement the alerts. Once the conditions are true, a green arrow shape will appear directly on the chart, providing a clear and intuitive signal of the QFL opportunity.
To provide a clear overview, our screener presents a comprehensive table that highlights when the QFL condition becomes true for each symbol. This table acts as a visual guide, enabling you to monitor the status of multiple symbols at a glance, streamlining your trading decision-making process.
With the QFL Screener, you gain an edge in identifying profitable trade setups based on Quickfingersluc's renowned approach. Experience the convenience of simultaneous screening, real-time alerts, and an intuitive table display, all in one user-friendly tool.

Dodge Trend [MyTradingCoder]Introducing the "Dodge Trend" indicator, an innovative variant of the Supertrend indicator designed to help traders better avoid fakeouts and maintain positions in established trends.
Like the Supertrend, the Dodge Trend uses Average True Range (ATR) but incorporates a unique adaptive adjustment feature that differentiates it from its counterparts. While the conventional Supertrend rises with the trend and only descends when the price crosses it, the Dodge Trend is designed to 'dodge' potential fakeouts.
This 'dodging' mechanism works by allowing the Dodge Trend to fall slightly during pullbacks, reducing the risk of a premature exit due to a temporary price drop. The recovery rate after the pullback is quicker but is slightly lower than the rate at which a new Dodge Trend high would be established in an uptrend. This unique adjustment feature allows the Dodge Trend to chase price action in an exponential fashion, potentially enabling a quicker exit when the trend shifts.
Key Settings:
Length: Adjust how much price action is taken into consideration for the ATR average. Lower values yield higher responsiveness to recent price action.
Size: Determines the initial deviation of the Dodge Trend when it resets after every flip/break.
Source: Specifies the data point (close, high, open, low, hl2, etc.) used for the Dodge Trend.
Dodge Intensity: Adjusts the intensity of the pullback effect. Higher values result in more intense pullbacks. Range is limited between 0 and 99, with 95 as the recommended default.
Bullish Color Setting: Sets the color for the uptrend Dodge Trend.
Bearish Color Setting: Sets the color for the downtrend Dodge Trend.
Dodge Trend is a powerful tool for traders looking to ride trends and avoid unnecessary exits due to short-term price fluctuations. While it offers a unique feature that may potentially improve trading outcomes, it should be used in conjunction with other indicators and analysis methods for a comprehensive trading strategy. As with all tools, it does not guarantee profitable trades but aims to give traders more actionable and precise information to base their decisions on.
Experience trend-following in a more adaptive and efficient manner with the Dodge Trend indicator, a tool designed to help you 'dodge' false exits and stay in line with the overall trend.

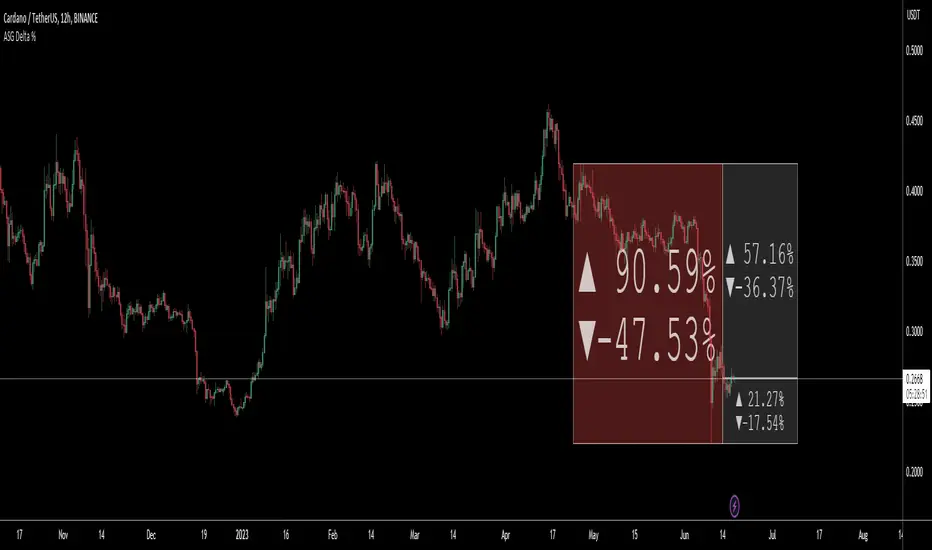
ASG Delta %This utility script provides a convenient way to calculate the percentage gain or drop of a token's price within a user-defined date range. It eliminates the need for manual measurement on individual charts, saving time and effort.
The script is particularly valuable when integrated into a daily token scanning routine for watchlists. By comparing the significant gains or drops among different tokens, traders can identify potential trading opportunities.
Simply select the desired date range, and the script will identify the highest and lowest price points achieved during that period. It then shows a visual representation in the form of a bullish or bearish box, displaying the percentage change (delta %). If the current price falls within the box's upper and lower bounds, additional percentage information can be shown in either the 'normal' or 'reverse' mode.
For instance, if a token experiences a -52.35% drop, enabling the 'Reverse' setting will reveal a potential 109.86% gain (from the low), or a 76.02% gain (from current price) or a potential drop of -16.5% (from current price) etc.. Having these basic statistics available, without having to manually chart them, especially during prolonged bear or bull markets, enables traders to make informed decisions and position themselves for more profitable trades.
I hope you find this script valuable. Your comments and recommendations are welcome as they will help improve the script's functionality further.
*ATR Levels*This script is an enhanced version of "Saty's ATR Levels". With the help of SimpleCryptoLife, he reimagined the script to include these differences:
-view the ATR levels easily with labels and know where the price action is in relation to a specific level
-the included "price follow line" extends across the screen and through the ATR levels label to allow you to easily identify which level you're in or about to enter either on an upswing or downswing
- a +/- 4 and 5 ATR level created that can be turned on for those crazy runners, occasionally a stock will run >5 ATR if you're lucky
Select levels are standard when firing up the indicator but you can click on the appropriate levels to suit your needs and save it from there.
There are several modes to choose from >> Day, Multiday, Swing, Position and Long-Term - Try them out and see what works best for your trading style. For instance:
-Day mode is great for, you guessed it, day trades whether long or shot and ideally paired with 1h or less timeframes
-Multiday is similar to Swing mode and is great for trades less than a week and generally paired with 30m to 1 day timeframe
-Swing mode is great for 1-3 week trades and can be used on higher timeframe such as 30m to 1 day
-Position & long term are of course for longer term trades and ideally paired with 4 hour to 1 month timeframes
ATR length of 14 is standard (look up "Wilder's 14")
Trend indicator based off of the 9-21-34 EMAs // - Range against ATR for each period // - Put and call trigger levels table was created by Saty, located in upper right
Generally, once a candle hits the 23.6% level, look to "go long" but be sure to wait for confluences that support your strategy. Maybe you can wait till the 38.2 level or even higher, dependent on your risk tolerance (stop loss recommended). A candle could come back and retest a certain level that you're eyeing and then continue upwards. As each level is hit, the greater the chance to hit 1 ATR (or higher!). You can start to scale out of a trade at any level but any of the main ATR levels like +1, +2 and so on would be ideal places to take some profit. Keep in mind that a stock can make a run in the pre-market and once the opening bell hits the stock might already be above the +1 ATR level or higher. Conversely the aforementioned is true for stocks to short. The -23.6% level would a "trigger" level but you can use -38.2 etc
Regarding the "use current close" check box: if you're in after or pre-market hours, the ATR levels will remain from the previous day so you'll want to check this box to see what the new levels will be for the current day. But you'll want to uncheck it and leave it unchecked throughout the trading day.
If you find this indicator invaluable and it helps you become a more consistent and profitable trader, feel free to give it a boost and leave a comment if you so desire. As always, trade at your own risk and never use more money than you afford to lose.

ATR Test (hakimnadir)TrendMaster Pro is a powerful trend-following indicator designed to assist traders in identifying and capitalizing on market trends. By combining two key components, Short-Term Trend 2 (ST2) and Short-Term Trend 3 (ST3), this indicator provides reliable entry signals and helps traders stay aligned with the prevailing market trend. With its user-friendly interface and customizable settings, TrendMaster Pro offers a comprehensive solution for traders seeking to enhance their trend trading strategies.
Key Features:
Short-Term Trend 2 (ST2):
Short-Term Trend 2 (ST2) serves as the primary entry signal for TrendMaster Pro. It is designed to identify short-term reversals within the market, providing traders with opportunities to enter trades at favorable prices. ST2 utilizes a combination of price action analysis, moving averages, and volatility indicators to generate accurate entry signals. When a bullish ST2 signal is generated, it indicates a potential buying opportunity, while a bearish signal suggests a potential selling opportunity.
Short-Term Trend 3 (ST3):
Short-Term Trend 3 (ST3) is the backbone of TrendMaster Pro, helping traders stay in alignment with the prevailing trend. ST3 focuses on the longer-term trend and acts as a confirmation filter for trades initiated based on ST2 signals. By considering the relationship between price, moving averages, and other trend indicators, ST3 helps traders filter out false signals and avoid trades against the dominant market trend. When ST3 confirms an ST2 signal, it strengthens the validity of the trade setup, increasing the probability of a successful trade.
Customizable Parameters:
TrendMaster Pro offers a range of customizable parameters, allowing traders to adapt the indicator to suit their trading preferences and timeframes. Users can adjust the sensitivity of ST2 and ST3 signals, enabling them to fine-tune the indicator based on their desired level of aggressiveness or conservatism. Additionally, traders can customize the color scheme and visual appearance of the indicator to enhance its visibility and integration with their charting setup.
Alert System:
To ensure traders never miss a potential trading opportunity, TrendMaster Pro includes a comprehensive alert system. Traders can set up audio or visual alerts to be notified when an ST2 signal is generated or when ST3 confirms an ST2 signal. This feature allows traders to stay informed even when they are not actively monitoring the charts, enabling them to capitalize on timely trade setups.
Multi-Timeframe Analysis:
TrendMaster Pro supports multi-timeframe analysis, enabling traders to incorporate higher timeframes for additional confirmation. By aligning the signals across multiple timeframes, traders can enhance the accuracy and reliability of their trades. This feature is particularly useful for swing traders and position traders who rely on higher timeframe analysis to capture significant trends.
Conclusion:
TrendMaster Pro is a comprehensive trend-following indicator that combines the power of Short-Term Trend 2 (ST2) and Short-Term Trend 3 (ST3) to generate reliable entry signals and help traders stay aligned with the prevailing market trend. With its customizable parameters, alert system, and support for multi-timeframe analysis, TrendMaster Pro offers traders a versatile tool to enhance their trend trading strategies. Whether you are a beginner or an experienced trader, TrendMaster Pro can serve as a valuable addition to your trading toolkit, helping you identify profitable trading opportunities in trending markets.

*Zig Zag Price, % Change w/RSI*With immense help from ©SimpleCryptoLife who reimagined this script for me, and to ©mmoiwgg and ©ocaptain who's ideas led to this updated version 5.
This indicator is fairly straight-forward and visually appealing because you get a running zig zag price, price % change with an added bonus - RSI. However you won't find zig zag lines but the script reacts the same by changing the inputs. The higher the value the less data points you'll see on the screen.
The main objective of this indicator is to be able to spot high and low prices easily with the price % change between the same 2 data sets. Additionally and arguably more importantly, with the RSI values associated with the high and low prices, you can spot divergences easily - meaning the price is making a higher high while conversely the RSI value at the next pop (around the same price as previous high) is lower which can mean that momentum has exhausted for the time being and a reversal could be imminent.
This script is meant only as a tool to try to enrich your trading journey and I hope it helps you become a more consistent and profitable trader. If you find it invaluable drop a like and comment. Good luck!

Banded Chikou Breakout — Quantifying Ichimoku MomentumTitle: Banded Chikou Breakout — Quantifying Ichimoku Momentum
Overview:
Banded Chikou Breakout (BCB) is a unique, algorithmic script designed to augment the capabilities of traders seeking substantial breakout opportunities. Constructed on the robust principles of the Ichimoku trading strategy, BCB is designed to quantify and filter the Chikou Span's significant breakouts above or below the price action. This script does not aim to replace the Ichimoku system; instead, it enhances it, providing an optimized tool for momentum trading.
Rationale:
Ichimoku traders often scrutinize the Chikou Span's position relative to price action to identify market trends. However, determining whether the Chikou Span is above or below due to a genuine trend or mere market noise can be challenging in choppy markets. BCB resolves this predicament by offering a unique way to interpret the Chikou Span's movement. It does so by quantifying the Chikou Span's momentum and utilizing Bollinger Bands to determine its significance. By effectively differentiating substantial movements from the insignificant, BCB can help traders better navigate the market and increase their potential for profitable trades.
How it Works:
BCB combines three key elements: a Momentum Script (simulating Chikou Span), a Bollinger Band Script, and a Timeframe Switcher, all working together to provide a refined trading perspective.
Momentum Script: Calculates the price difference between the current price and the price 'n' periods ago, transforming the Chikou Span into a quantifiable momentum value that signifies the strength and speed of a market move.
Bollinger Band Script: Computes a Simple Moving Average (SMA) around the momentum, plotting two 'bands' at a specified standard deviation from this SMA. This functionality allows traders to discern when the Chikou Span's momentum is abnormally high or low, signifying a potential significant breakout.
Timeframe Switcher: This feature lets traders apply the BCB script to a different timeframe from the one they are currently viewing. This capability can help traders identify higher timeframe breakouts and trade them with precision on the lower timeframe.
How to Use:
BCB is designed to complement the Ichimoku strategy for effective breakout identification.
Add the BCB script to your trading chart. It plots the momentum (yellow line) and Bollinger Bands (green lines) with the area between the bands shaded blue.
Utilize the Ichimoku strategy to identify larger and smaller timeframe trends.
Optional: Leverage the timeframe switcher to synchronize your trades with higher timeframe trends while operating on lower timeframes.
If the BCB momentum line crosses the upper Bollinger Band while the Ichimoku indicates a bullish trend, it signifies a potential significant upward breakout. Similarly, a cross below the lower band during a bearish trend could denote a significant downward breakout.
Remember, without the context provided by the Ichimoku system's trend analysis, BCB can yield false breakouts. It is, therefore, crucial to use these tools in tandem. I like to check for an Ichimoku trend on the 4H and 1H charts, and then use BCB on charts <60 minutes to capture trends with precision.

TrendingNowTrendingNow Indicator - An Experimental Study
Introduction:
The TrendingNow indicator is an experimental study designed to identify trending market conditions and potential trading opportunities. It combines various technical analysis tools and parameters to provide insights into trend direction, momentum, volume, and price reversals.
Methodology:
The TrendingNow indicator is calculated based on the following parameters and calculations:
Moving Average: A simple moving average (SMA) is calculated using the specified length parameter. It helps smooth out price fluctuations and identify the overall trend direction.
Upper and Lower Bands: The upper and lower bands are derived from the moving average by adding and subtracting a deviation calculated using the multiplier parameter. These bands provide dynamic levels for potential trend reversals.
Price Reversals: The indicator detects price reversals by identifying when the price crosses above or below the upper or lower bands. These reversals suggest potential entry or exit points in the market.
Trend Confirmation: The indicator uses a moving average of the closing prices over the confirmation length parameter to confirm the overall trend direction. It helps filter out false signals and validates the presence of a trend.
Momentum Oscillator: The indicator calculates the relative strength index (RSI) over the momentum length parameter. The RSI measures the speed and change of price movements, indicating potential overbought and oversold conditions.
Volume Trend Confirmation: The study compares the current volume with the average volume over the specified length. If the current volume is above the volume threshold, it suggests increasing volume activity and potential confirmation of the trend.
Volatility Filter: The indicator incorporates an average true range (ATR) calculation to assess market volatility. The volatility threshold is derived by multiplying the ATR by the volatility multiplier parameter. It helps filter out signals during periods of low volatility.
Experimental Study:
The TrendingNow indicator aims to experiment with the combination of these technical analysis tools to identify trending market conditions and potential trading opportunities. By monitoring the price reversals, trend confirmation, momentum, volume trends, and volatility, traders can potentially identify high-probability trade setups.
The study involves observing the indicator's signals and assessing their effectiveness in different market conditions. Traders can experiment with different parameter values, timeframes, and asset classes to optimize the indicator's performance.
Usage and Interpretation:
When using the TrendingNow indicator, traders can consider the following guidelines:
Trend Identification: A bullish trend is indicated when the price is above the upper band, the moving average is rising, and the trend confirmation is positive. A bearish trend is indicated when the price is below the lower band, the moving average is declining, and the trend confirmation is negative.
Price Reversals: Price crossing above the upper band may suggest a potential selling opportunity, while price crossing below the lower band may indicate a potential buying opportunity. These reversals should be confirmed by other indicators and market conditions.
Momentum and Volume Confirmation: Traders can pay attention to the RSI levels to assess overbought and oversold conditions. High volume activity in line with the trend can provide additional confirmation.
Volatility Consideration: Traders may choose to adjust the volatility multiplier parameter based on the current market conditions. Higher values may be more suitable during periods of higher volatility, while lower values may be preferred during low volatility.
Conclusion:
The TrendingNow indicator offers an experimental approach to identifying trending market conditions and potential trading opportunities. Traders can customize the indicator parameters and combine it with other analysis techniques to suit their trading strategies. It is important to conduct thorough testing and validation before incorporating the indicator into live trading.
Disclaimer:
The information provided in this document, including the TrendingNow indicator and the accompanying experimental study, is for educational and experimental purposes only. It should not be considered as financial advice or a recommendation to engage in any trading or investment activities. Trading and investing in financial markets carry inherent risks, and past performance is not indicative of future results.
Before making any trading decisions, it is essential to conduct your own research, evaluate your risk tolerance, and consider your financial situation. The TrendingNow indicator is based on historical price data and technical analysis tools. However, it is important to understand that market conditions can change rapidly, and the indicator may not accurately predict future market movements or generate profitable trades in all situations.
The experimental study aims to explore the effectiveness of the TrendingNow indicator under different market conditions. However, the results obtained from the study are specific to historical data and may not necessarily be indicative of real-time market performance. It is recommended to exercise caution and use the indicator in conjunction with other analysis techniques and risk management strategies.
The TrendingNow indicator's parameters, such as length, multiplier, confirmation length, momentum length, overbought level, oversold level, volume threshold, and volatility multiplier, are adjustable inputs. Traders should carefully consider and test different parameter settings to suit their trading style and market conditions. Furthermore, it is important to regularly review and update the indicator's parameters as market dynamics change.
Trading in financial markets involves the potential for financial loss, and individuals should only trade with funds they can afford to lose. It is strongly advised to seek the guidance of a qualified financial professional or advisor before making any investment decisions.
By using the TrendingNow indicator and conducting the experimental study, you acknowledge that you are solely responsible for any trading decisions you make, and you agree to hold harmless the authors, developers, and distributors of this indicator for any losses, damages, or liabilities incurred as a result of your trading activities.

Volume Profile Bar-Magnified Order Blocks [MyTradingCoder]Introducing "Volume Profile Bar-Magnified Order Blocks", an innovative and unique trading indicator designed to provide traders with a comprehensive understanding of market dynamics. This tool takes the concept of identifying order blocks on your chart and elevates it by integrating a detailed volume profile within each order block zone.
Unlike standard order block indicators, Volume Profile Bar-Magnified Order Blocks pulls data from lower timeframe bars and assigns it to various segments of the order block. By providing this volume profile inside the order block, the indicator supplies a deeper, multi-dimensional view of market activity that can enhance your trading decisions.
Crucially, users have the ability to fine-tune the detection of order blocks. This is made possible through a single input setting called "Tuning". This integer value allows you to control the significance and frequency of the order blocks. Higher numbers will produce more significant order blocks, though they will appear less frequently. Lower numbers, on the other hand, will yield less significant order blocks, but they will occur more often. This enables you to adjust the sensitivity of the indicator according to your specific trading strategy and style.
Key Settings:
Number of Segments: Customize the level of detail in your volume profile by selecting the number of segments you want inside each order block.
Tuning: Adjust the sensitivity of order block detection to align with your trading strategy. Higher values produce more significant but less frequent order blocks, while lower values yield less significant but more frequent order blocks.
Color Inputs: Personalize the look of your chart by selecting the colors for various elements of the indicator. This ensures a seamless integration with your current chart aesthetics and improves visual clarity.
Here is a s creenshot that beautifully demonstrates the power of this indicator. You'll see how the price rejects perfectly off the highest volume segment in an order block, showcasing the indicator's potential for pinpointing high-impact price levels.
While Volume Profile Bar-Magnified Order Blocks offers many unique features, it should be used in conjunction with other indicators and forms of analysis for a complete trading strategy. As with all tools, it does not guarantee profitable trades but is intended to give traders more information to base their decisions on. Use it to complement your existing analysis and enhance your understanding of market behavior.
Experience a new level of clarity in your trading with Volume Profile Bar-Magnified Order Blocks - an indicator that goes beyond the surface to help you navigate the markets more effectively.

nNouSignnNouSign
☆
Welcome to a path to trading success in the world of trading, where fortunes are made and dreams come true.
But amidst the excitement and possibilities, there lies the challenge of deciphering the market's complexities.
Fear not, for we present to you the ultimate weapon in your trading arsenal: the nNouSign indicator.
Prepare to embark on a thrilling journey of trading mastery as we guide you through its optimal usage, enlightening you with its potential and empowering you with the ability to navigate the markets with confidence.
Embracing the nNouSign magic as you apply the nNouSign indicator to your TradingView chart, envision a realm where the convergence of art and science births incredible trading opportunities.
• The indicator's smooth moving average line, represented by a vibrant orange hue, acts as your guiding light. It captures the essence of market sentiment and unveils the hidden patterns that govern price movements.
Decoding the colors of success, possess a mystical power to evoke emotions and ignite motivation . The nNouSign indicator harnesses this power, allowing you to personalize your trading experience.
• Choose the color of prosperity for your buy signals, perhaps a vivid shade of green. Let it symbolize the life-giving force of profits flowing into your trading account.
• As for sell signals, embrace the passionate intensity of red, signifying your ability to seize opportunities and protect your gains.
Riding the trend waves is one of the nNouSign indicator's core strengths. It lies in its ability to identify trends.
Whether the market surges upwards like a fearless tide or recedes like a wise old ocean, the indicator whispers the secrets of trend direction.
• When the moving average is conquered by the closing price, rejoice, for it signals a bullish trend.
• Conversely, when the closing price descends beneath the moving average, it reveals a bearish trend.
Harmonizing with the trading signals which are the magical spells that teleport you to the forefront of profitable trades.
Watch as the nNouSign indicator casts its spells in the form of tiny triangles on your chart.
• When a bullish trend is confirmed, a mystical triangle points upwards, signaling a buy opportunity.
• On the contrary, when a bearish trend emerges, a bewitching triangle points downwards, beckoning you to sell.
Embrace these signals and let them guide your path to success.
Unleashing the power of alerts like the modern trader(s) whom thrives on speed and efficiency.
The nNouSign indicator empowers you with its alert system , ensuring you never miss a precious trading moment.
• Customize your alerts to receive notifications when the bullish or bearish trends are confirmed.
Imagine the thrill of being the first to seize an opportunity, swiftly executing trades with confidence, and reaping the rewards.
Dance with the trendline as you journey through the market's ebb and flow, through the nNouSign indicator its visual masterpiece.
Behold the trendline , gracefully drawn on your chart.
• In the presence of a bullish trend, it steps aside, allowing the moving average to shine brightly.
• Yet, in the depths of a bearish trend, it emerges, painted in shades of red, serving as a reminder to exercise caution.
Let this visual spectacle guide your decision-making process.
☆
Intrepid trader! ,may you now have unlocked the secrets of the nNouSign indicator and embark on a journey that will forever transform your trading experience.
Armed with its wisdom and most importantly YOUR OWN WISDOM, may you possess the ability to navigate the markets with confidence and precision.
Embrace its vibrant colors, heed its trading signals and dance with the trendline as you ride the waves of market trends. Let the indicator be your constant companion, guiding you through the ever-changing tides of the financial world.
Remember, trading is not just a science; it is an art. The nNouSign indicator provides you with the tools to create your masterpiece.
Embrace its colors, for they evoke the emotions and motivation necessary for success.
Let the green of buy signals ignite your passion for profit, and the red of sell signals fuel your determination to protect your gains.
But trading is more than just following signals; it requires discipline and adaptability.
Observe the trendlines and understand the market's rhythm.
Be patient when the trend favors the bulls, and exercise cautio n when the bears take control.
The nNouSign indicator, with its magical trendline, will be your compass in navigating these changing conditions.
In the fast-paced world of trading, timing is everything. The alerts generated by the nNouSign indicator will keep you informed, ensuring you never miss an opportunity.
Stay alert, for swift and decisive action can be the key to reaping substantial rewards.
☆
Finally, remember that trading is a journey of growth and learning.
Embrace the educational aspect of using the
nNouSign indicator.
Analyze your trades, study the outcomes, and fine-tune your strategies.
With each trade , you'll gain valuable insights and develop the skills necessary for long-term success .
☆
So, fellow trader, take this guide as your roadmap to trading mastery.
Let the nNouSign indicator be your guide, entertaining you with its vibrant colors, motivating you with its signals, and educating you through each trading experience.
Embrace the power it bestows upon you, and let it unleash your full potential in the exciting world of trading.
Success awaits those who dare to seize it!
-HappyTrading- J

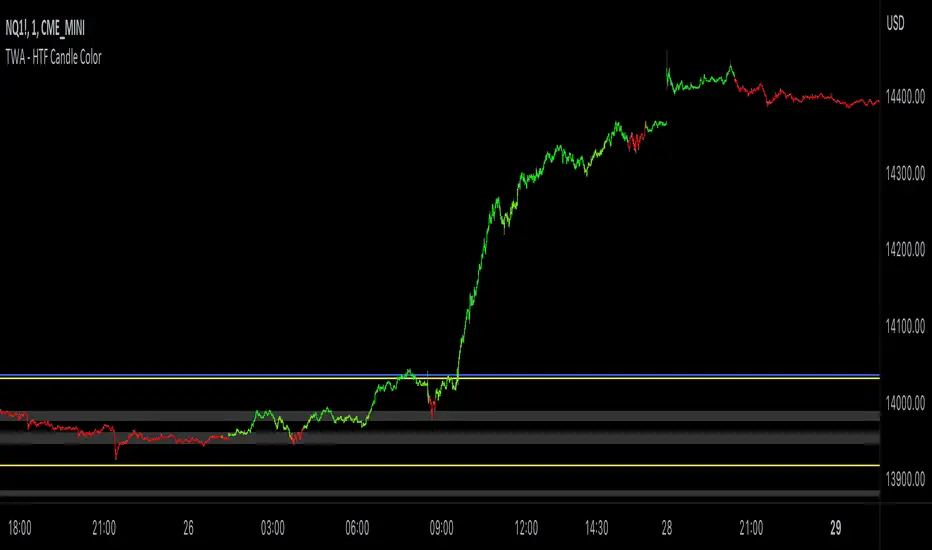
TWA - HTF Candle ColorOverview:
This indicator is designed to assist trend traders by confirming the market's direction on a higher timeframe and providing overlays to determine the strength and longevity of the current trend. Its goal is to help traders develop a probability-based mindset, enabling them to remain in profitable trades for longer periods and to identify when the trend might be shifting.
Main features and how to use:
The main feature of the indicator is the green and red coloring of the candles. The candles can be used to determine market direction and use that bias to pick a trading direction. The contrarian candle overlay is another useful feature that helps trend traders identify potential trend reversals. To use this feature, traders should wait until the overlay candle coloring "clicks off" to determine the probability that the current move has reached its peak or bottom and to look for a larger retracement. The unique flexibility of this feature allows trend traders to see both sides of the story.
Calculations and what makes this original:
- It finds breaks of common fibonacci retracement and extension values on a higher time frame using my proprietary williams % R indicator to find
trend direction
- To help add more confirmation to trend direction the proprietary algorithm combines the above fibonacci breaks with confirmation from price
breaking beyond multiple deviations measured from bollinger bands.
- From your current charts timeframe it automatically calculates which higher timeframe to analyze.
- The above algorithm from the higher timeframe is distilled down to a green or red candle color on the chart to show market direction.
- It uses a blend of rsi and CCI to calculate contrarian candle coloring to show trend exhaustion.
Additional features
Contrarian candle coloring:
The contrarian candle coloring feature is designed to help trend traders see possible reversals. It overlays a different candle color on top of the HTF candles at certain periods. The unique feature of this addition is its ability to transform a trend-following indicator into a tops and bottom reversion indicator all in one. This flexibility allows traders to see both the contrarian and trend-following perspectives.
Enhanced probability:
This feature helps traders determine the probability of their potential trades long-running potential by changing the background color to green or red. Traders can use this information to help define their risk per trade. For example, if the candle coloring matches the background color, they might choose a long-running move, whereas if the candle coloring does not match the background color, they might opt for a scalping trade. The unique feature of this addition is how it gives traders the ability to view the market from different perspectives all on one screen.
Use Alternate Symbol:
Allows for the candle color to be derived from a separate symbol than the current chart .
Candle Color as Line:
Plots a line across the top or bottom of the chart showing the current color which allows users the ability to use an additional indicator that colors candles.
Contrarian Color as Line:
Plots a line across the top or bottom of the chart showing the current candle color which allows users the ability to use an additional indicator that colors candles.
Candle Color as Background:
Colors the chart background the color of the current HTF candle color which allows users the ability to use an additional indicator that colors candles.
Increase Market Sensitivity:
Quickens the response time for candles to change color which can be helpful for scalping on 1 minute charts.
ALERTS
- Get an alert when the candle color changes to green or red
-Get an alert when the enhanced probability color changes to green or red
-Get an alert when the candle color and enhanced probability color align green or red
Multi-Divergence Buy/Sell IndicatorThe "Multi-Divergence Buy/Sell Indicator" is a technical analysis tool that combines multiple divergence signals from different indicators to identify potential buy and sell opportunities in the market. Here's a breakdown of how the indicator works and how to use it:
Input Parameters:
RSI Length: Specifies the length of the RSI (Relative Strength Index) calculation.
MACD Short Length: Specifies the short-term length for the MACD (Moving Average Convergence Divergence) calculation.
MACD Long Length: Specifies the long-term length for the MACD calculation.
MACD Signal Smoothing: Specifies the smoothing length for the MACD signal line calculation.
Stochastic Length: Specifies the length of the Stochastic oscillator calculation.
Stochastic Overbought Level: Defines the overbought level for the Stochastic oscillator.
Stochastic Oversold Level: Defines the oversold level for the Stochastic oscillator.
Calculation of Indicators:
RSI: Calculates the RSI based on the specified RSI Length.
MACD: Calculates the MACD line, signal line, and histogram based on the specified MACD parameters.
Stochastic: Calculates the Stochastic oscillator based on the specified Stochastic parameters.
Divergence Detection:
RSI Divergence: Identifies a bullish divergence when the RSI crosses above its 14-period simple moving average (SMA).
MACD Divergence: Identifies a bullish divergence when the MACD line crosses above the signal line.
Stochastic Divergence: Identifies a bullish divergence when the Stochastic crosses above its 14-period SMA.
Buy and Sell Conditions:
Buy Condition: Triggers a buy signal when all three divergences (RSI, MACD, and Stochastic) occur simultaneously.
Sell Condition: Triggers a sell signal when both RSI and MACD divergences occur, but Stochastic divergence does not occur.
Plotting Buy/Sell Signals:
The indicator plots green "Buy" labels below the price bars when the buy condition is met.
It plots red "Sell" labels above the price bars when the sell condition is met.
Usage:
The indicator can be used on any timeframe and for any trading instrument.
Look for areas where all three divergences (RSI, MACD, and Stochastic) align to generate stronger buy and sell signals.
Consider additional technical analysis and risk management strategies to validate the signals and manage your trades effectively.
Remember, no indicator guarantees profitable trades, so it's essential to use this indicator in conjunction with other tools and perform thorough analysis before making trading decisions.
Feel free to ask any questions

Inside Day ProbabilityThe "Inside Day Probability" indicator is a tool developed for market analysis on the TradingView platform. Its main objective is to calculate the probability of success of a pattern known as "Inside Day" (Día Interior in Spanish).
An Inside Day occurs when the price range (difference between the high and low) of a candle is completely contained within the price range of the previous candle. This pattern indicates a consolidation in the market and is usually followed by a sharp move in a certain direction.
The indicator uses a combination of statistical and mathematical analysis to determine the probability that an Inside Day will result in a successful market move. It is based on historical data and past patterns to calculate the probability of a significant price rise or sharp decline following an Inside Day.
The indicator provides a graphical display of the probability of success, usually in the form of a percentage value or a color scale. This allows traders to easily identify potentially profitable trading opportunities based on the occurrence of Inside Days.
It is important to note that this indicator is a decision support tool and does not guarantee accurate results in all cases. It is recommended to use it in conjunction with other technical analysis tools and consider other relevant factors before making operations in the financial market.
Remember that the proper interpretation and use of this indicator requires an understanding and knowledge of technical analysis and trading principles.

Volume-Weighted RSI with Adaptive SmoothingThis indicator is designed to provide traders with insights into the relative strength of a security by incorporating volume-weighted elements, effectively combining the concepts of Relative Strength Index (RSI) and volume-weighted averages to generate meaningful trading signals.
The indicator calculates the traditional RSI, which measures the speed and change of price movements, as well as the volume-weighted RSI, which considers the influence of trading volume on price action. It then applies adaptive smoothing to the volume-weighted RSI, allowing for customization of the smoothing process. The resulting smoothed volume-weighted RSI is plotted alongside the original RSI, providing traders with a comprehensive view of the price strength dynamics.
The line coloration in this indicator is designed to provide visual cues about the relationship between the RSI and the volume-weighted RSI. When the RSI line is above or equal to the volume-weighted RSI line, it suggests a potentially bullish condition with positive market momentum. In such cases, the line is colored lime. Conversely, when the RSI line (fuchsia) is below the volume-weighted RSI line, it indicates a potentially bearish condition with negative market momentum. The line color is set to fuchsia. By observing the line color, traders can quickly assess the relative strength between the RSI and the volume-weighted RSI, aiding their decision-making process.
The bar color and background color further enhance the visual interpretation of the indicator. The bar color reflects the RSI's relationship with the volume-weighted RSI and the predefined thresholds. If the RSI line is above both the volume-weighted RSI line and the overbought threshold (70), the bar color is set to lime, indicating a potentially overbought condition. Conversely, if the RSI line is below both the volume-weighted RSI line and the oversold threshold (30), the bar color is set to fuchsia, suggesting a potentially oversold condition. When the RSI line is between these two thresholds, the bar color is set to yellow, indicating a neutral or intermediate state. The background color, displayed with a semi-transparent shade, provides additional context by reflecting the prevailing market conditions. It turns lime if the volume-weighted RSI is above the overbought threshold, fuchsia if below the oversold threshold, and yellow if it falls between these two thresholds. This coloration scheme aids traders in quickly assessing market conditions and potential trading opportunities.
Calculations:
-- RSI Calculation : The traditional RSI is calculated based on the price movements of the asset. The up and down movements are determined, and exponential moving averages are used to smooth the values. The RSI value ranges from 0 to 100, with levels above 70 indicating overbought conditions and levels below 30 indicating oversold conditions.
-- Volume-Weighted RSI Calculation : The volume-weighted RSI incorporates the trading volume of the asset into the calculations. The closing price is multiplied by the corresponding volume, and the average is taken over a specific length. The up and down movements are smoothed using exponential moving averages to generate the volume-weighted RSI value.
-- Adaptive Smoothing : The indicator offers an adaptive smoothing option, allowing traders to customize the smoothing process of the volume-weighted RSI. By adjusting the smoothing length, traders can fine-tune the responsiveness of the indicator to changes in market conditions. Smoothing helps reduce noise and enhances the clarity of the signals.
Interpretation:
The indicator provides two main components for interpretation:
-- RSI : The traditional RSI reflects the price momentum and potential overbought or oversold conditions. Traders can look for RSI values above 70 as potential overbought signals, suggesting a possible price reversal or correction. Conversely, RSI values below 30 indicate potential oversold signals, indicating a potential price rebound or rally.
-- Volume-Weighted RSI : The volume-weighted RSI incorporates trading volume, which provides insights into the strength of price movements. When the volume-weighted RSI is above the traditional RSI, it suggests that the buying pressure supported by higher volume is stronger, potentially indicating a more reliable trend. Conversely, when the volume-weighted RSI is below the traditional RSI, it suggests that the selling pressure supported by higher volume is stronger, potentially indicating a more significant price reversal.
Potential Strategies:
-- Overbought and Oversold Signals : Traders can utilize the RSI component of the indicator to identify overbought and oversold conditions. A potential strategy is to consider taking short positions when the RSI is above 70 and long positions when the RSI is below 30. These levels can act as dynamic support and resistance areas, indicating possible price reversals.
-- Confirmation with Volume : Traders can use the volume-weighted RSI as a confirmation tool to validate price movements. When the volume-weighted RSI is above the traditional RSI, it may provide additional confirmation for long positions, suggesting stronger buying pressure. Conversely, when the volume-weighted RSI is below the traditional RSI, it may provide confirmation for short positions, indicating stronger selling pressure.
-- Trend Reversal Strategy : Watch for the volume-weighted RSI to reach extreme levels above 70 (overbought) or below 30 (oversold). Look for a reversal signal where the RSI line (green or fuchsia) crosses below or above the volume-weighted RSI line. Enter a trade when the reversal signal occurs, and the RSI line changes color. Exit the trade when the RSI line crosses back in the opposite direction or reaches the opposite extreme level.
-- Divergence Strategy : Compare the direction of the RSI line (green or fuchsia) with the volume-weighted RSI line. A bullish divergence occurs when the RSI line makes higher lows while the volume-weighted RSI line makes lower lows. A bearish divergence occurs when the RSI line makes lower highs while the volume-weighted RSI line makes higher highs. Once a divergence is identified, wait for the RSI line to cross above or below the volume-weighted RSI line as confirmation of a potential trend reversal. Consider using additional indicators or price action analysis to time the entry more accurately. Use stop-loss orders and profit targets to manage risk and secure profits.
-- Trend Continuation Strategy : Assess the overall trend direction by observing the RSI line's position relative to the volume-weighted RSI line. When the RSI line consistently stays above the volume-weighted RSI line, it indicates a bullish trend, while the opposite suggests a bearish trend. Look for temporary pullbacks within the ongoing trend where the RSI line (green or fuchsia) touches or crosses the volume-weighted RSI line. Enter trades in the direction of the dominant trend when the RSI line crosses back in the trend direction. Exit the trade when the RSI line starts to deviate significantly from the volume-weighted RSI line or when the trend shows signs of weakening through other technical or fundamental factors.
Limitations:
-- False Signals : Like any indicator, the "Volume-Weighted RSI with Adaptive Smoothing" may produce false signals, especially during periods of low liquidity or choppy market conditions. Traders should exercise caution and consider using additional confirmation indicators or tools to validate the signals generated by this indicator.
-- Lagging Nature : The indicator relies on historical price data and volume to calculate the RSI and volume-weighted RSI. As a result, the signals provided may have a certain degree of lag compared to real-time price action. Traders should be aware of this inherent lag and consider combining the indicator with other timely indicators to enhance the accuracy of their trading decisions.
-- Parameter Sensitivity : The indicator's effectiveness can be influenced by the choice of parameters, such as the length of the RSI, smoothing length, and adaptive smoothing option. Different market conditions may require adjustments to these parameters to optimize performance. Traders are encouraged to conduct thorough testing and analysis to determine the most suitable parameter values for their specific trading strategies and preferences.
-- Market Conditions : The indicator's performance may vary depending on the prevailing market conditions. It is essential to understand that no indicator can guarantee accurate predictions or consistently profitable trades. Traders should consider the broader market context, fundamental factors, and other technical indicators to complement the insights provided by the "Volume-Weighted RSI with Adaptive Smoothing" indicator.
-- Subjectivity : Interpretation of the indicator's signals involves subjective judgment. Traders may have varying interpretations of overbought and oversold levels, as well as the significance of the volume-weighted RSI in relation to the traditional RSI. It is crucial to combine the indicator with personal analysis and trading experience to make informed trading decisions.
Remember, no single indicator can provide foolproof trading signals. The "Volume-Weighted RSI with Adaptive Smoothing" indicator serves as a valuable tool for analyzing price strength and volume dynamics. It can assist traders in identifying potential entry and exit points, validating trends, and managing risk. However, it should be used as part of a comprehensive trading strategy that considers multiple factors and indicators to increase the likelihood of successful trades.

TTP Breaking PointThis signal uses information from BITFINEX:BTCUSDLONGS and BITFINEX:BTCUSDSHORTS to forecast tops and bottoms.
The idea behind is very simple.
We calculate the RSI of the ratio of longs vs shorts and find areas where both the SMA of this RSI and the RSI itself are overextended.
You might notice that the win rate is not high but most of the wins provide a decent move that, if combined with proper risk management, can be used to build profitable strategies.
The signal offers a backtesting stream: 1 for buy and 2 for sell.
Shortly I'll be adding new features including: alerts, support for other symbols, filters, etc.
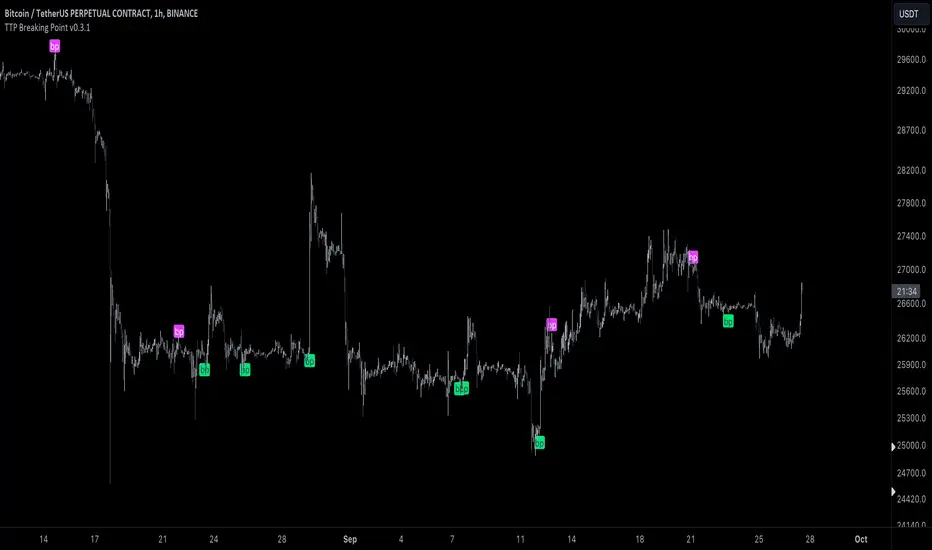
Step RSI [Loxx]Enhanced Moving Average Calculation with Stepped Moving Average and the Advantages over Regular RSI
Technical analysis plays a crucial role in understanding and predicting market trends. One popular indicator used by traders and analysts is the Relative Strength Index (RSI). However, an enhanced approach called Stepped Moving Average, in combination with the Slow RSI function, offers several advantages over regular RSI calculations.
Stepped Moving Average and Moving Averages:
The Stepped Moving Average function serves as a crucial component in the calculation of moving averages. Moving averages smooth out price data over a specific period to identify trends and potential trading signals. By employing the Stepped Moving Average function, traders can enhance the accuracy of moving averages and make more informed decisions.
Stepped Moving Average takes two parameters: the current RSI value and a size parameter. It computes the next step in the moving average calculation by determining the upper and lower bounds of the moving average range. It accomplishes this by adjusting the values of smax and smin based on the given RSI and size.
Furthermore, Stepped Moving Average introduces the concept of a trend variable. By comparing the previous trend value with the current RSI and the previous upper and lower bounds, it updates the trend accordingly. This feature enables traders to identify potential shifts in market sentiment and make timely adjustments to their trading strategies.
Advantages over Regular RSI:
Enhanced Range Boundaries:
The inclusion of size parameters in Stepped Moving Average allows for more precise determination of the upper and lower bounds of the moving average range. This feature provides traders with a clearer understanding of the potential price levels that can influence market behavior. Consequently, it aids in setting more effective entry and exit points for trades.
Improved Trend Identification:
The trend variable in Stepped Moving Average helps traders identify changes in market trends more accurately. By considering the previous trend value and comparing it to the current RSI and previous bounds, Stepped Moving Average captures trend reversals with greater precision. This capability empowers traders to respond swiftly to market shifts and potentially capture more profitable trading opportunities.
Smoother Moving Averages:
Stepped Moving Average's ability to adjust the moving average range bounds based on trend changes and size parameters results in smoother moving averages. Regular RSI calculations may produce jagged or erratic results due to abrupt market movements. Stepped Moving Average mitigates this issue by dynamically adapting the range boundaries, thereby providing traders with more reliable and consistent moving average signals.
Complementary Functionality with Slow RSI:
Stepped Moving Average and Slow RSI function in harmony to provide a comprehensive trading analysis toolkit. While Stepped Moving Average refines the moving average calculation process, Slow RSI offers a more accurate representation of market strength. The combination of these two functions facilitates a deeper understanding of market dynamics and assists traders in making better-informed decisions.
Extras
-Alerts
-Signals
