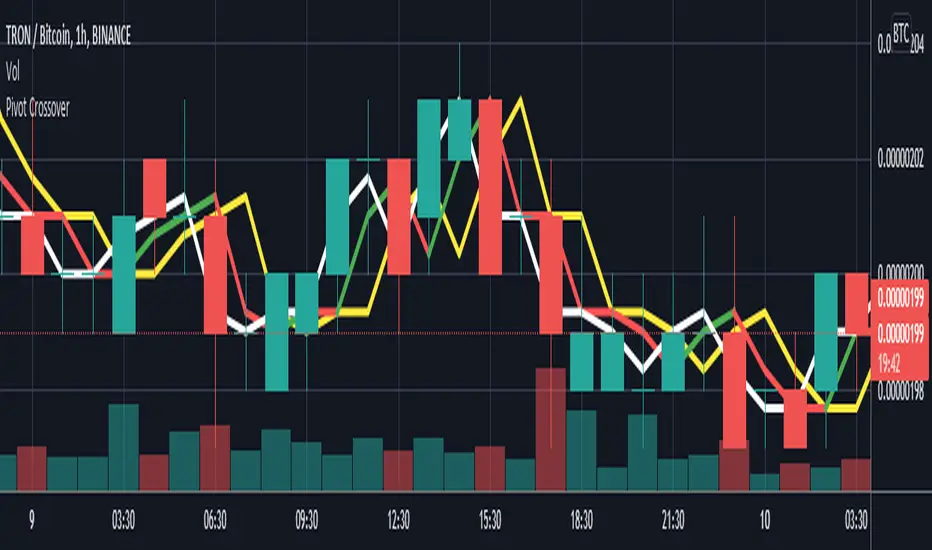
Pivot CrossoverThis indicator work on pivot point crossover. In this indicator use three pivot point
White color line is Pivot point for current bar.
Green/Red color line is Pivot point for last bar.
Yellow color line is Pivot point for 2nd last bar.
For long
if last pivot crossover above 2nd last pivot then go long
if current pivot crossover below last pivot then exit long
For short
if last pivot crossover below 2nd last pivot then go short
if last pivot crossover above last pivot then exit short
In den Scripts nach "pivot" suchen
Pivot Points & Midlines with color selectorAdapted from Pinescript Manual's "Pivot Points Standard". Added extra levels and midlines as well as user inputs for color and a "show labels" on/off switch.
So this will show the Pivot level, the resulting levels R1,R2,R3,S1,S2,S3 and the midpoint lines between these.
User can choose the Higher timeframe period from which to calculate these pivot levels, as per the original script.
I like to add two of these to a chart, one for daily and one for weekly pivot levels.
If you don't need any particular level, just comment out the appropriate lines (one from each of the second last and third last blocks in the script).

Pivot Hilo Support n Resistance Levels R3-3 by JustUncleLThis is an update to the "Pivot HiLo Support n Resistance Levels" indicator, important updates are no re-painting; and different lengths available for each side of Pivot.
Description:
The Pivot Points are marked with "star" and with Optional Support and Resistance extension Levels shown.
Options:
Show Pivot Points (default true)
Pivot Length Left Side (default 7), the number of bars left hand side of the Pivot candle.
Pivot Length Right Side (default 3), the number of bars right hand side of the Pivot candle.
Show S/R Extension Levels (default true)
Maximum S/R Extension Length (default 0, no limit)
Show Pivot Labels (instead of "star") " " and " "
Revisions this release:
Added code to force Pivot to be always complete before drawing.
Added option for different length test for each side of Pivot.
Pivot Bollinger BandThis is a special kind of Bollinger Bands indicator that adapts to the market's pivot points. Instead of using regular price data, it first finds important swing highs and lows in the market (called pivot points). It then uses these pivot points to create a center line, which is like a moving average of where the market is pivoting.
Around this center line, it draws the classic Bollinger Bands - an upper and lower band that show where prices might find resistance or support. The distance between these bands changes based on market volatility, just like regular Bollinger Bands. You can adjust how sensitive it is to pivot points and how wide the bands should be.
By using pivot point based Bollinger Bands, we expect band breakout can be captured more effectively.

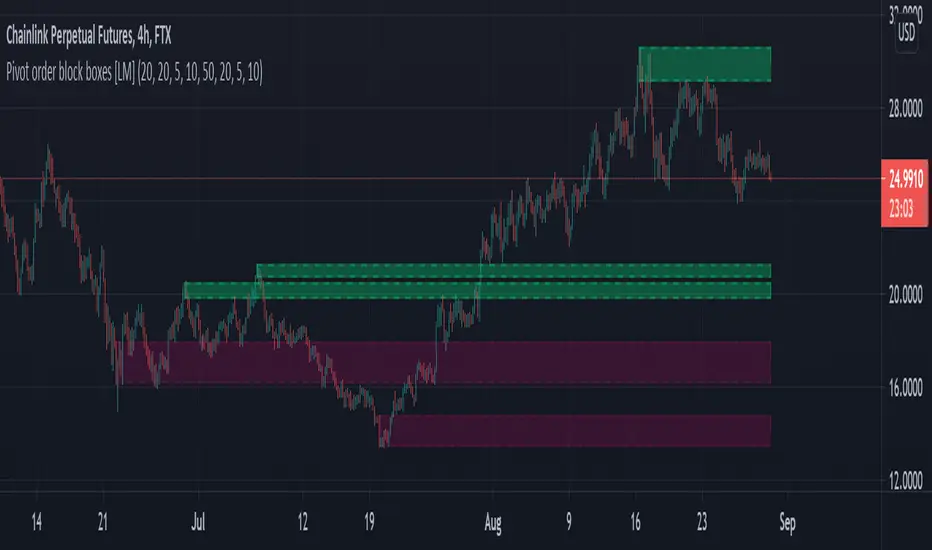
Pivot order block boxes [LM]Hello traders,
let me intoduce you pivot order block boxes. The idea is find the pivot point that within the right side count of candles achieved some percentage change and in that way filter out important pivots. Once the pivot point is found and matches the volatility condition then from the left side of pivot first candle that is up candle for pivot high and down candle for pivot low, could be also the pivot candle itself is selected and rendered high and low of that candle. The premise behind is that those are the levels profesional traders are buying.
It has two settings that you can change at your will, it also enables hide/show particular pivot setting
Hope you will enjoy as I enjoyed to write it.
Lukas
Pivot boxes [LM]Hello traders,
let me intoduce you pivot boxes. New features of pinescript that allows to render boxes enabled to highlight pivot zone. Range high or low is defined by pivot high or low and rangeLow and RangeHigh are defined by close of following candle.
It has two settings that you can change at your will, it also enables hide/show particular pivot setting
Hope you will enjoy as I enjoyed to write it.
Lukas

Pivot Points (with Mid-Pivots)Brief Description
Pivot points are horizontal support and resistance lines placed on a price chart. They make strong levels of support and resistance because banks, financial institutions and many traders use them.
The indicator is set to the Daily Pivot Range by default (no support for weekly, monthly, quarterly, or yearly Pivots).
Indicator Settings
Show Mid-Pivots?
Show R3 and S3 levels?
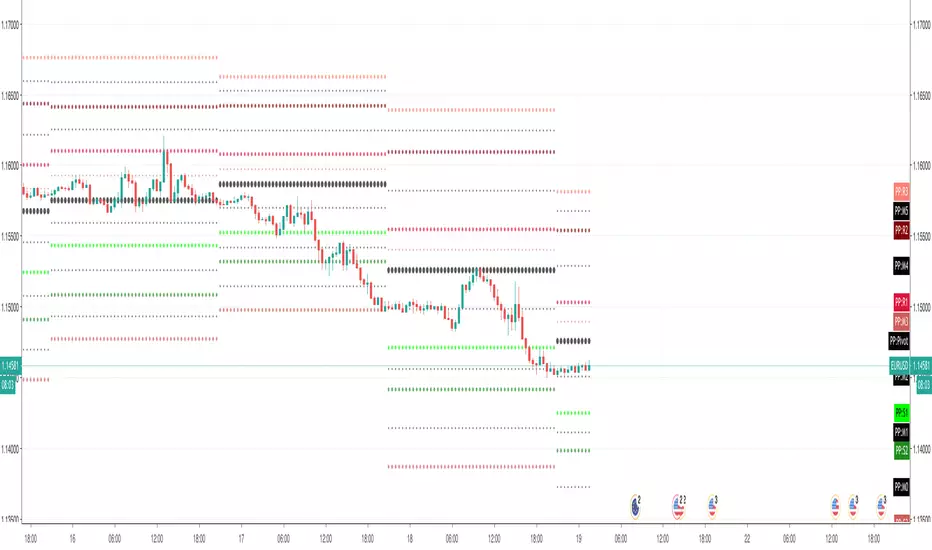
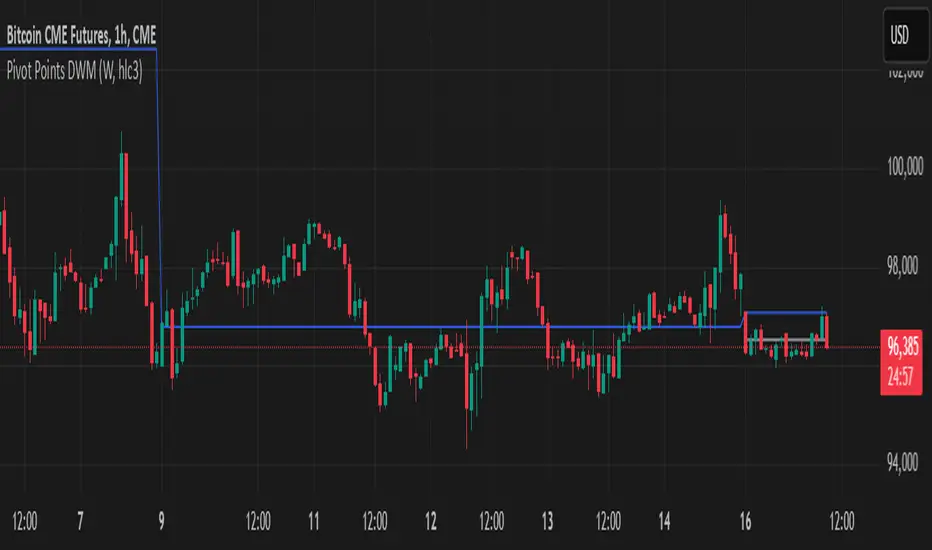
Pivot Points DWMWhat Is a Pivot Point?
A pivot point is a price level calculated from previous prices. It's used to indicate potential areas of support or resistance that offer attractive reward-to-risk setups for trades. The pivot point itself is simply the average of the intraday high and low and the closing price from the previous trading day. Trading above the pivot point on the subsequent day is thought to indicate ongoing bullish sentiment. Trading below the pivot point indicates bearish sentiment.
Non-Repainting
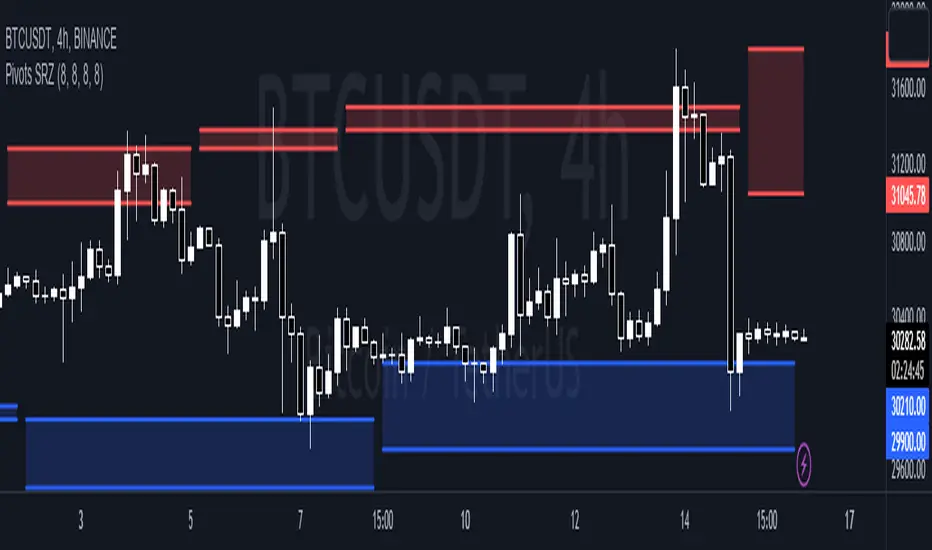
Pivots Support Resistance ZoneThis simple script base on function of Pivot High Low to plot Support and Resistance Zone on chart with detail as below:
1. Support Zone
+ New Pivot Low is plotted
+ New Pivot Low lower previous Pivot Low
+ Upper Line of Support Zone is previous Pivot Low
+ Lower Line of Support Zone is new Pivot Low
2. Resistance Zone
+ New Pivot High is plotted
+ New Pivot High higher previous Pivot High
+ Upper Line of Resistance Zone is new Pivot High
+ Lower Line of Resistance Zone is previous Pivot High
Pivots, Compressions and ExtensionsPivots, Compressions and Extensions
Best used with a monochromatic bar chart, ex. light gray bars that allow signals to stand out.///
Blue = volatility expansion warning, this means volatility has been compressed and is starting a new phase of volatility expansion.
(cont.) Think a ball at the top of a hill with very low positional volatility but high potential energy. Blue bars mark the point
(cont.) where potential energy starts to transition into kinetic energy. This often 'cycles' into a new regime of higher volatility.
Pink & purple bars signify extreme, exponential trend, often the climax of a particular bull or bear cycle. Can help identify tops.
Orange is meant to signal a pocket pivot as described by @RollyTrader among others. This pivot marks the end of consolidation.

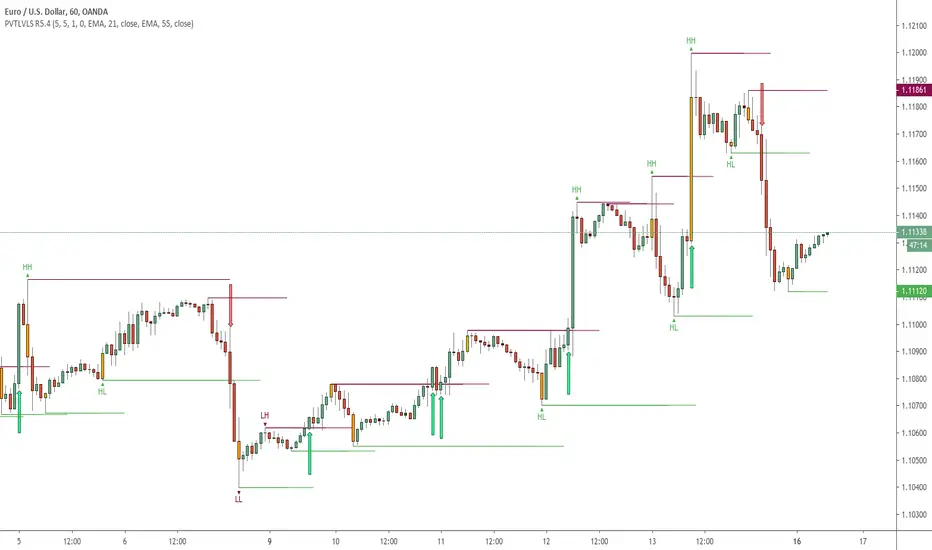
Pivots High Low (HH/HL/LH/LL)/Trend [Anan] Hello Friends,,
This is pivot points high low with pivot trend to define the trend direction.
Pivot trend is the pivot points average.
Options:
- Pivot Point Period
- Show/hide Pivot Points Labels
- Show/hide Bull/Bear Labels ( depends on pivot trend)
- Show/hide Pivot Center Line (Bull>Center, Bear

Pivot Points with Monthly and Weekly optionsA pivot point indicator that has possibility to see even the monthly or the weekly pivot points .
Pivot points are very powerful if used in correct way.
most of the time the price can be rejected from the pivot point or if the price break it it will be a nice entry if retest the pivot
R2/S2 are a very strong pivots to break but of course you need a certain distance between the pivot

Pivot Points Percentage Differences (W/ High & Low Indicators)This script is really handy for day trading. This works best on low time frames like the 1 minute or the 5 minute .
To understand what pivot points are you can add other pivot point indicators or just look at the color differences below since every-time that changes it's a new pivot point (which represents a known low or known high with high certainty)
The script shows the most recent percentage move up or down for the last known pivot point based on the pivot point setting data.
Pivot points are generated after 20 bars go by default, but you can set this to whatever you wish in the settings . Just click the gear icon for the script to set these.
You can also set how many bars back to look for what was the last highest percentage move (down or up). This will be important for your day trading strategy.
The idea to trading with this is pretty simple.
You look at the highest percentage moves that were made on pivots up or down and if you notice a current move that has trended down or up to the highest percentage, that makes that a safer bet for shorting or longing.
Of course, sometimes, things move greater or less than normal, so you would set stop losses accordingly.
Hope this helps with your day trading for finding good entry and exit points!
EXAMPLE TRADE SCENARIO
You notice the last high for the last 100 bars was 3% . The price recently rose 3% from a known pivot low. You can put a short on this. You noticed that the average price down was 2% , so if the price drops 2% or close to it you can exit your short and go LONG . You set a stop loss above what you put by an extra percentage to be safe.
I will do an experimental strategy version of this idea if people are interested.

Pivot alerts by Funded-TraderThis indicator draws Standard Pivot Levels on all products on all timeframes.
The P Pivot is included, and it goes as far as R3 and S3, as pivots 4 and 5 are rarely reached in the market.
This indicator differs from the "Standard Pivot" published by TradingView as this can be used to set-up an Alert: just add a new alert, pick "crossing" and in value pick "Pivot Alerts"
I have chosen a neutral colour Orange for all pivot levels.

Pivots + MAs ISRSPivots + MAs ISRS is a complete market-structure tool designed for traders who want clear institutional levels combined with trend confirmation from moving averages and Fibonacci zones.
This indicator helps you identify breakouts, pullbacks, and reversal points with much higher accuracy.
It combines the best of three worlds:
🔹 1. Advanced Pivot Points (Standard TV Engine)
Includes every major professional pivot type:
Traditional
Fibonacci
Woodie
Classic
DM
Camarilla
You can choose pivot anchors such as:
Daily, Weekly, Monthly, Quarterly, Yearly, and extended periods (2, 3, 5, and 10 years).
✔ Fully customizable colors
✔ Show/hide each level individually
✔ Dynamic labels (left or right)
✔ Works with intraday + extended sessions
🔹 2. Built-in Moving Averages
The indicator includes:
3 EMAs to measure trend direction and momentum
A 5-period SMA for micro-structure and scalping precision
Great for identifying confluences between trend direction + pivot levels.
🔹 3. FiboISRS Zones
Fibonacci-based zones designed to enhance price-reaction detection:
Retracement levels
Liquidity zones
Confluences with EMAs + Pivot Points
Perfect for spotting high-probability reversal areas.
🎯 What This Indicator Helps You Do
✔ See active institutional levels on any timeframe
✔ Detect real breakouts (not fakeouts) using Pivots + MAs
✔ Identify clean pullbacks into key zones
✔ Spot reactions at S1/S2/S3 or R1/R2/R3
✔ Keep your chart clean with minimal noise
Works extremely well on:
Crypto with solid liquidity
Major indices (SPX, NASDAQ, Dow)
Forex
Gold and commodities
🧠 Pro Tip
The highest-probability setups occur when price touches:
👉 A Pivot Level
👉 An EMA (20, 50, or 200)
👉 A FiboISRS zone
When these three overlap, the market often reacts strongly.
⚡ Creator
Indicator created by Ismael Robles (ISRS) to bring a clean, institutional-grade structure to everyday traders.

Pivot Levels with EMA Trend📌 Trend Change Levels with EMA Trend
✨ Description:
This TradingView script identifies clean trend change levels based on 1-hour structure shifts and filters them to keep only those not invalidated. It follows the "Jake Ricci" method, each level is printed at the beginning of the candle that changes the trend, on a 1 hour chart. For precision, make sure to exclude after/pre market and only use the levels on regular hours charts.
It includes dynamic EMAs (9, 50, 200), intraday VWAP, the daily open level printed, and a visual trend label based on EMA(9) slope.
Designed for intermediate traders, it helps build bias, manage entries, and avoid false setups by focusing on clean, reactive levels that the market respects.
🔧 Core Logic:
On the 1H chart, the script compares current and previous closes to detect trend direction. If the trend flips (e.g., up to down), the open of the candle that caused the flip becomes a candidate level.
Only levels that remain untouched by future candle closes are plotted — this filters out “weak” levels that price already violated (which means, a candle closes after passing through the level).
These levels become key S/R zones and often act as reaction points during pullbacks, traps, and liquidity sweeps.
The idea is to check how the price reacts to those levels. Usually there's a clean retest of the level. After that, if the price continues in that direction, it tends to reach the following level.
🔹 Included Tools:
🟣 Trend Change Levels (1H):
Fixed horizontal lines based on confirmed shifts in trend, shown only when not broken.
📉 EMAs (9 / 50 / 200):
Visibility can be set per timeframe. Use for trend context.
📍 EMA Trend Label:
Shows \"UP\", \"DOWN\", or \"RANGE\" based on EMA(9) slope.
🔵 VWAP (Intraday Reset):
Real-time volume-weighted average price that resets daily. Useful for fair value zones and reversion plays.
🟠 Daily Open Line:
Plot of the current day’s open. Used for intraday directional bias. Usually: DO NOT take longs below the Open Print, DO NOT take shorts above it.
📊 ATR Table:
Displays current ATR multiplier on the chart. It's useful to understand if the market is expanding or not.
📈 How to Use It (Strategy):
1. Start on the 1H chart to generate levels.
Only the open of candles that reversed trend are considered — and only if future candles didn’t close through them. I suggest manually adding horizontal lines to mark again the levels, so that they stick to all the timeframes.
2. Use the trend label to decide your bias — \"UP\" for long setups, \"DOWN\" for shorts. Avoid trading against the slope.
3. Switch to the 5m chart and wait for price to approach a plotted level. These are often used for manipulation, retests, or clean reversals.
4. Look for confirmation: rejection candles, break-and-retest, strong engulfing candles, or traps above/below the level. ALWAYS check the price action around the level, along with the volume.
5. Check if VWAP or an EMA is near the level. If yes, the confluence strengthens the trade idea.
6. Use the ATR value to understand if the market is expanding (candles are bigger than the ATR). You don't want to stay in a slow and ranging trade.
✅ Example Entry Flow:
1. On the 1H chart, note a trend change level printed recently.
2. Check the current trend label — if it says \"UP,\" prefer longs.
3. Wait for price to retrace toward the level.
4. On the 5m, look for a bullish engulfing candle or trap setup at the level.
5. Check if VWAP and EMA(50) are near. If yes, execute the trade.
6. Set stop just under the low of the candle prior to your entry. Ideally, a retracing candle.
To be clear: imaging to be LONG, you wait for a retracement that should touch your level. You wait for a candle that resumes the LONG trend, enter when it breaks the high of the previous candle (sill in retracement), you place your stop under the candle prior to your entry.
Notes:
No repainting — levels only show up after confirmed shifts.
Removes broken levels for chart clarity and reliability.
Helps spot high-probability pullback zones and fakeouts.
Perfect confluence tool to support price action, SMC, or EMA strategies.
Works across multiple timeframes with customizable inputs.
👤 Ideal For:
Intraday traders looking for reactive entry points and direction confirmation.
Swing traders wanting to pinpoint continuation zones or reversal pivots.
🚨 Final Note: This indicator doesn’t generate buy/sell signals. It improves your trade filtering by identifying areas the market already respected and reacting to them with price action. Combine it with your own system , test it in replay, and use screenshots to document setups.
📌 If used with discipline, this becomes a precision tool — not a signal generator.

Pivot Points Standard Higher Timeframe█ OVERVIEW
This indicator was intended as educational purpose only and alternative way to write pine script in version 5 for Pivot Points Standard.
█ CREDITS
Credits to TradingView for original built-in source code.
█ FEATURES
Display price or percentage.
Change color for labels and lines.
█ USAGE EXAMPLES

Pivot Points And Breakout Price Action With LuckyNickVaBar Color Candle Aligned with pivot points swing high and swing lows For Those Who Are Familiar with Trading The Breakouts Of Highs & Lows Of Structure. Pivots are said to be key areas in the market where price shows heavy reaction to where reversals make occur. At these points there are swing Highs & swing lows that traders may be able to find opportunity in the market. This Script is a combination of pivot points and Barcolor signals for the breakout.

Pivot Points (Daily, Weekly, Monthly)Pivot point: P = (High + Low)/2
First support: S1 = Low
Second support, S2 = Low - 2 * (High - Low)
First resistance: R1 = High
Second resistance, R2 = High + 2 * (High - Low)
White Line: Pivot Point
Gleen Line(Thin Line): Support 1
Green Line(Thick Line): Support 2
Red Line(Thin Line): Resistance 1
Red Line (Thick Line): Resistance 2
You can adjust it to daily, weekly or monthly indicators, daily for intraday trading (1minute, 1hour etc.), weekly and monthly for day/swing trading, monthly for weekly trades. I plot the graph with steplines since I think they can show the differences of pivots from time to time more clearly, you are free to change to other plot styles like circles or regular lines if you want to. Please like this script, and let me know any questions, thanks.

Pivots Daily Weekly Monthly YearlyDaily, Weekly, Monthly and yearly pivot lines
Just the pivot lines without the support and resistance lines

Pivot PointsIndicator calculates the basic pivot points from previous day's h/l/c on intraday charts

Pivot Support/ResistanceThis indicator displays immediate Pivot Highs/Lows compared to the current price as lines on the chart. It can be useful to identify support/resistance.

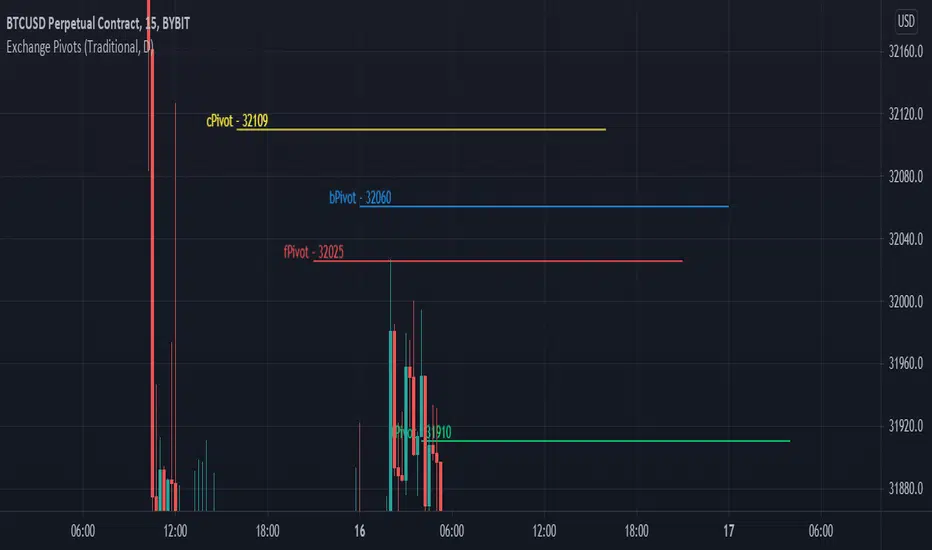
Exchange PivotsPivot points from 4 different Markets:
DailyPivot: BYBIT:BTCUSD
AsiaPivot: OKCOIN:BTCUSD
ForexPivot: FOREXCOM:BTCUSD
TradestationPivot: TRADESTATION:BTCUSD