Camarilla Pivots - Signals, Alerts, TP and SL by Tech Store OnThis is a Camarilla Pivots indicator script, which will show signals, take profit and stop-loss on the chart with alerts based on Camarilla Pivot strategies:
LONG signals: S5 > S4, TP1: S4, TP2: S3, TP3: R3 SL: Manual | S3 > R3, TP1: R3, TP2: R4, TP3: R5, SL: S4 | R4 > R5, TP1: R5, SL: R3
SHORT signals R5 > R4, TP1: R4, TP2: R3, TP3: S3, SL: Manual | R3 > S3, TP1: S3, TP2: S4, TP3: S5, S4 > S5, TP1: S5, SL: S3
Mainly, the script is based on the pivot levels and price action. The script will trigger a signal if a supporting direction candle breaks or bounces at certain pivot, triggering a direction of the potential trade with the next pivot serving as a Price Target area, each signal will potentially wait for 3 Price Target areas and if they happen will show each on chart. An opposite direction pivots are used as a Stop Loss, which the indicator will show on the chart. If stop-loss will be hit, the script will not show take profit areas considering the trade is closed with a loss. Same way if take profit area 1 is reach, it is considered that SL is moved to Entry and therefore the script will no longer show stop-loss for that trade. This indicator was mainly tested via 15min timeframe, but feel free to try different timeframes as the concept is the same.
This strategy was extensively manually tested, trade by trade, with S&P 500 ETF 15min timeframe, for back-testing results for the whole 2021 year (this is simply if you would LONG/SHORT stocks, don’t forget that if you trade Options, there is also Theta present (options price decay over time), the win rate is: 86.12%
*** If a trade was uncertain > it was marked immediately as stop-loss
*** A position was always closed at the end of the day no matter what (profit/loss)
Config: Alerts need to be set for each signal, take profit and stop-loss, it is pretty much self-explanatory, just right click the chart, select “Add alert” > next to Conditions select “Camarilla Pivot…”, for each trade signal and stop-loss, make sure it is “Once per Bar Close” and for each take-profit make sure it is “Once Per Bar”. Stop-losses are confirmed price breaks, while take-profits – we just need to touch those pivots.
Config: By Default, indicator signals are given during regular BEST (after 3PM ET – it’s power hour, which often is unpredictable + market will be closing soon) US standard market hours: 9:30AM-3PM ET, take profit and stop-losses by default are set to 9:30AM-4PM ET (US standard market hours. Both can be adjusted via Inputs. If you wish for the signals/take profit and stop-losses to be tracked 24/7 > choose the “EMPTY” space for both.
Config: Number of candles/bars to track back for opened positions is the number of Candles/Bars tracked back for each position. You can change this setting as it relates to timeframe versus trading style (day trading/swing), play around to find your best settings, by default it’s 13, which is best for day trading/15M timeframe. Please note: if position takes “too long” to reach TP or SL, it may not show TP or SL, so you need to keep an eye on this. It is best to use slightly lower number for day trading, because otherwise if you receive the same signal more than twice during the day > it will not show TP or SL for the second/third/etc. position. This is custom for you to change though, so if you want longer position tracking for the day, choose: 26 candles (this is the amount of 15M candles during the day), but keep in mind that for second/third position > it may not show you the TP1/SL.
Config: The table showing positions will show current open position on the bottom cell if position is opened per indicator, you can move or even hide this table in the indicator settings. (Please note: this is decorative thing and sometimes may show a position open, which is not actually open, especially when the market is not currently open).
Tip: Note: if pivots are too far away from each other and there is either big profit already or another support/resistance indicator (VWAP, SMA, support & resistance levels, etc.) – it is wise to take some profit off and move SL to Entry to secure profits in case market decides to turn around. This is especially wise if you trade Options as they include Theta (options price decay over time). Please note: back-test results displayed above were done without VWAP.
Tip: R5 > R4 and S5 > S4 are riskier signals as there are no pivots above/below for the SL, the script does not have a built-in stop-loss level/indicator for these, so you will need to manually set your stop-losses for these signals. Last day pivots often can help with this or simply use most recent support & resistance levels.
Tip: If trading S&P: be careful opening positions near 3PM ET, as during the “power hour” – 3-4PM ET > volatility increases and direction of the price becomes much more unpredictable. Similar: if you are in profit, it is wise to close the majority of your position at 3PM ET, before the “power hour” starts.
Tip: Very conservative trading approach: after signal happens, wait for a bounce back (price going back touching the pivot) and open position right there, that way > SL will be smaller and better risk/reward ration.
Tip: There is no limit on how many signals the script will show if it meets the conditions (in case you miss one of the signals and conditions repeat > you can still get into decent trade at next signal if it matches the condition).
Note1: if candle closes crossing/breaking several pivots at the same time and that same candle will touch take profit pivot – the script is configured to minimize showing/alerting signals/TP/SL for such conditions, so that you don’t get a very dirty chart / spammed with alerts, however sometimes it may or may not show signals and/or take profits/losses incorrectly. Overall, when you see such huge candles, it means that market volatility is bigger than usual, so a caution should be practiced.
Note2: If the signal candle almost nearly touches the first take profit area > it’s best not to open a position (you literally opening it at the first take profit pivot, and it may bounce the other way from that same pivot).
Note3: You may sometimes see take profit/stop-loss indicators in the beginning of the day or simply when pivot levels change, this is due to script registering the position open per old pivot levels and then show you take profit/stop-loss per new pivot levels.
In den Scripts nach "pivot" suchen

Adaptive MFT Extremum Pivots [Elysian_Mind]Adaptive MFT Extremum Pivots
Overview:
The Adaptive MFT Extremum Pivots indicator, developed by Elysian_Mind, is a powerful Pine Script tool that dynamically displays key market levels, including Monthly Highs/Lows, Weekly Extremums, Pivot Points, and dynamic Resistances/Supports. The term "dynamic" emphasizes the adaptive nature of the calculated levels, ensuring they reflect real-time market conditions. I thank Zandalin for the excellent table design.
---
Chart Explanation:
The table, a visual output of the script, is conveniently positioned in the bottom right corner of the screen, showcasing the indicator's dynamic results. The configuration block, elucidated in the documentation, empowers users to customize the display position. The default placement is at the bottom right, exemplified in the accompanying chart.
The deliberate design ensures that the table does not obscure the candlesticks, with traders commonly situating it outside the candle area. However, the flexibility exists to overlay the table onto the candles. Thanks to transparent cells, the underlying chart remains visible even with the table displayed atop.
In the initial column of the table, users will find labels for the monthly high and low, accompanied by their respective numerical values. The default precision for these values is set at #.###, yet this can be adjusted within the configuration block to suit markets with varying degrees of volatility.
Mirroring this layout, the last column of the table presents the weekly high and low data. This arrangement is part of the upper half of the table. Transitioning to the lower half, users encounter the resistance levels in the first column and the support levels in the last column.
At the center of the table, prominently displayed, is the monthly pivot point. For a comprehensive understanding of the calculations governing these values, users can refer to the documentation. Importantly, users retain the freedom to modify these mathematical calculations, with the table seamlessly updating to reflect any adjustments made.
Noteworthy is the table's persistence; it continues to display reliably even if users choose to customize the mathematical calculations, providing a consistent and adaptable tool for informed decision-making in trading.
This detailed breakdown offers traders a clear guide to interpreting the information presented by the table, ensuring optimal use and understanding of the Adaptive MFT Extremum Pivots indicator.
---
Usage:
Table Layout:
The table is a crucial component of this indicator, providing a structured representation of various market levels. Color-coded cells enhance readability, with blue indicating key levels and a semi-transparent background to maintain chart visibility.
1. Utilizing a Table for Enhanced Visibility:
In presenting this wealth of information, the indicator employs a table format beneath the chart. The use of a table is deliberate and offers several advantages:
2. Structured Organization:
The table organizes the diverse data into a structured format, enhancing clarity and making it easier for traders to locate specific information.
3. Concise Presentation:
A table allows for the concise presentation of multiple data points without cluttering the main chart. Traders can quickly reference key levels without distraction.
4. Dynamic Visibility:
As the market dynamically evolves, the table seamlessly updates in real-time, ensuring that the most relevant information is readily visible without obstructing the candlestick chart.
5. Color Coding for Readability:
Color-coded cells in the table not only add visual appeal but also serve a functional purpose by improving readability. Key levels are easily distinguishable, contributing to efficient analysis.
Data Values:
Numerical values for each level are displayed in their respective cells, with precision defined by the iPrecision configuration parameter.
Configuration:
// User configuration: You can modify this part without code understanding
// Table location configuration
// Position: Table
const string iPosition = position.bottom_right
// Width: Table borders
const int iBorderWidth = 1
// Color configuration
// Color: Borders
const color iBorderColor = color.new(color.white, 75)
// Color: Table background
const color iTableColor = color.new(#2B2A29, 25)
// Color: Title cell background
const color iTitleCellColor = color.new(#171F54, 0)
// Color: Characters
const color iCharColor = color.white
// Color: Data cell background
const color iDataCellColor = color.new(#25456E, 0)
// Precision: Numerical data
const int iPrecision = 3
// End of configuration
The code includes a configuration block where users can customize the following parameters:
Precision of Numerical Table Data (iPrecision):
// Precision: Numerical data
const int iPrecision = 3
This parameter (iPrecision) sets the precision of the numerical values displayed in the table. The default value is 3, displaying numbers in #.### format.
Position of the Table (iPosition):
// Position: Table
const string iPosition = position.bottom_right
This parameter (iPosition) sets the position of the table on the chart. The default is position.bottom_right.
Color preferences
Table borders (iBorderColor):
// Color: Borders
const color iBorderColor = color.new(color.white, 75)
This parameters (iBorderColor) sets the color of the borders everywhere within the window.
Table Background (iTableColor):
// Color: Table background
const color iTableColor = color.new(#2B2A29, 25)
This is the background color of the table. If you've got cells without custom background color, this color will be their background.
Title Cell Background (iTitleCellColor):
// Color: Title cell background
const color iTitleCellColor = color.new(#171F54, 0)
This is the background color the title cells. You can set the background of data cells and text color elsewhere.
Text (iCharColor):
// Color: Characters
const color iCharColor = color.white
This is the color of the text - titles and data - within the table window. If you change any of the background colors, you might want to change this parameter to ensure visibility.
Data Cell Background: (iDataCellColor):
// Color: Data cell background
const color iDataCellColor = color.new(#25456E, 0)
The data cells have a background color to differ from title cells. You can configure this is a different parameter (iDataColor). You might even set the same color for data as for the titles if you will.
---
Mathematical Background:
Monthly and Weekly Extremums:
The indicator calculates the High (H) and Low (L) of the previous month and week, ensuring accurate representation of these key levels.
Standard Monthly Pivot Point:
The standard pivot point is determined based on the previous month's data using the formula:
PivotPoint = (PrevMonthHigh + PrevMonthLow + Close ) / 3
Monthly Pivot Points (R1, R2, R3, S1, S2, S3):
Additional pivot points are calculated for Resistances (R) and Supports (S) using the monthly data:
R1 = 2 * PivotPoint - PrevMonthLow
S1 = 2 * PivotPoint - PrevMonthHigh
R2 = PivotPoint + (PrevMonthHigh - PrevMonthLow)
S2 = PivotPoint - (PrevMonthHigh - PrevMonthLow)
R3 = PrevMonthHigh + 2 * (PivotPoint - PrevMonthLow)
S3 = PrevMonthLow - 2 * (PrevMonthHigh - PivotPoint)
---
Code Explanation and Interpretation:
The table displayed beneath the chart provides the following information:
Monthly Extremums:
(H) High of the previous month
(L) Low of the previous month
// Function to get the high and low of the previous month
getPrevMonthHighLow() =>
var float prevMonthHigh = na
var float prevMonthLow = na
monthChanged = month(time) != month(time )
if (monthChanged)
prevMonthHigh := high
prevMonthLow := low
Weekly Extremums:
(H) High of the previous week
(L) Low of the previous week
// Function to get the high and low of the previous week
getPrevWeekHighLow() =>
var float prevWeekHigh = na
var float prevWeekLow = na
weekChanged = weekofyear(time) != weekofyear(time )
if (weekChanged)
prevWeekHigh := high
prevWeekLow := low
Monthly Pivots:
Pivot: Standard pivot point based on the previous month's data
// Function to calculate the standard pivot point based on the previous month's data
getStandardPivotPoint() =>
= getPrevMonthHighLow()
pivotPoint = (prevMonthHigh + prevMonthLow + close ) / 3
Resistances:
R3, R2, R1: Monthly resistance levels
// Function to calculate additional pivot points based on the monthly data
getMonthlyPivotPoints() =>
= getPrevMonthHighLow()
pivotPoint = (prevMonthHigh + prevMonthLow + close ) / 3
r1 = (2 * pivotPoint) - prevMonthLow
s1 = (2 * pivotPoint) - prevMonthHigh
r2 = pivotPoint + (prevMonthHigh - prevMonthLow)
s2 = pivotPoint - (prevMonthHigh - prevMonthLow)
r3 = prevMonthHigh + 2 * (pivotPoint - prevMonthLow)
s3 = prevMonthLow - 2 * (prevMonthHigh - pivotPoint)
Initializing and Populating the Table:
The myTable variable initializes the table with a blue background, and subsequent table.cell functions populate the table with headers and data.
// Initialize the table with adjusted bgcolor
var myTable = table.new(position = iPosition, columns = 5, rows = 10, bgcolor = color.new(color.blue, 90), border_width = 1, border_color = color.new(color.blue, 70))
Dynamic Data Population:
Data is dynamically populated in the table using the calculated values for Monthly Extremums, Weekly Extremums, Monthly Pivot Points, Resistances, and Supports.
// Add rows dynamically with data
= getPrevMonthHighLow()
= getPrevWeekHighLow()
= getMonthlyPivotPoints()
---
Conclusion:
The Adaptive MFT Extremum Pivots indicator offers traders a detailed and clear representation of critical market levels, empowering them to make informed decisions. However, users should carefully analyze the market and consider their individual risk tolerance before making any trading decisions. The indicator's disclaimer emphasizes that it is not investment advice, and the author and script provider are not responsible for any financial losses incurred.
---
Disclaimer:
This indicator is not investment advice. Trading decisions should be made based on a careful analysis of the market and individual risk tolerance. The author and script provider are not responsible for any financial losses incurred.
Kind regards,
Ely

BEST Pivots CloudHello traders,
This script is an adaption of an FXCM indicator called Pivots Cloud
Takes in input two timeframes, build the pivots based on them and fill the space between those pivots
Should be non-repainting
Best
Dave

Fibonacci Pivot PointsI have included the main support and resistance pivot point levels for the Fibonacci Pivot Points. I changed the bar colors to reflect buy and sell points so if a bar is green then that means to buy it and if it is red then sell it
Let me know if you would like to see me do any other indicators!

Support Resistance Pivot EMA Scalp Strategy [Mauserrifle]A strategy that creates signals based on: pivots, EMA 9+20, RSI, ATR, VWAP, wicks and volume.
The strategy is developed as a helper for quick long option scalping. This strategy is primarily designed for intraday trading on the 2m SPY chart with extended hours. However, users can adapt it for use on different symbols and timeframes. These signals are meant as a helper rather than fully automated trading bots.
One of the key elements is its pivot-based calculation, driven by my integrated indicator "Support and Resistance Pivot Points/Lines ". It enables multi-timeframe pivot calculations which are used to generate the signals and offers customizability, allowing you to define rounding methods and cooldown periods to refine pivot levels. The pivots, in combination with EMA crossovers, VWAP trend, and additional filters (RSI, ATR, VWAP, wicks and volume), create an entry and exit strategy for scalping opportunities that is useful for 0/1 DTE options with an average trade time of six minutes with the default setup for SPY. Option trading should be done outside TradingView. At this moment of release there is no option trading support.
All parameters used in the strategy are tweaked based on deep backtests results and real-time behavior. Be mindful that past performance does not guarantee future results.
The strategy is designed for intermediate and advanced users who are familiar intraday option scalping techniques.
How It Works
The strategy identifies entries based on multiple conditions, including: recently above pivot, recent EMA crossovers, RSI range, candle patterns, and VWAP uptrend. It avoids trades below the VWAP lower band due to poor backtesting results in those conditions. It creates a great number of signals when it detects an uptrend, which entails: VWAP and its lower/upper band slopes are going up, and the number of next high pivot points is greater than the number of lower pivot points. This indicates that we hope it will keep going up. In historical testing, this showed favorable results. This uptrend criteria runs on 15m charts max (where up to the VWAP effectiveness is the greatest).
The strategy also checks for candle and volume patterns, identified in backtesting to improve entry levels on historic data. Which include:
A red candle after multiple green ones, hoping to jump on a trend during a small pullback
Zero lower wick
Percentage and volume is up after lower volume candles
Percentage is up and the first and second EMA slopes are going up
Percentage is up, the first EMA is higher than the second, the price low is below the second EMA and price close above it
The VWAP uptrend overrules the candle and volume conditions (thus lots of signals during those moments).
The above is the base for many signals. There is a strict mode that adds extra checks such as:
not trading when there is no next low or high pivot
requiring a VWAP uptrend only
minimum candle percentages
This mode is for analyzing history and seeing performance during these conditions. It is worth it to create a separate alert for strict mode so you are aware of these conditions during trading.
When no stop has been defined, exits will always happen on pivot crossunder confirmations. If a stop is defined (default config), the strategy exits a position when:
the position is negative or no trail has been set
at least 1 bar has past
OR no stop has been defined (overrules previous)
trail has not been activated
The second exit condition happens when the close is below first EMA(9 by default) and when:
the position has been above first EMA
the gap between close and last pivot isn't small
the position is negative or no trail has been set
OR no stop has been defined (overrules above)
trail has not been activated
There are some more variations on this but the above are the most common. These exit conditions are a safety net because the strategy heavily relies on and favors stops. The settings allow changing stops, profit takers and trails. You can configure it to always sell without the conditions above.
The script will paint the pivot lines, trailing activation/stops, EMAs and entry/exits; with extra information in the data panel. For a complete view add VWAP and RSI to your chart, which are available from TradingView official indicator library. The strategy will not rely on those added indicators since VWAP and RSI are programmed in. You can add them to track the behavior of the signals based on these filters you have configured and have a complete view trading this strategy.
As mentioned earlier, the default settings are built for SPY 2m charts, with extended hours and real-time data. Open the strategy on this chart to study how all input parameters are used. If you don't have real-time data you need to adjust the minimum volume settings (set it to 0 at first).
The backtest
The default backtest configuration is set up to simulate SPY option trading.
Start capital is set to 10,000 and we risk around 5% of that per trade (1 contract)
Commission is set to 0.005%. The reason: at the time of this publication the SPY index price is approximately $580. Two ITM 0/1 DTE options contracts, each priced around $280, which is approximately $560. The typical commission for such a trade is around $3. To simulate this commission in the backtest on the SPY index itself, a commission of 0.005% per trade has been applied, approximating the options trading costs.
Slippage of 3 is set reflecting liquid SPY
The bar magnifier feature is turned on to have more realistic fills
Trading
In backtesting, setting commission and slippage to 0 on the SPY 2m chart shows many trades result around breaking even. Personally, I view them as an opportunity and safety net to help manage emotional decisions for exits. The signals are designed for short option scalps, allowing traders to take small profits and potentially re-enter during the strategy’s position window. It's advisable to take small potential profits, such as 4%, whenever the opportunity arises and consider re-entering if the setup still looks favorable, for example price still above ema9. Exiting a long position below ema9 is a common strategy for 2m scalping.
The average trade duration is approximately 6 minutes (3 bars). The choice between ITM (in-the-money), ATM (at-the-money), or OTM (out-of-the-money) options will depend on your trading style. Personally, I’ve seen better results with ITM options because they tend to move more in sync with the underlying index, thanks to their higher delta.
It’s important to note that the signals are designed to be a helper for manual trading rather than to automate a bot. Users are encouraged to take small profits and re-enter positions if favorable conditions persist. Be mindful that past performance does not guarantee future results.
For the default SPY setup the losses will mostly be 4-10% for ITM options. Be mindful of extreme volatile conditions where losses may reach 30% quickly, especially when trading ATM/OTM options.
The following settings can be changed:
8 pivot timeframes with left/right bars and days rendered
Here you can configure the timeframes for the pivots, which are crucial. The strategy wants that a crossover has happened recently (so it might enter after a crossunder if the crossover was recent) or the price is still above the crossed pivot.
When you decide to use a pivot timeframe higher than your chart, make sure it aligns the same starting point as the chart timeframe. As stated in the 43000478429 docs, there is a dependency between the resolution and the alignment of a starting point:
1–14 minutes — aligns to the beginning of a week
15–29 minutes — aligns to the beginning of a month
from 30 minutes and higher — aligns to the beginning of a year
This alignment also affects the setting of rendered days. I recommend a max value of 5 days for 1-14 minutes timeframes.
Also make sure a higher pivot timeframe can be divided by the lower. For instance I had repaint issues using 3m pivots on a 2m chart. But 4m pivots work fine.
Please look up docs 43000478429 to make sure this information is still up to date.
Pivot rounding
The pivot rounding option is used to add pivots based on a rounded price and limit the number of pivots. While this feature is disabled by default it can be useful with tweaking strategy variations, because many orders are placed at rounded levels and tend to act as strong price barriers.
There are multiple rounding methods: round, ceil/floor, roundn (decimal) and rounding to the minimal tick.
The next feature is a powerful extension called "Cooldown rounding":
Pivot cooldown rounding
This rounds new pivot levels for a cooldown period to keep the previous pivot line instead of adding a new line when they match the rounded value within the cooldown period. The existing line will be extended. This feature is useful because it makes sure the initial line is added to the exact high/low pivot level but any future lines within the rounding will just extend the existing line. This limits the number of pivots while still having precise levels (which normal rounding lacks) and allows more precise pivot trading.
This feature also helps ensure that the number of rendered lines will not exceed 500 too much, which is the render limit on TradingView.
You can set a maximum minutes for the cooldown. The default is 3 years which will enable the cooldown rounding permanently on the intraday (due to the max bar limit).
Pivot always added when new higher/lower pivot
When using cooldown rounding, one may find it useful to override this behavior when a new lower or higher pivot level has been reached. When enabled the new level will be added despite the fact that they may be rounded the same in the cooldown check. This is a good balance between limiting pivots but also allowing preciser trading.
VWAP bands multiplier
This is used to tweak the inner VWAP working for the upper and lower band. The default VWAP multiplier (0.9) is set based on backtesting since it performed better on historic data (the strategy does not trade below the lowerband). When you add the VWAP indicator from the TradingView library to the chart, make sure it uses the same multiplier setting as within this strategy so you have a correct view of the conditions the strategy acts on.
ATR EMA smoothing length
Used to tweak the ATR EMA smoothing. By default it is set up to 4 based on deep backtesting historic data.
EMA lengths
Changing the EMA length allows you to fine tune the EMA crossing behavior. By default the strategy is set up to EMA 9 and 20 which are considered commonly used values on the 2-minute chart.
Trading intraday time restrictions
For intraday charts you can configure when the strategy starts trading after market open and when it stops, including a hard sell. This makes sure there are no open positions left for the day during backtesting and can also aid in your trading style. For example some scalpers will not trade in the first two hours. Having no signals during this time can be beneficial. It is possible to configure these settings based on the number of bars or minutes.
Not trading on days the market closes earlier
By default the strategy does not trade on days the market closes earlier in the US. This makes sure there are no open positions left open during backtesting. Make sure to change it when using it on such a day. The days are: day before independence day, day after thanksgiving, Christmas eve and new years eve.
Not trading below VWAP lowerband
Backtesting has shown poor performance when trading below the VWAP lowerband but you are free to allow it to trade in such conditions. Past performance does not guarantee future results.
Minimum volume
A minimum volume can be set up. The current value is based on better deep backtest results for SPY using real-time data (48000). When you do not have a data plan for SPY, please set it to 0 and tweak based on backtests.
Minimum ATRP
The strategy has shown during my trading that it is sensitive to higher ATRP values and more volatile market conditions. There is more chance the index moves and we can profit from this during option scalping (if it moves in your favor). The default is based on SPY backtesting (0.04%), as a balance to have a lot of trades but also capture minimal movement.
RSI range
A RSI range can be set using a minimum and maximum value so we can limit trading during overbought/oversold conditions. Backtesting for SPY has shown the strategy performs better on historic data within a tighter range, so a default range has been set to 40-65.
Allow orders on every tick (no effect on stop/profit/trail)
This setting is used to allow orders on every tick. The strategy has been developed without trading on every tick but you can change this, for example when you have configured a setup different than the default configuration that you know works well with this. The default setup will not work well with it due to too many constant signals.
Stop percentage + ATRP threshold
One of the most important settings for managing the risk. I recommend setting a stop percentage first and later the ATRP threshold where the stop is calculated based on the current ATRP value. The calculated value will only be in effect when it is greater than the normal stop--the normal stop acts as baseline. The default stop is low (0.03). With a default ATRP threshold stop of 1.12, the calculated value overrules the normal stop when the value is greater. 0.03 acts as a minimum value but in reality the stop will most likely be higher on average for SPY with the default ATRP threshold.
For the default SPY setup the losses will be around 4-10% for ITM options. Be mindful of extreme volatile conditions where losses may reach 30% quickly, especially when trading ATM/OTM options.
Profit taker percentage + ATRP threshold
Same principles as the stop percentage above, but for profit taking. There is a very high ATRP threshold of 4 set by default. Backtests showed that trailing stops perform better on historic data.
Trailing stop
Used to set up a trailing stop. A useful feature to secure profit after a run-up, or get out with a small loss after initial activation. It is important to not use too tight values because they will give unrealistic backtest results and trigger too fast in real-time. Both the trail activation level and trail stop itself can be configured with a percentage value and ATRP value. I recommend setting up the ATRP last. By default the values are 0.05 for activation and 0.03 for the stop based on SPY real-time behavior.
Always sell on pivot crossunder confirmation
The strategy includes pivot crossunder confirmations as sell condition. By default it will not sell on every crossunder confirmation but checks for different conditions (explained in detail earlier in this description). You can change this behavior.
Always sell below first EMA when position has been above
The strategy sells below the first EMA when the position has been above it. By default it will not always sell but checks for different conditions (mentioned earlier in this description). You can change this behavior.
Buy modes pivot
By default the strategy buys between pivots as long as there has been a pivot crossover and EMAs crossover recently or price is still above it. You can change the behavior so it only buys on pivot crossovers or pivot crossover confirmations. Backtesting on the default setup shows decreased performance but for other strategy variations and pivot setups this feature can be useful since many scalpers do not buy between pivots.
Strict mode
There is a strict mode that adds extra checks such as not trading when there is no next low or high pivot, requiring a VWAP uptrend only and minimum candle percentages. This mode is for analyzing history and seeing performance during these conditions. It is worth it to create a separate alert for strict mode so you are aware of these conditions during trading. The deep backtests improved with these setting but past performance does not guarantee future results.
In the strict mode section you can override the stop, minimum ATRP, set up a minimum percentage, only trade VWAP uptrends and to not trade candles without a wick.
A summary and some extra detail
At the time of release only long trades are supported
The strategy is meant for quick scalping but one might find other uses for it
Enable extended hours on intraday charts so it captures more pivots
It does not trade extended hours (pre and post market) since options do not trade during those times
real-time data is recommended and required if a symbol has delayed data by default
You can configure that it trades minutes after market open and hard sells minutes after market open
The entries have a specific label text, example: "833 LE1 / 569.71 / P:569.8". This means: / / . The condition number is only for development/debug purposes for me when you have an issue.
The strategy cannot be tweaked to work on multiple symbols and timeframes with a single config. So you will have to make a config for every timeframe and symbol. I recommend using the Indicator Templates feature of TradingView. This way you can save the settings per timeframe and symbol
The strategy is per default config very dependent on (trailing) stops because it trades between pivots too. It wants that a pivot and EMA crossover has happened more recently than a crossunder. But you can change this behavior to always force crossover buys and crossunder sells.
It’s recommended to set up alerts to notify you of entry and exit signals. Watching the chart alone might cause you to miss trades, especially in fast-moving markets.
Only a max of 500 lines can be rendered on the chart, but the strategy will function with more under the hood. When you exceed 500 you will notice the beginning of the chart has no pivots, but beneath everything functions for backtesting.
Changing settings
Changing the settings for a different symbol and/or timeframe can be a challenging task. Here's a how-to you could use the first time to help you get going:
Set commission and slippage to 0. I prefer to do this so it is more clear whether you are balancing on break-even trades
Enable the pivot timeframe equal or above your chart timeframe. Avoid repainting as discussed earlier by choosing timeframes that align with the same timeframe
Set all volume, ATR, stop, profit takers and trail values to 0
Make sure strict mode is disabled at the bottom of the settings
You now have a clean state and you should see the backtest results purely based on pivot and EMA conditions
Tweak the stop and profit taker, beginning with the simple values and then ATRP threshold
At the last moment tweak the trailing stops. Tight trailing stops create an unrealistic backtest so you will need to tweak them based on real-time behavior of the symbol you're using which you will have to monitor during signals while the market is open. The default values are low (2m intraday SPY). Only with the bar magnifier feature it is somewhat possible to tweak realistic with history data. The tighter they are, the more unrealistic your backtest results. As a starting point, set the trailing stop low and find the highest activation level that doesn't change the results drastically, then increase the stop to the value you think reflects real-time behavior.
Keep refining by testing it during real-time behavior. Does it exit too early according to your own judgment? You need to increase the stop and maybe the activation level.
I hope you will find this useful!
DISCLAIMER
Trading is risky & most day traders lose money. This indicator is purely for informational & educational purposes only. Past performance does not guarantee future results.

RSI Pivots with Divergence Overlay█ OVERVIEW
The RSI Pivots with Divergence Overlay indicator is an advanced tool based on RSI, displaying dynamic bands on the price chart to simplify the identification of overbought and oversold conditions. Pivot points and divergences between them are derived from these bands, providing a comprehensive view of the market and enabling the creation of various trading strategies based on this single indicator.
█ CONCEPTS
Areas where RSI exits the bands are often reversal points in the market. The concept of this indicator is to highlight places where the probability of a trend reversal increases. Therefore, pivots and divergences have been added to better identify these key moments. Additionally, the bands allow viewing the market context in relation to the RSI indicator, facilitating analysis of momentum and volatility.
█ KEY FEATURES
Dynamic Bands and RSI Signals: The bands are calculated based on the closing price and RSI value, with dynamic scaling adjusted to market volatility. The upper band corresponds to overbought levels, the lower to oversold, and the midline is their average. The price level relative to the bands serves as a visual RSI signal, indicating potential overbought or oversold conditions.
Pivot Points: The indicator identifies local price highs and lows in relation to RSI levels. The pivot level is taken from the high/low of the candle. A high pivot is detected when the high of the candle reaches a local maximum after crossing the upper RSI level (overbought), signaling a potential reversal. A low pivot appears after a local price minimum following a drop below the lower RSI level (oversold), indicating a possible uptrend reversal. The pivot length (default 2 bars) defines the search range for these extremes, meaning that with a length of 2, a potential divergence signal will appear with a 2-candle delay, as this is the minimum time required to confirm a local pivot. Pivot lines are drawn on the chart, and labels display the RSI value (from the close of the candle) and price at the detection moment. Pivot lines disappear after the detection of the next low pivot for lower lines and high pivot for upper lines, but unbreached lines or those with high volume may still serve as support or resistance levels.
Divergence Detection: The indicator automatically detects divergences to predict trend changes. Bearish divergence occurs when the price forms a higher high pivot, but the RSI (from the close of the candle) is lower than in the previous pivot, indicating weakening upward momentum and a potential bearish reversal. Bullish divergence appears when the price forms a lower low pivot, but the RSI is higher, suggesting building momentum and a possible bullish reversal. Divergences are marked in pivot labels (e.g., "Bear Div" or "Bull Div") and supported by alerts upon detection.
Return Signals: The indicator generates buy and sell signals based on RSI (price) returning to the bands after extreme conditions, independently of pivots and divergences. A buy signal is triggered when RSI (price) crosses above the lower level (exiting oversold), suggesting a potential price rise toward the midline or upper band. A sell signal occurs when RSI (price) falls below the upper level (exiting overbought), indicating a possible price drop toward the lower band. Signals are visualized as arrows (up/down triangles) on the chart, with customizable colors.
█ CONFIGURATION
The indicator offers extensive customization options:
RSI Length (rsiLength): Sets the number of periods used to calculate RSI (default 14).
RSI Upper Level (rsiUpper): Defines the overbought threshold (default 70).
RSI Lower Level (rsiLower): Defines the oversold threshold (default 30).
Band Scaling (scale): Determines the scaling multiplier for bands based on market volatility (default 15.0).
SMA Length for Candle Midpoint (length): Number of periods for calculating the moving average of candle midpoints (default 200). This parameter is used to smooth price data, enabling more accurate volatility assessment and band width adjustment to market dynamics.
Pivot Length (pivotLength): Sets the range (in bars) for detecting local price extremes (default 2).
Pivot Label Offset (pivotLabelOffset): Multiplier for the candle range to position pivot labels (default 0.3).
Show Bands (showBands): Enables/disables the display of bands on the chart.
Show Fill (showFill): Enables/disables the fill between bands and the midline.
Show Pivot Lines (showPivotLines): Enables/disables pivot lines on the chart.
Show Pivot Labels (showPivotLabels): Enables/disables labels with RSI and price values at pivots.
Show Return Signals (showReturnSignals): Enables/disables the display of buy and sell signals.
Colors and Style: Customizable colors for bands, fills, pivot lines, labels, and line widths (default 1).
█ USAGE
The indicator performs best when combined with other technical analysis tools, such as Fibonacci levels, moving averages, or trendlines, to confirm pivot, divergence, and return signals. It enables traders to identify key reversal points, detect hidden trend weaknesses through divergences, and confirm trade entries with return signals.
Usage Examples:
Price bounces off a previous pivot with high volume – this increases the probability of a trend change or correction.
A similar situation when RSI is outside the bands strengthens the signal.
If divergence occurs in addition, we have further confirmation.
This can be combined with Fibonacci levels to check if Fibo zones overlap with pivot lines – this may increase the chance of a strong price reaction.
█ ALERTS
The indicator supports alerts for:
Buy and sell signals (RSI returning to bands).
Detection of bearish and bullish divergences.

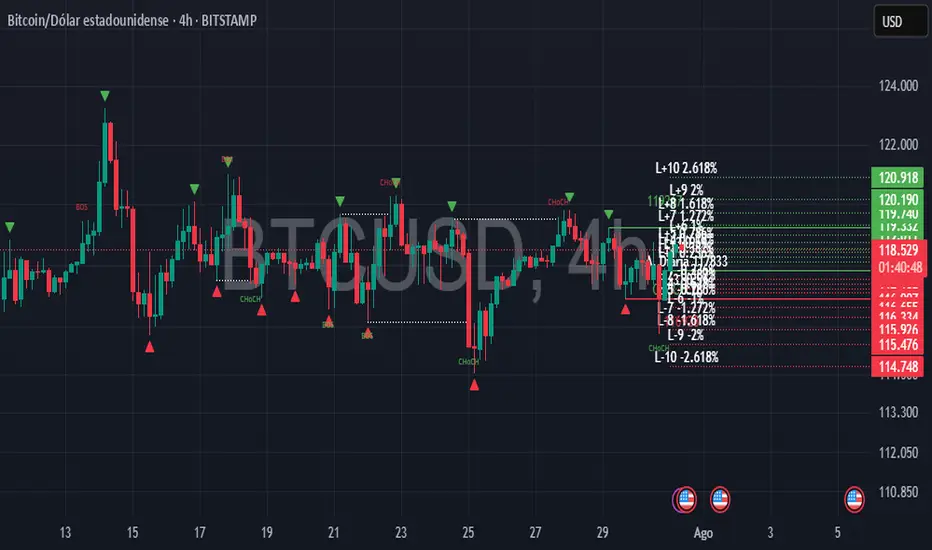
Daily Short-Term Levels & Pivots with BOS/CHoCHDaily Short-Term Levels & Pivots with BOS/CHoCH
OverviewThis indicator combines essential tools for short-term and long-term traders, integrating Daily Short-Term Levels (NDCP), Pivots, and detection of Break of Structure (BOS) and Change of Character (CHoCH). Designed for TradingView, it’s ideal for scalping, day trading, and market structure analysis across any timeframe. It provides clear visualization of key levels, pivots, and structural patterns, with customizable settings to suit various trading styles.
Key Features
1. Daily Short-Term Levels (NDCP)
Purpose: Displays support and resistance levels based on the daily open, calculated as bullish and bearish percentages.
Levels: Up to 10 bullish levels (L+1 to L+10) and 10 bearish levels (L-1 to L-10), with configurable percentages (default: 0.236% to 2.618%).
Daily Open: A line marking the daily open price, with an option to display its value.
Customization:
Enable/disable levels and daily open.
Adjust colors, line thickness, and style (solid, dashed, dotted).
Position labels (Left, Right, Center) with adjustable offsets.
Show levels on all timeframes or only on daily and higher.
2. Pivots
Purpose: Identifies significant highs and lows (pivots) on the chart, useful for spotting reversal or continuation points.
Visualization: Green triangles (highs) and red triangles (lows) mark pivot points.
Customization:
Enable/disable pivot visualization.
Adjust the number of left and right bars to define pivots (default: 5 bars).
Change triangle colors.
3. Break of Structure (BOS) and Change of Character (CHoCH)
Purpose: Detects Break of Structure (BOS) and Change of Character (CHoCH) based on pivots, aiding in trend identification and reversals.
Visualization:
Resistance (green) and support (red) lines drawn from the latest pivots.
Labels for "BOS" (trend continuation), "CHoCH" (trend reversal), and "CD" (cross detected).
Historical CHoCH lines (optional, dotted) to track past structural changes.
Customization:
Enable/disable BOS/CHoCH and historical CHoCH lines.
Adjust colors and thickness for lines and labels.
Configure pivot sensitivity for BOS/CHoCH detection.
Indicator Settings
General Settings
Enable Daily Short-Term Levels: Toggle daily open-based levels.
Enable Pivots: Show triangles for significant highs/lows.
Enable BOS and CHoCH: Activate detection of structural breaks and reversals.
Daily Short-Term Levels
Show Daily Levels: Enable/disable bullish and bearish level lines.
Enable on All Timeframes: Display levels on intraday timeframes (e.g., 1M, 5M).
Text Color: Set the color for level labels.
Daily Open: Options to show the open line, its value, color, thickness, and style.
Label Alignment: Left (near daily open), Right (chart edge), or Center, with adjustable offsets.
Bullish/Bearish Levels: Configure percentages (0.236% to 2.618%), colors, line thickness, style, and value visibility.
Pivots and BOS/CHoCH
Pivot Colors: Green for highs, red for lows.
Left/Right Bars: Define pivot sensitivity (number of bars without breaking the high/low).
Show BOS: Enable labels for structural breaks.
Show Historical CHoCH Lines: Display dotted lines for past CHoCH events.
Colors and Thickness: Customize support, resistance, BOS, CHoCH lines, and "CD" labels.
How to Use
Add to Chart:
Search for "Daily Short-Term Levels & Pivots with BOS/CHoCH" in TradingView’s indicators and add it.
Initial Setup:
By default, daily levels, pivots, and BOS/CHoCH are enabled.
Adjust level percentages, colors, and styles to match your strategy.
Interpretation:
Daily Levels: Use bullish (L+1 to L+10) and bearish (L-1 to L-10) levels as support/resistance zones for entries, exits, or stops.
Pivots: Triangles mark key reversal or continuation points. Use them to confirm trends or identify high-probability zones.
BOS/CHoCH:
BOS: Indicates trend continuation (bullish if breaking a support, bearish if breaking a resistance).
CHoCH: Signals a potential trend reversal (bullish to bearish or vice versa).
CD: Confirms a pivot level cross, marking the start of a BOS or CHoCH.
Timeframes:
Ideal for scalping (1M, 5M) with "Enable on All Timeframes" activated.
Effective on higher timeframes (4H, D) for structural analysis.
Customization:
Adjust pivot bars (left_bars, right_bars) for more/less sensitivity.
Configure label offsets to avoid clutter on detailed charts.
Notes and Recommendations
Scalping: Use low timeframes (1M, 5M) with "Enable on All Timeframes" for visible daily levels. Set left_bars/right_bars to lower values (3-5) for faster pivots.
Swing Trading: On higher timeframes (4H, D), daily levels and BOS/CHoCH help identify key trend zones.
Avoid Clutter: If labels overlap, adjust offset_etiquetas, offset_derecha, or offset_centro, or select "Right" or "Center" alignment.
Testing: Experiment with percentage settings and styles to suit your market (Forex, stocks, crypto, etc.).
Limitations: On very low timeframes, pivots may be sensitive to noise. Increase left_bars/right_bars for more robust pivots.
Acknowledgments
Developed with passion for the TradingView community. I hope this indicator enhances your technical analysis! Feel free to leave feedback or contact me with suggestions or issues.
Happy trading!
[CP]Pivot Boss Multi Timeframe CPR Inception with MACD and EMAINTRODUCTION:
This indicator combines multi-timeframe CPR bands with MACD Momentum and EMA trend, all projected on the candlestick chart through a novel visualization.
If you have seen my other indicators on TradingView, you would know that I use floor pivots a lot and “Secrets of a Pivot Boss” is my favorite book. While using floor pivots, time and again I have noticed an interesting price behavior,
Trending moves in price typically start from around the Central Pivot Range (CPR). The CPR could be from ANY timeframe. These moves can easily be caught using simple momentum and trend indicators like MACD and EMA crossovers.
Yes, it is that simple. Follow along to understand how to use this indicator.
INDICATOR SETTINGS:
RANGEBOUND MACD AND EMA MARKINGS:
TradingView limits the max number of labels that can be shown on a chart to 500. Therefore, if you go far back enough, you won't see any markings for the MACD or EMA setups. If you are looking to test the efficacy of this indicator in the past, change the start and end dates to your desired timeframe and then select the ‘Mark MACD and EMA Setups in Range?’ option.
MULTI TIMEFRAME CENTRAL PIVOT RANGE:
Here you can select CPRs and their bands from which timeframes are shown on the chart. I will share my favorite settings later in this description.
CPR CONFIGURATION:
Show CPR Labels: CPRs markings can carry labels, so that you don’t confuse between which line is what. Use this setting to toggle them On/Off.
Show Next Time Period Pivots: Check this option if you want to see the CPR of the next time period. This is typically done to figure out the ’Two Day CPR Relationship’ . Read the book, “Secrets of a Pivot Boss”, to understand more.
EMA TREND:
Show EMA on the Chart: EMAs will be plotted on the chart. Standard stuff.
Mark EMA Crossovers on Chart: EMA crossovers will be marked on the chart in diamond shapes. If you are using EMA crossovers, I recommend setting this option to True.
Rest of the EMA settings are fairly obvious.
MACD MOMENTUM:
Projecting MACD parameters directly on the candlesticks is surely going to give you a new perspective about price action and MACD.
Also, in order to better understand the MACD projections on the chart, you can add a standard MACD indicator on the chart with default settings to figure out what my indicator is actually showing you.
Marking MACD Crossovers on Chart: Marks the MACD signal crossovers on the chart. This visualization was a game changer for me.
Show MACD Histogram on Chart: Projects the complete MACD Histogram in a novel fashion (Try it!). You will be able to visually see the ebbs and flow of momentum in the charts.
Mark MACD Histogram Peaks on Chart: Marks only the MACD peaks instead of the complete histogram. Peaks are a great way to enter an ongoing trend and to play an intraday rangebound market.
Rest of the settings are just the standard settings that you will find in a typical MACD indicator.
ALERTS:
Not shown in the settings panel, but I have added alerts for EMA and MACD Crossovers so that you don’t have to sit in front of the charts or constantly check the price all day long.
If you don’t know how to set alerts in TradingView, then please Google it.
INDICATOR USAGE EXAMPLES:
This indicator can be used in intraday as well as in higher timeframes.
There are quite a few variations possible, I personally prefer to use the EMA crossovers in intraday (5m) and MACD on Daily timeframes.
This is just a matter of personal preference, some people might prefer using EMAs only or MACD only in all timeframes.
Here are my personal settings for the intraday 5-minute timeframe:
Turn on all the CPR pivots starting from Yearly all the way to Daily. You can turn on 6 hourly and 4 hourly as well if you want.
Hourly CPR is mostly used when the price is in a strong trend and you missed the entry and don’t know when to enter. Price will typically experience pullbacks towards the Hourly CPR, before resuming in the direction of the trend. That is your chance to hop onto the bandwagon.
For Intraday, I keep the Bands off. Just a personal preference here.
You can turn ON the Show CPR Labels , if you want.
Turn ON both the options in the EMA TREND section. You would want to see the EMA crossovers marked on the chart as well as the EMAs themselves, as the distance between the two EMAs will give you an idea about the strength of the trend.
Keep rest of the settings in the EMA section as default (you can change the colors if you wish). I keep the same EMAs as the ones kept in the MACD indicator. I like to keep things simple.
In the MACD MOMENTUM section, turn ON Mark MACD Histogram Peaks on Chart and all the other options turned OFF. Leave the other settings as default. By the way, these are the default settings of the standard MACD Indicator.
You can set up EMA Bullcross and Bearcross alarms if you like.
Before checking out the examples, remember one super simple rule:
SOME OF THE BEST TRENDING MOVES IN THE MARKET, BE IT INTRADAY OR OTHERWISE, ORIGINATE IN THE VICINITY OF A LARGER TIMEFRAME PIVOT/CPR.
Look for price settling above/below a pivot, and then a move away from the pivot in any direction is typically a trending move.
You can use hourly pivots or MACD Histogram peaks marked on the chart to enter an existing trend, or add to your positions.
Let’s have a look at a few recent intraday examples from the Crypto, Indian, and US equity markets.
I have added my comments in the charts to make you easily understand what is going on.
Understand that both, moving average crossover and MACD, will give out a lot of signals (chop) every day. But almost 70% of them are going to be fake signals. It is the signals that you get when the price is near a Pivot, that tend to convert into gorgeous trending moves that last.
BTC 5m Charts
NIFTY Futures 5m Charts (good intraday trends are hard to find here, as the market is very efficient)
TSLA 5m Charts
Some important points for using this indicator in higher timeframes:
For higher timeframes, my personal preference is to go with the MACD indicator. I personally find MACD to be lethal on daily and weekly timeframes, if you know how to use it well.
The default settings of the indicator are the settings I use for both, Daily and Weekly, timeframes. Additionally, I turn off the CPR labels.
In theory large trending moves still have a big probability to start near an important pivot level, however, in larger timeframes, trending moves can start from anywhere. They need not start in the vicinity of any important pivot (but they often do!).
Weekly pivots can act as great pullback levels when the price is in strong momentum, when trading on the daily timeframe.
Quarterly Pivots act as great pullback levels when the price is in strong momentum, when trading on the weekly timeframe.
BTC Weekly Chart
BTC Daily Chart
Nifty Weekly Chart
Nifty Daily Chart
NASDAQ Weekly Chart
NASDAQ Daily Chart
FINAL WORDS:
Please understand that I have Cherry Picked the examples to showcase the capability of the indicator and its usage.
DO NOT conflate the accuracy of examples with the accuracy of this indicator.
Biggest catch is the fact that this indicator, like every other indicator out there, will have whipsaws. Some I have also marked in the example charts.
You need to come up with your own technique to avoid whipsaws, one technique I have shared here…… big moves typically start near pivots.
Work on avoiding whipsaws and finding you own edge in the markets.
If you really want to learn how to use Pivots, read the book ’Secrets of a Pivot Boss’ . This book can change your life.

(JS) Pivot Point RSILet me start by saying I really enjoyed putting this together - and also that it initially wasn't my idea, a friend of mine suggested it to me earlier today and I was intrigued by the concept.
So this is exactly what it sounds like - Pivot Points RSI.
I plan on adding the R4S4 and R5S5 in the future, though it only goes to 3 at the moment.
However I did include halfway points between existing pivots.
This RSI calculates prior closes + highs + lows based on the intraday (or week, or month, depending on chart resolution) indicator values, then takes that info and creates pivots on the RSI to plot potential RSI support and resistance. This is a pretty great concept and I plan on putting it to use in the future myself.
Includes 3 color schemes.

Curvature Tensor Pivots🌀 Curvature Tensor Pivots
Curvature Tensor Pivots: Geometric Pivot Detection Through Differential Geometry
Curvature Tensor Pivots applies mathematical differential geometry to market price analysis, identifying pivots by measuring how price trajectories bend through space. Unlike traditional pivot indicators that rely solely on price highs and lows, this system calculates the actual geometric curvature of price paths and detects inflection points where the curvature changes sign or magnitude—the mathematical hallmarks of directional transitions.
The indicator combines three components: precise curvature measurement using second-derivative calculus, tensor weighting that multiplies curvature by volatility and momentum, and a tension-based prediction system that identifies compression before pivots form. This creates a forward-looking pivot detector with built-in confirmation mechanics.
What Makes This Original
Pure Mathematical Foundation
This indicator implements the classical differential geometry curvature formula κ = |y''| / (1 + y'²)^(3/2), which measures how sharply a curve bends at any given point. In price analysis, high curvature indicates sharp directional changes (active pivots), while curvature approaching zero indicates straight-line motion (inflection points forming). This mathematical approach is fundamentally different from pattern recognition or statistical pivots—it measures the actual geometry of price movement.
Tensor Weighting System
The core innovation is the tensor scoring mechanism, which multiplies geometric curvature by two market-state variables: volatility (ATR expansion/compression) and momentum (rate of change strength). This creates a multi-dimensional strength metric that distinguishes between meaningful pivots and noise. A high tensor score means high curvature is occurring during significant volatility with strong momentum—a genuine structural turning point. Low tensor scores during high curvature indicate choppy, low-conviction moves.
Tension-Based Prediction
The system calculates tension as the inverse of curvature (Tension = 1 - κ). When curvature is low, tension is high, indicating price is moving in a straight line and approaching an inflection point where it must curve. The tension cloud visualizes this compression, tightening before pivots form and expanding after they complete. This provides anticipatory signals rather than purely reactive confirmation.
Integrated Confirmation Architecture
Rather than simply flagging high curvature, the system requires convergence of four elements: geometric inflection detection (sign changes in second derivative or curvature extrema), traditional price structure pivots (pivot highs/lows), tensor strength above threshold, and minimum spacing between signals. This multi-layer confirmation prevents false signals while maintaining sensitivity to genuine turning points.
This is not a combination of existing indicators—it's an application of pure mathematical concepts (differential calculus and tensor algebra) to market geometry, creating a unique analytical framework.
Core Components and How They Work Together
1. Differential Geometry Engine
The foundation is calculus-based trajectory analysis. The system treats price as a function y(t) and calculates:
First derivative (y'): The slope of the price trajectory, representing directional velocity
Second derivative (y''): The acceleration of slope change, representing how quickly direction is shifting
Curvature (κ): The normalized geometric bend, calculated using the formula κ = |y''| / (1 + y'²)^(3/2)
This curvature value is then normalized to a 0-1 range using adaptive statistical bounds (mean ± 2 standard deviations over a rolling window). High κ values indicate sharp bends (active pivots), while κ approaching zero indicates inflection points where the trajectory is straightening before changing concavity.
2. Tensor Weighting Components
The raw curvature is weighted by market dynamics to create the tensor score:
Volatility Component: Calculated as current ATR divided by baseline ATR (smoothed average). Values above 1.0 indicate expansion (higher conviction moves), while values below 1.0 indicate compression (lower reliability). This ensures pivots forming during volatile periods receive higher scores than those in quiet conditions.
Momentum Component: Measured using rate of change (ROC) strength normalized by recent average. High momentum indicates sustained directional pressure, confirming that curvature changes represent genuine trend shifts rather than noise.
Tensor Score Fusion: The final tensor score = κ × Volatility × Momentum × Direction × Gain. This creates a directional strength metric ranging from -1 (strong bearish curvature) to +1 (strong bullish curvature). The magnitude represents conviction, while the sign represents direction.
These components work together by filtering geometric signals through market-state context. A high curvature reading during low volatility and weak momentum produces a low tensor score (likely noise), while the same curvature during expansion and strong momentum produces a high tensor score (likely genuine pivot).
3. Inflection Point Detection System
Inflection points occur where the second derivative changes sign (concave to convex or vice versa) or where curvature reaches local extrema. The system detects these through multiple methods:
Sign change detection: When y'' crosses zero, the price trajectory is transitioning from curving upward to downward (or vice versa)
Curvature extrema: When κ reaches a local maximum or minimum, indicating peak bend intensity
Near-zero curvature: When κ falls below an adaptive threshold, indicating straight-line motion before a directional change
These geometric signals are combined with traditional pivot detection (pivot highs and lows using configurable lookback/lookahead periods) to create confirmed inflection zones. The geometric math identifies WHERE inflections are forming, while price structure confirms WHEN they've completed.
4. Tension Cloud Prediction
Tension is calculated as 1 - κ, creating an inverse relationship where low curvature produces high tension. This represents the "straightness" of price trajectory—when price moves in a straight line, it's building tension that must eventually release through a curved pivot.
The tension cloud width adapts to this tension value: it tightens (narrows) when curvature is low and tension is high, providing visual warning that a pivot is forming. After the pivot completes and curvature increases, tension drops and the cloud expands, confirming the turn.
This creates a leading indicator component within the system: watch for the cloud to compress, then wait for the pivot marker and tensor direction confirmation to enter trades.
5. Multi-Layer Visualization System
The visual components work hierarchically:
Curvature ribbons (foundation): Width expands with curvature magnitude, color shifts with tensor direction (green bullish, red bearish)
Tension cloud (prediction): Purple overlay that compresses before pivots and expands after
Tensor waves (context): Harmonic oscillating layers driven by three phase accumulators (curvature, tensor magnitude, volatility), creating visual texture that becomes erratic before pivots and smooth during trends
Inflection zones (timing): Golden background highlighting when geometric conditions indicate inflection points forming
Pivot markers (confirmation): Triangles marking confirmed pivots where geometric inflection + price structure + tensor strength all align
Each layer adds information without redundancy: ribbons show current state, tension shows prediction, waves show regime character, zones show geometric timing, and markers show confirmed entries.
Calculation Methodology
Phase 1 - Derivative Calculations
Price is normalized by dividing by a 50-period moving average to improve numerical stability. The first derivative is calculated as the bar-to-bar change, then smoothed using a configurable smoothing length (default 3 bars) to reduce noise while preserving structure.
The second derivative is calculated as the bar-to-bar change in the first derivative, also smoothed. This represents the acceleration of directional change—positive values indicate price is curving upward (concave up), negative values indicate curving downward (concave down).
Phase 2 - Curvature Formula
The classical curvature formula is applied:
Calculate y'² (first derivative squared)
Calculate (1 + y'²)^1.5 as the denominator
Divide |y''| by this denominator to get raw curvature κ
This formula ensures curvature is properly normalized regardless of the steepness of the trajectory. A vertical line with high slope (large y') can still have low curvature (straight), while a gradual slope with changing direction produces high curvature (curved).
The raw curvature is then normalized to 0-1 range using adaptive bounds (rolling mean ± 2 standard deviations), allowing the system to adapt to different market volatility regimes.
Phase 3 - Tensor Weighting
ATR is calculated over the specified volatility length (default 14). Current ATR is divided by smoothed ATR to create the volatility ratio. Momentum is calculated as the rate of change over the momentum length (default 10), normalized by recent average ROC.
The tensor score is computed as: Curvature × Volatility × Momentum × Tensor Gain × Direction Sign
This creates the final directional strength metric used for ribbon coloring and signal generation.
Phase 4 - Inflection Detection
Multiple conditions are evaluated simultaneously:
Second derivative sign changes (y'' × y'' < 0)
Curvature local maxima (previous bar κ > current bar κ AND previous bar κ > two bars ago κ)
Curvature local minima (opposite condition)
Low curvature threshold (current κ < adaptive threshold)
Any of these conditions triggers inflection zone highlighting. For confirmed pivot signals, inflection detection must coincide with traditional pivot highs/lows AND tensor magnitude must exceed threshold AND minimum spacing since last signal must be satisfied.
Phase 5 - Tension Calculation
Tension = 1 - κ (smoothed)
This inverse relationship creates the compression/expansion dynamic. When curvature approaches zero (straight trajectory), tension approaches 1 (maximum compression). When curvature is high (sharp bend), tension approaches zero (released).
The tension cloud bands are calculated as: Basis ± (Ribbon Width × Tension)
This creates the visual tightening effect before pivots.
Phase 6 - Wave Generation
Three phase accumulators are maintained:
Phase 1: Accumulates based on curvature magnitude (0.1 × κ per bar)
Phase 2: Accumulates based on tensor magnitude (0.15 × tensor per bar)
Phase 3: Accumulates based on volatility (0.08 × volatility per bar)
For each wave layer (2-8 configurable), a unique frequency is used (layer number × 0.6). The wave offset is calculated as:
Amplitude × (sin(phase1 × frequency) × 0.4 + sin(phase2 × frequency × 1.2) × 0.35 + sin(phase3 × frequency × 0.8) × 0.25)
This creates complex harmonic motion that reflects the interplay of curvature, strength, and volatility. When these components are aligned, waves are smooth; when misaligned (pre-pivot conditions), waves become chaotic.
All calculations are deterministic and execute on closed bars only—there is no repainting.
How to Use This Indicator
Setup and Configuration
Apply the indicator to your chart with default settings initially
Enable the main dashboard (top right recommended) to monitor curvature, tensor, and tension metrics in real-time
Enable the curvature matrix (bottom right) to see historical patterns in the heatmap
Choose your ribbon mode: "Dual Ribbon" shows both bullish and bearish zones, "Tension Cloud" emphasizes the compression zones
For your first session, observe how the tension cloud behaves before confirmed pivots—you'll notice it consistently tightens (narrows) before pivot markers appear, then expands after.
Signal Interpretation
High Pivot (Bearish) - Red triangle above price:
Occurs when price makes a pivot high (local maximum)
Second derivative is negative (concave down curvature)
Tensor magnitude exceeds threshold (strong confirmation)
Minimum spacing requirement met (noise filter)
Interpretation: A confirmed bearish inflection point has formed. Price trajectory has curved over and is transitioning from upward to downward movement.
Low Pivot (Bullish) - Blue triangle below price:
Occurs when price makes a pivot low (local minimum)
Second derivative is positive (concave up curvature)
Tensor magnitude exceeds threshold
Spacing requirement met
Interpretation: A confirmed bullish inflection point has formed. Price trajectory has curved upward and is transitioning from downward to upward movement.
Dashboard Metrics
κ (Curvature): 0-100% reading. Above 70% = sharp active pivot, 40-70% = moderate curve, below 40% = gentle or approaching inflection
Tensor: Directional strength. Arrow indicates bias (⬆ bullish, ⬇ bearish, ⬌ neutral). Magnitude indicates conviction.
Volatility: Current ATR expansion state. Above 70% = high volatility (pivots more significant), below 40% = compressed (pivots less reliable)
Momentum: Directional strength. High values confirm trend continuation, low values suggest exhaustion
Tension: 0-100% reading. Above 70% = pivot forming soon (high compression), below 40% = pivot recently completed (expanded)
State: Real-time regime classification:
"🟢 STABLE" = normal trending conditions
"🟡 TENSION" = pivot forming (high compression)
"🔴 HIGH κ" = active sharp pivot in progress
"⚠ INFLECTION" = geometric inflection zone (critical transition)
Curvature Matrix Heatmap
The matrix shows the last 30 bars (configurable 10-100) of historical data across five metrics:
κ row: Curvature evolution (green = low, yellow = moderate, red = high)
Tension row: Purple intensity shows compression building
Tensor row: Strength evolution (green = strong, yellow = moderate, red = weak)
Volatility row: Expansion state
Momentum row: Directional conviction
Pattern recognition: Look for purple clustering in the tension row followed by red spikes in the κ row—this shows compression → release pivot sequence.
Trading Workflow
Step 1 - Monitor Tension:
Watch the tension cloud and dashboard tension metric. When tension rises above 60-70% and the cloud visibly tightens, a pivot is building. The matrix will show purple bands clustering.
Step 2 - Identify Inflection Zone:
Wait for the golden background glow (inflection zone) to appear. This indicates the geometric conditions are met: curvature is approaching zero, second derivative is near sign change, or curvature extrema detected. The dashboard state will show "⚠ INFLECTION ZONE".
Step 3 - Confirm Direction:
Check the tensor arrow in the dashboard:
⬆ (bullish tensor) = expect bullish pivot
⬇ (bearish tensor) = expect bearish pivot
Also verify the y'' status in the dashboard:
"🔵↑ Concave Up" = bullish curvature forming
"🔴↓ Concave Down" = bearish curvature forming
Step 4 - Wait for Pivot Marker:
Do not enter on inflection zones alone—wait for the confirmed pivot marker (triangle). This ensures all confirmation layers have aligned: geometric inflection + price structure pivot + tensor strength + spacing filter.
Step 5 - Execute Entry:
Long entry: Blue triangle below price + ⬆ tensor + tension releasing (dropping)
Short entry: Red triangle above price + ⬇ tensor + tension releasing
Step 6 - Manage Risk:
Initial stop: Place beyond the opposite ribbon edge plus one ATR buffer
Trailing stop: Follow the ribbon edge (basis ± adaptive width) as curvature sustains in your direction
Exit signal: If tension spikes again quickly (another inflection forming), consider taking profit—the trend may be reversing
Best Practices
Use multiple timeframe confirmation: Check that higher timeframe tensor aligns with your trade direction
Respect the spacing filter: If a pivot just fired, wait for minimum spacing before taking another signal
Distinguish regime: In "🔴 HIGH κ" state (choppy), reduce position size; in "🟢 STABLE" state, full confidence
Combine with support/resistance: Pivots near key levels have higher probability
Watch particle density: Clustering of particles indicates rising curvature intensity
Observe wave texture: Smooth flowing waves = trending environment (pivots are reversals); chaotic erratic waves = reversal environment (pivots are trend starts)
Ideal Market Conditions
Best Performance
Liquid markets with clear swing structure (forex majors, large-cap stocks, major indices)
Timeframes from 15-minute to daily (the system adapts across timeframes)
Markets with periodic swings and clear directional phases (where geometric curvature is meaningful)
Trending markets with consolidation phases (where tension builds before breakouts)
Challenging Conditions
Extremely choppy/sideways markets for extended periods (high curvature but low tensor magnitude—system will reduce signals appropriately)
Very low liquidity instruments (erratic price action creates false geometric signals)
Ultra-low timeframes (1-minute or below) where spread and noise dominate structure
Markets in deep consolidation (the system will show high tension but no clean pivot confirmation)
The indicator is designed to adapt: in poor conditions, tensor scores remain low and signals reduce naturally. In optimal conditions, tension compression → inflection → pivot confirmation sequences occur cleanly.
Parameter Optimization by Trading Style
Scalping (5-15 Minute Charts)
Curvature Window: 3-5 (faster response)
Curvature Smoothing: 2 (minimal lag)
Volatility Length: 10-14
Momentum Length: 8-10
Tensor Gain: 1.2-1.5 (moderate sensitivity)
Inflection Threshold: 0.10-0.15 (more sensitive)
Min Pivot Spacing: 3-5 bars
Pivot Mode: Aggressive
Ribbon Mode: Dual Ribbon (clearer entries)
Day Trading (15-60 Minute Charts)
Curvature Window: 5 (default)
Curvature Smoothing: 3 (balanced)
Volatility Length: 14
Momentum Length: 10
Tensor Gain: 1.5 (default)
Inflection Threshold: 0.15 (default)
Min Pivot Spacing: 5-8 bars
Pivot Mode: Normal or Adaptive
Ribbon Mode: Dual Ribbon
Swing Trading (4-Hour to Daily Charts)
Curvature Window: 7-10 (smoother)
Curvature Smoothing: 4-5 (noise reduction)
Volatility Length: 20-30
Momentum Length: 14-20
Tensor Gain: 1.8-2.5 (higher conviction requirement)
Inflection Threshold: 0.20-0.30 (more selective)
Min Pivot Spacing: 8-12 bars
Pivot Mode: Conservative
Ribbon Mode: Tension Cloud (focus on compression zones)
Performance Optimization
If you experience lag on lower-end systems:
Reduce Wave Layers: 4 → 2 (50% reduction in calculations)
Lower Particle Density: 3 → 1 (66% reduction in label creation)
Decrease Matrix History: 30 → 15 bars (50% reduction in table size)
Disable Tensor Waves entirely if not needed for your trading
Important Disclaimers
- This indicator is a technical analysis tool designed to identify potential pivot points through mathematical analysis of price trajectory geometry. It should not be used as a standalone trading system. Always combine with proper risk management, position sizing, and additional confirmation methods (support/resistance, volume analysis, multi-timeframe alignment).
- The curvature and tensor calculations are deterministic mathematical formulas applied to historical price data—they do not predict future price movements with certainty. Past geometric patterns do not guarantee future pivot behavior. The tension-based prediction system identifies conditions where pivots are likely to form based on trajectory straightness, but market conditions can change rapidly.
- All trading involves risk. Use appropriate stop losses and never risk more than you can afford to lose. The signal spacing filters and tensor confirmation layers are designed to reduce noise, but no indicator can eliminate false signals entirely.
This system is most effective when combined with sound trading principles, market context awareness, and disciplined execution.
Technical Notes
All calculations execute on closed bars only (no repainting)
Lookback functions limited to 5000 bars maximum
Arrays are fixed-size (waves) or hard-capped (particles at 80 labels)
Dashboard and matrix update only on the last bar to minimize computational load
Particle generation throttled to every 2 bars
Phase accumulators use modulo operations to prevent overflow
Statistical normalization (mean ± 2σ) automatically adapts to different volatility regimes
— Dskyz, Trade with insight. Trade with anticipation.
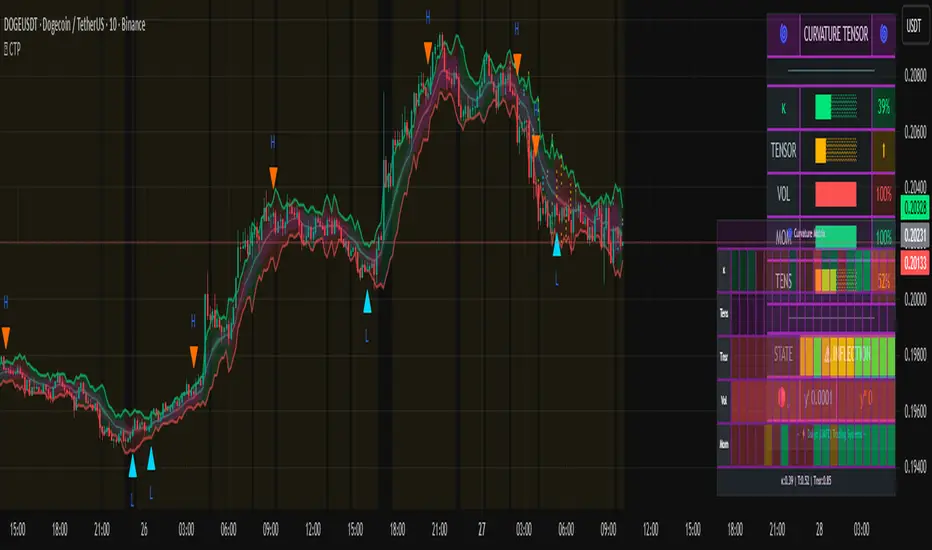
Volume Profile + Pivot Levels [ChartPrime]⯁ OVERVIEW
Volume Profile + Pivot Levels combines a rolling volume profile with price pivots to surface the most meaningful levels in your selected lookback window. It builds a left-side profile from traded volume, highlights the session’s Point of Control (PoC) , and then filters pivot highs/lows so only those aligned with significant profile volume are promoted to chart levels. Each promoted level extends forward until price retests it—so your chart stays focused on levels that actually matter.
⯁ KEY FEATURES
Rolling Volume Profile (Period & Resolution)
Calculates a profile over the last Period bars (default 200). The profile is discretized into Volume Profile Resolution bins (default 50) between the highest high and lowest low inside the window. Each bin accumulates traded volume and is drawn as a smooth left-side polyline for compact, lightweight rendering.
HL = array.new()
// collect highs/lows over 'start' bars to define profile range
for i = 0 to start - 1
HL.push(high ), HL.push(low )
H = HL.max(), L = HL.min()
bin_size = (H - L) / bins
// accumulate per-bin volume
for i = 0 to bins - 1
for j = 0 to start - 1
if close >= (L + bin_sizei) - bin_size and close < (L + bin_size*(i+1)) + bin_size
Bins += volume
Delta-Aware Coloring
The script tracks up-minus-down volume across all period to compute a net Delta . The profile, PoC line, and PoC label adopt a teal tone when net positive, and maroon when net negative—an immediate read on buyer/seller dominance inside the window.
Point of Control (PoC) + Volume Label
Automatically marks the highest-volume bin as the PoC . A horizontal PoC line extends to the last bar, and a label shows the absolute volume at the PoC. Toggle visibility via PoC input.
Pivot Detection with Volume Filter
Identifies raw pivots using Length (default 10) on both sides of the bar. Each candidate pivot is then validated against the profile: only pivots that land within their bin and meet or exceed the Filter % threshold (percentage of PoC volume) are promoted to chart levels. This removes weak, low-participation pivots.
// pivot promotion when volume% >= pivotFilter
if abs(mid - p.value) <= bin_size and volPercent >= pivotFilter
// draw labeled pivot level
line.new(p.index - pivotLength, p.value, p.index + pivotLength, p.value, width = 2)
Forward-Extending, Self-Stopping Levels
Promoted pivot levels extend forward as dotted rays. As soon as price intersects a level (high/low straddles it), that level stops extending—so your chart doesn’t clutter with stale zones.
Concise Level Labels (Volume + %)
Each promoted pivot prints a compact label at the pivot bar with its bin’s absolute volume and percentage of PoC volume (ordering flips for highs vs. lows for quick read).
Lightweight Visuals
The volume profile is rendered as a smooth polyline rather than dozens of boxes, keeping charts responsive even at higher resolutions.
⯁ SETTINGS
Volume Profile → Period : Lookback window used to compute the profile (max 500).
Volume Profile → Resolution : Number of bins; higher = finer structure.
Volume Profile → PoC : Toggle PoC line and volume label.
Pivots → Display : Show/hide volume-validated pivot levels.
Pivots → Length : Pivot detection left/right bars.
Pivots → Filter % 0–100 : Minimum bin strength (as % of PoC) required to promote a pivot level.
⯁ USAGE
Read PoC direction/color for a quick net-flow bias within your window.
Prioritize promoted pivot levels —they’re backed by meaningful participation.
Watch for first retests of promoted levels; the line will stop extending once tested.
Adjust Period / Resolution to match your timeframe (scalps → higher resolution, shorter period; swings → lower resolution, longer period).
Tighten or loosen Filter % to control how selective the level promotion is.
⯁ WHY IT’S UNIQUE
Instead of plotting every pivot or every profile bar, this tool cross-checks pivots against the profile’s internal volume weighting . You only see levels where price structure and liquidity overlap—clean, data-driven levels that self-retire after interaction, so you can focus on what the market actually defends.

Market Structure & Liquidity: CHoCHs+Nested Pivots+FVGs+Sweeps//Purpose:
This indicator combines several tools to help traders track and interpret price action/market structure; It can be divided into 4 parts;
1. CHoCHs, 2. Nested Pivot highs & lows, 3. Grade sweeps, 4. FVGs.
This gives the trader a toolkit for determining market structure and shifts in market structure to help determine a bull or bear bias, whether it be short-term, med-term or long-term.
This indicator also helps traders in determining liquidity targets: wether they be voids/gaps (FVGS) or old highs/lows+ typical sweep distances.
Finally, the incorporation of HTF CHoCH levels printing on your LTF chart helps keep the bigger picture in mind and tells traders at a glance if they're above of below Custom HTF CHoCH up or CHoCH down (these HTF CHoCHs can be anything from Hourly up to Monthly).
//Nomenclature:
CHoCH = Change of Character
STH/STL = short-term high or low
MTH/MTL = medium-term high or low
LTH/LTL = long-term high or low
FVG = Fair value gap
CE = consequent encroachement (the midline of a FVG)
~~~ The Four components of this indicator ~~~
1. CHoCHs:
•Best demonstrated in the below charts. This was a method taught to me by @Icecold_crypto. Once a 3 bar fractal pivot gets broken, we count backwards the consecutive higher lows or lower highs, then identify the CHoCH as the opposite end of the candle which ended the consecutive backwards count. This CHoCH (UP or DOWN) then becomes a level to watch, if price passes through it in earnest a trader would consider shifting their bias as market structure is deemed to have shifted.
•HTF CHoCHs: Option to print Higher time frame chochs (default on) of user input HTF. This prints only the last UP choch and only the last DOWN choch from the input HTF. Solid line by default so as to distinguish from local/chart-time CHoCHs. Can be any Higher timeframe you like.
•Show on table: toggle on show table(above/below) option to show in table cells (top right): is price above the latest HTF UP choch, or is price below HTF DOWN choch (or is it sat between the two, in a state of 'uncertainty').
•Most recent CHoCHs which have not been met by price will extend 10 bars into the future.
• USER INPUTS: overall setting: SHOW CHOCHS | Set bars lookback number to limit historical Chochs. Set Live CHoCHs number to control the number of active recent chochs unmet by price. Toggle shrink chochs once hit to declutter chart and minimize old chochs to their origin bars. Set Multi-timeframe color override : to make Color choices auto-set to your preference color for each of 1m, 5m, 15m, H, 4H, D, W, M (where up and down are same color, but 'up' icon for up chochs and down icon for down chochs remain printing as normal)
2. Nested Pivot Highs & Lows; aka 'Pivot Highs & Lows (ST/MT/LT)'
•Based on a seperate, longer lookback/lookforward pivot calculation. Identifies Pivot highs and lows with a 'spikeyness' filter (filtering out weak/rounded/unimpressive Pivot highs/lows)
•by 'nested' I mean that the pivot highs are graded based on whether a pivot high sits between two lower pivot highs or vice versa.
--for example: STH = normal pivot. MTH is pivot high with a lower STH on either side. LTH is a pivot high with a lower MTH on either side. Same applies to pivot lows (STL/MTL/LTL)
•This is a useful way to measure the significance of a high or low. Both in terms of how much it might be typically swept by (see later) and what it would imply for HTF bias were we to break through it in earnest (more than just a sweep).
• USER INPUTS: overall setting: show pivot highs & lows | Bars lookback (historical pivots to show) | Pivots: lookback/lookforward length (determines the scale of your pivot highs/lows) | toggle on/off Apply 'Spikeyness' filter (filters out smooth/unimpressive pivot highs/lows). Set Spikeyness index (determines the strength of this filter if turned on) | Individually toggle on each of STH, MTH, LTH, STL, MTL, LTL along with their label text type , and size . Toggle on/off line for each of these Pivot highs/lows. | Set label spacer (atr multiples above / below) | set line style and line width
3. Grade Sweeps:
•These are directly related to the nested pivots described above. Most assets will have a typical sweep distance. I've added some of my expected sweeps for various assets in the indicator tooltips.
--i.e. Eur/Usd 10-20-30 pips is a typical 'grade' sweep. S&P HKEX:5 - HKEX:10 is a typical grade sweep.
•Each of the ST/MT/LT pivot highs and lows have optional user defined grade sweep boxes which paint above until filled (or user option for historical filled boxes to remain).
•Numbers entered into sweep input boxes are auto converted into appropriate units (i.e. pips for FX, $ or 'handles' for indices, $ for Crypto. Very low $ units can be input for low unit value crypto altcoins.
• USER INPUTS: overall setting: Show sweep boxes | individually select colors of each of STH, MTH, LTH, STL, MTL, LTL sweep boxes. | Set Grade sweep ($/pips) number for each of ST, MT, LT. This auto converts between pips and $ (i.e. FX vs Indices/Crypto). Can be a float as small or large as you like ($0.000001 to HKEX:1000 ). | Set box text position (horizontal & vertical) and size , and color . | Set Box width (bars) (for non extended/ non-auto-terminating at price boxes). | toggle on/off Extend boxes/lines right . | Toggle on/off Shrink Grade sweeps on fill (they will disappear in realtime when filled/passed through)
4. FVGs:
•Fair Value gaps. Represent 'naked' candle bodies where the wicks to either side do not meet, forming a 'gap' of sorts which has a tendency to fill, or at least to fill to midline (CE).
•These are ICT concepts. 'UP' FVGS are known as BISIs (Buyside imbalance, sellside inefficiency); 'DOWN' FVGs are known as SIBIs (Sellside imbalance, buyside inefficiency).
• USER INPUTS: overall setting: show FVGs | Bars lookback (history). | Choose to display: 'UP' FVGs (BISI) and/or 'DOWN FVGs (SIBI) . Choose to display the midline: CE , the color and the line style . Choose threshold: use CE (as opposed to Full Fill) |toggle on/off Shrink FVG on fill (CE hit or Full fill) (declutter chart/see backtesting history)
////••Alerts (general notes & cautionary notes)::
•Alerts are optional for most of the levels printed by this indicator. Set them via the three dots on indicator status line.
•Due to dynamic repainting of levels, alerts should be used with caution. Best use these alerts either for Higher time frame levels, or when closely monitoring price.
--E.g. You may set an alert for down-fill of the latest FVG below; but price will keep marching up; form a newer/higher FVG, and the alert will trigger on THAT FVG being down-filled (not the original)
•Available Alerts:
-FVG(BISI) cross above threshold(CE or full-fill; user choice). Same with FVG(SIBI).
-HTF last CHoCH down, cross below | HTF last CHoCH up, cross above.
-last CHoCH down, cross below | last CHoCH up, cross above.
-LTH cross above, MTH cross above, STH cross above | LTL cross below, MTL cross below, STL cross below.
////••Formatting (general)::
•all table text color is set from the 'Pivot highs & Lows (ST, MT, LT)' section (for those of you who prefer black backgrounds).
•User choice of Line-style, line color, line width. Same with Boxes. Icon choice for chochs. Char or label text choices for ST/MT/LT pivot highs & lows.
////••User Inputs (general):
•Each of the 4 components of this indicator can be easily toggled on/off independently.
•Quite a lot of options and toggle boxes, as described in full above. Please take your time and read through all the tooltips (hover over '!' icon) to get an idea of formatting options.
•Several Lookback periods defined in bars to control how much history is shown for each of the 4 components of this indicator.
•'Shrink on fill' settings on FVGs and CHoCHs: Basically a way to declutter chart; toggle on/off depending on if you're backtesting or reading live price action.
•Table Display: applies to ST/MT/LT pivot highs and to HTF CHoCHs; Toggle table on or off (in part or in full)
////••Credits:
•Credit to ICT (Inner Circle Trader) for some of the concepts used in this indicator (FVGS & CEs; Grade sweeps).
•Credit to @Icecold_crypto for the specific and novel concept of identifying CHoCHs in a simple, objective and effective manner (as demonstrated in the 1st chart below).
CHoCH demo page 1: shifting tweak; arrow diagrams to demonstrate how CHoCHs are defined:
CHoCH demo page 2: Simplified view; short lookback history; few CHoCHs, demo of 'latest' choch being extended into the future by 10 bars:
USAGE: Bitcoin Hourly using HTF daily CHoCHs:
USAGE-2: Cotton Futures (CT1!) 2hr. Painting a rather bullish picture. Above HTF UP CHoCH, Local CHoCHs show bullish order flow, Nice targets above (MTH/LTH + grade sweeps):
Full Demo; 5min chart; CHoCHs, Short term pivot highs/lows, grade sweeps, FVGs:
Full Demo, Eur/Usd 15m: STH, MTH, LTH grade sweeps, CHoCHs, Usage for finding bias (part A):
Full Demo, Eur/Usd 15m: STH, MTH, LTH grade sweeps, CHoCHs, Usage for finding bias, 3hrs later (part B):
Realtime Vs Backtesting(A): btc/usd 15m; FVGs and CHoCHs: shrink on fill, once filled they repaint discreetly on their origin bar only. Realtime (Shrink on fill, declutter chart):
Realtime Vs Backtesting(B): btc/usd 15m; FVGs and CHoCHs: DON'T shrink on fill; they extend to the point where price crosses them, and fix/paint there. Backtesting (seeing historical behaviour):

Smoothed Pivot Reversal Alerts [QuantNomad]This is study with alerts for my "Smoothed Pivot Reversal Strategy". Strategy script is open to the public so you can use it freely.
When creating alerts - choose "Once Per Bar Close"
It's a pro indicator, you can have access to it for a small fee. Link to my PRO indicators you can find in my signature.

Smoothed Pivot Reversal Strategy [QuantNomad]With this strategy trying to rethink the standard pivot reversal strategy.
Don't like the idea that for 10/10 pivot you have to wait for 10points to confirm it. So I used multiple pivot levels and calculated the average line. This way when we have a new high level approaching it smoothly.
This way you can have a bit better price for entries but the risk of fake entries bit bigger as well.
I'm using the usual trailing stop loss as an exit for this strategy.
Parameters for this strategy is pretty simple:
Left/Right bars for pivot points.
Additional smoothing - you can additionally smooth pivot lines with EMA
% for Traling SL
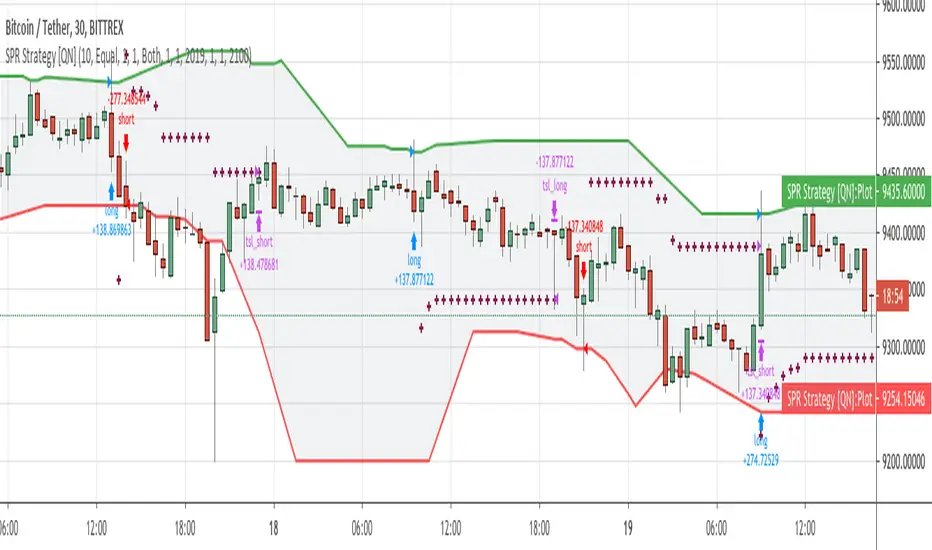
PRP - Pivot Reversal + PSAR Alerts [QuantNomad]This is study with alerts for my "PRP - Pivot Reversal + PSAR Strategy".
When creating alerts - choose "Once Per Bar Close"
It's a pro indicator, you can have access to it for a small fee. Link to my PRO indicators you can find in my signature.

(JS) Multi-Time Frame Pivot Point DetectorSick of flipping through Pivot Point settings to change the time frame?
Or to hide certain ones because it screws up the auto-zoom?
Or are you just wishing there was something out there that was simple and effective?
Well - me too, that's why I made this automatic Pivot Points detector. Right now it only goes to S3/R3 (will expand in the future), but I made this specifically for my day trading template.
So this automatically detects the nearest Pivot Points above and below price - and it does Daily, Weekly, and Monthly, so there should be 6 lines showing at all times.
Speaking of which....
Blue - Daily
Green - Weekly
Red- Monthly
You'll also notice a really thick line will appear time to time - that thick line (on all time frames is the Pivot line, so obviously above it is the resistance lines and below it lies the support lines.
All you have to do is turn it on and you'll be completely aware of your surroundings across multiple time frames all at once, hope you like it!
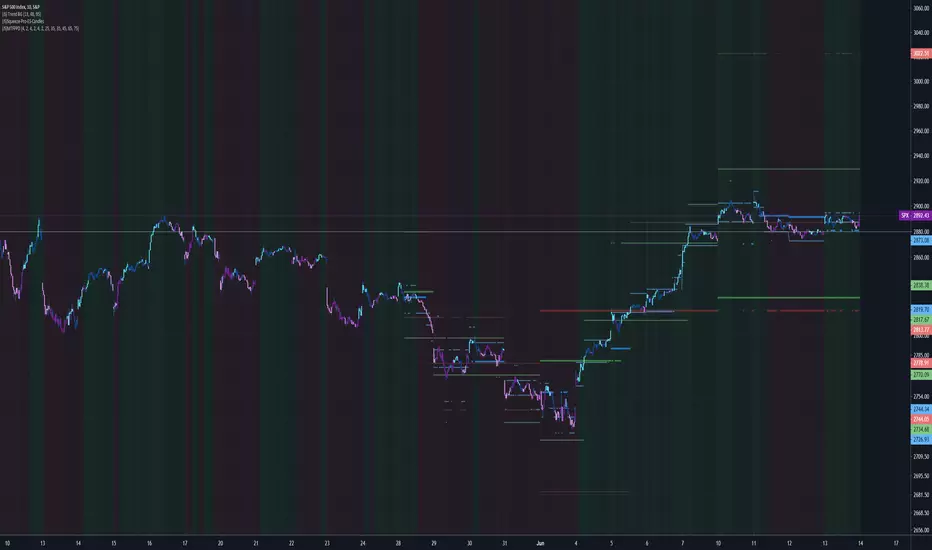
Volume-Weighted Pivot BandsThe Volume-Weighted Pivot Bands are meant to be a dynamic, rolling pivot system designed to provide traders with responsive support and resistance levels that adapt to both price volatility and volume participation. Unlike traditional daily pivot levels, this tool recalculates levels bar-by-bar using a rolling window of volume-weighted averages, making it highly relevant for intraday traders, scalpers, swing traders, and algorithmic systems alike.
-- What This Indicator Does --
This tool calculates a rolling VWAP-based pivot level, and surrounds that central pivot with up to five upper bands (R1–R5) and five lower bands (S1–S5). These act as dynamic zones of potential resistance (R) and support (S), adapting in real time to price and volume changes.
Rather than relying on static session or daily data, this indicator provides continually evolving levels, offering more relevant levels during sideways action, trending periods, and breakout conditions.
-- How the Bands Are Calculated --
Pivot (VWAP Pivot):
The core of this system is a rolling Volume-Weighted Average Price, calculated over a user-defined window (default 20 bars). This ensures that each bar’s price impact is weighted by its volume, giving a more accurate view of fair value during the selected lookback.
Volume-Weighted Range (VW Range):
The highest high and lowest low over the same window are used to calculate the volatility range — this acts as a spread factor.
Support & Resistance Bands (S1–S5, R1–R5):
The bands are offset above and below the pivot using multiples of the VW Range:
R1 = Pivot + (VW Range × multiplier)
R2 = R1 + (VW Range × multiplier)
R3 = R2 + (VW Range x multiplier)
...
S1 = Pivot − (VW Range × multiplier)
S2 = S1 − (VW Range × multiplier)
S3 = S2 - (VW Range x multiplier)
...
You can control the multiplier manually (default is 0.25), to widen or tighten band spacing.
Smoothing (Optional):
To prevent erratic movements, you can optionally toggle on/off a simple moving average to the pivot line (default length = 20), providing a smoother trend base for the bands.
-- How to Use It --
This indicator can be used for:
Support and resistance identification:
Price often reacts to R1/S1, and the outer bands (R4/R5 or S4/S5) act as overshoot zones or strong reversal areas.
Trend context:
If price is respecting upper bands (R2–R3), the trend is likely bullish. If price is pressing into S3 or lower, it may indicate sustained selling pressure or a breakdown.
Volatility framing:
The distance between bands adjusts based on price range over the rolling window. In tighter markets, the bands compress — in volatile moves, they expand. This makes the indicator self-adaptive.
Mean reversion trades:
A move into R4/R5 or S4/S5 without continuation can be a sign of exhaustion — potential for reversal toward the pivot.
Alerting:
Built-in alerts are available for crosses of all major bands (R1–R5, S1–S5), enabling trade automation or scalp alerts with ease.
-- Visual Features --
Fuchsia Lines: Mark all Resistance (R1–R5) levels.
Lime Lines: Mark all Support (S1–S5) levels.
Gray Circle Line: Marks the rolling pivot (VWAP-based).
-- Customizable Settings --
Rolling Length: Number of bars used to calculate VWAP and VW Range.
Multiplier: Controls how wide the bands are spaced.
Smooth Pivot: Toggle on/off to smooth the central pivot.
Pivot Smoothing Length: Controls how many bars to average when smoothing is enabled.
Offset: Visually shift all bands forward/backward in time.
-- Why Use This Over Standard Pivots? --
Traditional pivots are based on previous session data and remain fixed. That’s useful for static setups, but may become irrelevant as price action evolves. In contrast:
This system updates every bar, adjusting to current price behavior.
It includes volume — a key feature missing from most static pivots.
It shows multiple bands, giving a full view of compression, breakout potential, or trend exhaustion.
-- Who Is This For? --
This tool is ideal for:
Day traders & scalpers who need relevant intraday levels.
Swing traders looking for evolving areas of confluence.
Algorithmic/systematic traders who rely on quantifiable, volume-aware support/resistance.
Traders on all assets: works on crypto, stocks, futures, forex — any chart that has volume.

QuantNomad - Pivot Points AlertsVery simple scripts that will allow you to receive alerts for new Pivot Lows/Highs Points.
A solid arrow points to actual point low/high point, transparent - to the bar, you'll receive alerts for (Shifter by rightBars).
And remember:
Past performance does not guarantee future results.

Multi-TF Fibonacci Pivot Points V4.5.3📊 MULTI-TIMEFRAME FIBONACCI PIVOT POINTS
Display Fibonacci-based pivot points from multiple timeframes simultaneously on any chart. Perfect for identifying key support/resistance levels, confluences, and high-probability trade zones.
═══════════════════════════════════════════════════════
✨ KEY FEATURES
🎯 MULTI-TIMEFRAME DISPLAY
• View pivots from up to 6 different timeframes at once
• 4HR, Daily, Weekly, Monthly, Quarterly, and Yearly support
• Automatic timeframe validation prevents invalid combinations
• Smart label placement reduces chart clutter
📈 FIBONACCI LEVELS
• S3: -0.618 (Deep support)
• S2: -0.382 (Intermediate support)
• S1: -0.236 (Shallow support)
• Pivot Point: 0.000 (Central pivot)
• R1: +0.236 (Shallow resistance)
• R2: +0.382 (Intermediate resistance)
• R3: +0.618 (Deep resistance)
• Optional additional Fibonacci levels available in settings
🎨 HIGHLY CUSTOMIZABLE
• Individual color control for each timeframe
• Show/hide specific levels (S3, S2, S1, P, R1, R2, R3)
• Adjustable line width and transparency
• Optional price labels
• Compact or detailed label formats
🔔 ALERT SYSTEM
• Long Signal: Price crosses above pivot point
• Short Signal: Price crosses below pivot point
• Customizable alert messages
• Works with webhooks for automated trading
═══════════════════════════════════════════════════════
💡 HOW TO USE
**CONFLUENCE TRADING:**
When multiple timeframe pivots align at the same price level, it creates a strong confluence zone. These areas often act as significant support/resistance.
Example:
• Daily R1, Weekly P, and Monthly S1 all near $90,000
• This creates a high-probability resistance zone
• Consider taking profits or shorting at this confluence
**TREND IDENTIFICATION:**
• Price above all pivots = Strong uptrend
• Price below all pivots = Strong downtrend
• Price between pivots = Range-bound or transitional
**SUPPORT/RESISTANCE:**
• Fibonacci levels act as dynamic support/resistance
• S1/R1: First line of support/resistance (shallow retracements)
• S2/R2: Intermediate zones (common reversal points)
• S3/R3: Deep retracements (high-probability bounce areas)
**ENTRY/EXIT STRATEGIES:**
• Buy at support levels (S1, S2, S3) in uptrends
• Sell at resistance levels (R1, R2, R3) in downtrends
• Use pivot point as dynamic stop loss or take profit target
• Combine with your preferred indicators for confirmation
═══════════════════════════════════════════════════════
🎓 PRACTICAL EXAMPLE: Confluence Zone Reversal
**Setup:**
• BTC in downtrend, approaching $84,000
• Daily S2, Weekly S1, and Monthly Pivot all converge at $84,000
• Strong 3-timeframe confluence = high-probability support zone
**Entry Signal:**
• Wait for price to test the $84,000 confluence level
• Look for reversal confirmation (reversal pattern, bullish engulfing, RSI divergence, volume spike etc)
• Enter long position above confluence at $84,100
**Risk Management:**
• Stop loss: $83,500 (below S2 support level – generally recommended to use same TF although for better R:R you could consider using a different TF support level)
• Initial target: $86,000 (Daily R1 resistance)
• Risk/Reward: ~$500 risk for $1,900 profit potential = 1:3.8 ratio
**Why It Works:**
When multiple timeframes agree on a support level, it creates strong buyer interest at that price zone. Professional traders and algorithms often place orders at these confluence areas. When the support holds, the reversal moves are typically swift and powerful as trapped short sellers cover positions and new buyers enter.
This same principle works in reverse for resistance confluences (shorting opportunities) and can be applied across any timeframe or asset class.
═══════════════════════════════════════════════════════
⚙️ SETTINGS GUIDE
**TIMEFRAME CONFIGURATION:**
• Enable/disable each timeframe independently
• Set 4HR, Daily, Weekly, Monthly, Quarterly, Yearly periods
• Warning system prevents invalid timeframe combinations
**LEVEL VISIBILITY:**
• Toggle individual Fibonacci levels on/off
• Hide levels you don't trade to reduce clutter
• Keep only the levels relevant to your strategy
• Enable optional additional Fibonacci levels if needed
**VISUAL CUSTOMIZATION:**
• Choose colours that match your charting style
• Adjust line width for visibility (1-3 recommended)
• Set transparency for background levels (20-40% typical)
• Enable/disable price labels based on preference
**ALERTS:**
• Set up alerts for pivot point crosses
• Receive notifications when price tests key levels
• Use webhook URLs for automated trade execution
• Customize alert messages for different scenarios
═══════════════════════════════════════════════════════
📚 UNDERSTANDING FIBONACCI PIVOTS
**What are Fibonacci Pivot Points?**
Traditional pivot points use simple averages (High + Low + Close) / 3. Fibonacci pivot points enhance this by applying Fibonacci ratios (0.236, 0.382, 0.618) to calculate support and resistance levels.
**Why Fibonacci Ratios?**
These ratios appear frequently in nature and financial markets:
• 0.236 (23.6%) - Shallow retracement
• 0.382 (38.2%) - Common retracement zone
• 0.618 (61.8%) - Golden ratio, deep retracement
Markets often respect these levels due to trader psychology and self-fulfilling prophecy.
**Multi-Timeframe Advantage:**
Higher timeframe pivots carry more weight:
• Yearly/Quarterly pivots: Major support/resistance (long-term positioning)
• Monthly pivots: Significant levels (swing trades)
• Weekly pivots: Intermediate zones (position trades)
• Daily pivots: Short-term levels (day trades)
• 4HR/Lower timeframes: Intraday precision (scalping)
When pivots from multiple timeframes align, the confluence creates stronger support/resistance that professional traders watch closely.
═══════════════════════════════════════════════════════
⚡ INTEGRATION WITH STRATEGY BUILDING
This indicator works seamlessly with strategy builders and backtesting tools. The alert system provides clean signals that can be used as entry/exit conditions.
These signals can be incorporated into automated strategies or used as confluence filters with your existing trading system.
**Compatible with:**
• TradingView's Strategy Tester
• Most strategy building tools
• Webhook-based automation platforms
• Custom Pine Script strategies
Simply reference the indicator's signals in your strategy logic or use the visual levels for manual discretionary trading.
⚠️ IMPORTANT NOTES
**Timeframe Rules:**
• Current chart timeframe must be LOWER than indicator timeframes
• Example: Can't display Daily pivots on Weekly chart
• Invalid combinations will show warning in label
• Solution: Switch to lower chart timeframe or adjust indicator settings
**Performance Considerations:**
• Displaying 6 timeframes with all levels = 42 lines on chart
• Disable unused timeframes to reduce visual clutter
• Hide levels you don't actively trade (e.g., keep only S1, P, R1)
• Use transparency to make background levels less prominent
**Alert Best Practices:**
• Test alerts on paper trading account first
• Understand alert fires when bar CLOSES (not on wick)
• Pivot point crosses generate signals, not individual S/R levels
• Combine with other confluence factors (don't trade alerts blindly)
═══════════════════════════════════════════════════════
📖 PRACTICE SUGGESTIONS
1. Observe how price respects pivot levels (especially HTF ones)
2. If available, use the Replay feature to identify how price reacts to different pivot levels (try to check in bullish, bearish and flat markets)
3. Use additional confluence for trades (previous S/R, momentum indicators etc)
4. Backtest your strategy before live trading
5. Keep a trading journal of pivot-based trades
6. Gradually add more timeframes as you gain experience
═══════════════════════════════════════════════════════
📈 BUILDING COMPLETE TRADING SYSTEMS
Multi-Timeframe Fibonacci Pivots excels at identifying high-probability price levels and confluence zones. For traders looking to develop complete trading strategies around these signals, the natural progression involves:
**1. Signal Identification** (This Indicator)
Identify key support/resistance levels and confluence zones across multiple timeframes
**2. Strategy Development**
Test and validate trading rules around these pivot levels using backtesting tools
**3. Trade Management**
Implement proper entry execution, exit management, position sizing, and risk controls
This indicator integrates seamlessly with strategy testing and trade management systems. For traders serious about building robust, professional-grade trading approaches, explore the additional indicators/strategies I will be publishing soon.
The goal is always the same: transform good trading ideas into consistently executable strategies with proper risk management.
═══════════════════════════════════════════════════════
🎯 QUICK START CHECKLIST
Getting started with MTF Fibonacci Pivots:
Add indicator to chart (lower timeframe than pivots you want to see)
Enable 1-2 timeframes initially (e.g., Daily + Weekly)
Customize colours to match your chart theme
Hide levels you don't trade (optional: keep only S1, P, R1)
Identify current confluence zones
Mark key levels you'll watch for the session/day/week
Set up alerts for pivot crosses (optional)
Practice identifying setups before taking real trades
═══════════════════════════════════════════════════════
🌟 ENJOY TRADING WITH MTF FIBONACCI PIVOTS!
Whether you're a day trader looking for intraday levels, a swing trader seeking major support/resistance zones, or a long-term investor identifying key price areas, Multi-Timeframe Fibonacci Pivots provides the levels you need at a glance.
Happy trading! 📈
═══════════════════════════════════════════════════════
🔐 RISK DISCLAIMER
This indicator is for educational
and informational purposes only. It does not constitute financial advice.
**Remember:**
• No indicator is 100% accurate
• Always use proper risk management (stop losses, position sizing)
• Past performance does not guarantee future results
• Combine with your own analysis and trading plan
• Never risk more than you can afford to lose
• Test thoroughly on paper trading before using real capital
Trading carries significant risk. Ensure you understand these risks before trading.
═══════════════════════════════════════════════════════
💬 FEEDBACK & SUPPORT
**Found a bug?** Please report via comments with:
• Chart timeframe, asset, and indicator settings
• Description of issue and expected behavior
**Feature requests?** I'm always looking to improve! Let me know:
• What additional functionality would help your trading?
• Which features do you use most/least?
• How can the indicator be more user-friendly?
**Success story?** Share how you're using MTF Fibonacci Pivots! Community feedback helps guide future development.
═══════════════════════════════════════════════════════
🙏 CREDITS & ACKNOWLEDGMENTS
**Original Concept:**
This indicator is based on the excellent "Fibonacci Extension / Retracement / Pivot Points" script by dgtrd. The original script provided a solid foundation for calculating Fibonacci-based pivot levels.
**Changes in This Version:**
• Multi-timeframe capability (display up to 6 timeframes simultaneously)
• Optional additional Fibonacci levels
• Enhanced customization (colors, widths, transparency per timeframe)
• Improved label system (compact/detailed formats, smart placement)
• Timeframe validation and warnings
• Optimized performance for multiple timeframes
**Attribution:**
Original script by dgtrd:
Enhancements and multi-timeframe implementation with the support of Al
If you find value in this indicator, please also check out dgtrd's original work and other excellent pivot point indicators in the TradingView community.

[FS] Pivot Measurements# Pivot Measurements
An advanced TradingView indicator that combines LuxAlgo's pivot point detection algorithm with automatic measurement calculations between consecutive pivots.
## Features
### Pivot Detection
- **Regular Pivots**: Detects standard pivot highs and lows using configurable pivot length
- **Missed Pivots**: Identifies missed reversal levels that occurred between regular pivots
- **Visual Indicators**:
- Regular pivot highs: Red downward triangle (▼)
- Regular pivot lows: Teal upward triangle (▲)
- Missed pivots: Ghost emoji (👻)
- **Zigzag Lines**: Connects pivots with colored lines (solid for regular, dashed for missed)
- **Ghost Levels**: Horizontal lines indicating missed pivot levels
### Measurement System
- **Automatic Measurements**: Calculates price movements between consecutive pivots
- **Visual Display**:
- Transparent colored boxes (blue for upward, red for downward movements)
- Measurement labels showing:
- Price change (absolute and percentage)
- Duration (bars, days, hours, minutes)
- Volume approximation
- **Smart Positioning**: Labels positioned outside boxes (above for upward, below for downward)
- **Color Coding**: Blue for positive movements, red for negative movements
## Parameters
### Pivot Detection
- **Pivot Length** (default: 50): Number of bars on each side to identify a pivot point
- **Regular Pivots**: Toggle and colors for regular pivot highs and lows
- **Missed Pivots**: Toggle and colors for missed pivot detection
### Measurements
- **Number of Measurements** (1-10, default: 10): Maximum number of measurements to display
- **Show Measurement Boxes**: Toggle to show/hide measurement boxes and labels
- **Box Transparency** (0-100, default: 90): Transparency level for measurement boxes
- **Border Transparency** (0-100, default: 50): Transparency level for box borders
- **Label Background Transparency** (0-100, default: 30): Transparency level for label backgrounds
- **Label Size**: Size of measurement labels (tiny, small, normal, large)
## Usage
1. Add the indicator to your chart
2. Configure the **Pivot Length** based on your timeframe:
- Lower values for shorter timeframes (e.g., 10-20 for 1-5 min)
- Higher values for longer timeframes (e.g., 50-100 for daily)
3. Adjust pivot colors and visibility as needed
4. Customize measurement display settings:
- Set the number of measurements to display
- Adjust transparency levels for boxes, borders, and labels
- Choose label size
## Technical Details
- **Pine Script Version**: v6
- **Pivot Detection**: Based on () algorithm for detecting regular and missed pivots
- **Measurement Calculation**:
- Measures between consecutive pivots (from most recent to older)
- Calculates price change, percentage change, duration, and approximate volume
- Automatically sorts pivots chronologically
- **Performance**: Optimized with helper functions to reduce code duplication
## Notes
- The indicator automatically limits the number of stored pivots to optimize performance
- Measurements are only created when there are at least 2 pivots detected
- All measurements are recalculated on each bar update
- The indicator uses `max_bars_back=5000` to ensure sufficient historical data
## License
This indicator uses LuxAlgo's pivot detection algorithm from (). Please refer to the original LuxAlgo license for pivot detection components.

Curvature Tensor Pivots - HIVECurvature Tensor Pivots - HIVE
I. CORE CONCEPT & ORIGINALITY
Curvature Tensor Pivots - HIVE is an advanced, multi-dimensional pivot detection system that combines differential geometry, reinforcement learning, and statistical physics to identify high-probability reversal zones before they fully form. Unlike traditional pivot indicators that rely on simple price comparisons or lagging moving averages, this system models price action as a smooth curve in geometric space and calculates its mathematical curvature (how sharply the price trajectory is "bending") to detect pivots with scientific precision.
What Makes This Original:
Differential Geometry Engine: The script calculates first and second derivatives of price using Kalman-filtered trajectory analysis, then computes true mathematical curvature (κ) using the classical formula: κ = |y''| / (1 + y'²)^(3/2). This approach treats price as a physical phenomenon rather than discrete data points.
Ghost Vertex Prediction: A proprietary algorithm that detects pivots 1-3 bars BEFORE they complete by identifying when velocity approaches zero while acceleration is high—this is the mathematical definition of a turning point.
Multi-Armed Bandit AI: Four distinct pivot detection strategies (Fast, Balanced, Strict, Tensor) run simultaneously in shadow portfolios. A Thompson Sampling reinforcement learning algorithm continuously evaluates which strategy performs best in current market conditions and automatically selects it.
Hive Consensus System: When 3 or 4 of the parallel strategies agree on the same price zone, the system generates "confluence zones"—areas of institutional-grade probability.
Dynamic Volatility Scaling (DVS): All parameters auto-adjust based on current ATR relative to historical average, making the indicator adaptive across all timeframes and instruments without manual re-optimization.
II. HOW THE COMPONENTS WORK TOGETHER
This is NOT a simple mashup —each subsystem feeds data into the others in a closed-loop learning architecture:
The Processing Pipeline:
Step 1: Geometric Foundation
Raw price is normalized against a 50-period SMA to create a trajectory baseline
A Zero-Lag EMA smooths the trajectory while preserving edge response
Kalman filter removes noise while maintaining signal integrity
Step 2: Calculus Layer
First derivative (y') measures velocity of price movement
Second derivative (y'') measures acceleration (rate of velocity change)
Curvature (κ) is calculated from these derivatives, representing how sharply price is turning
Step 3: Statistical Validation
Z-Score measures how many standard deviations current price deviates from the Kalman-filtered "true price"
Only pivots with Z-Score > threshold (default 1.2) are considered statistically significant
This filters out noise and micro-fluctuations
Step 4: Tensor Construction
Curvature is combined with volatility (ATR-based) and momentum (ROC-based) to create a multidimensional "tensor score"
This tensor represents the geometric stress in the price field
High tensor magnitude = high probability of structural failure (reversal)
Step 5: AI Decision Layer
All 4 bandit strategies evaluate current conditions using different sensitivity thresholds
Each strategy maintains a virtual portfolio that trades its signals in real-time
Thompson Sampling algorithm updates Bayesian priors (alpha/beta distributions) based on each strategy's Sharpe ratio, win rate, and drawdown
The highest-performing strategy's signals are displayed to the user
Step 6: Confluence Aggregation
When multiple strategies agree on the same price zone, that zone is highlighted as a confluence area. These represent "hive mind" consensus—the strongest setups
Why This Integration Matters:
Traditional indicators either detect pivots too late (lagging) or generate too many false signals (noisy). By requiring geometric confirmation (curvature), statistical significance (Z-Score), multi-strategy agreement (hive voting), and performance validation (RL feedback) , this system achieves institutional-grade precision. The reinforcement learning layer ensures the system adapts as market regimes change, rather than degrading over time like static algorithms.
III. DETAILED METHODOLOGY
A. Curvature Calculation (Differential Geometry)
The system models price as a parametric curve where:
x-axis = time (bar index)
y-axis = normalized price
The curvature at any point represents how quickly the direction of the tangent line is changing. High curvature = sharp turn = potential pivot.
Implementation:
Lookback window (default 8 bars) defines the local curve segment
Smoothing (default 5 bars) applies adaptive EMA to reduce tick noise
Curvature is normalized to 0-1 scale using local statistical bounds (mean ± 2 standard deviations)
B. Ghost Vertex (Predictive Pivot Detection)
Classical pivot detection waits for price to form a swing high/low and confirm. Ghost Vertex uses calculus to predict the turning point:
Conditions for Ghost Pivot:
Velocity (y') ≈ 0 (price rate of change approaching zero)
Acceleration (y'') ≠ 0 (change is decelerating/accelerating)
Z-Score > threshold (statistically abnormal position)
This allows detection 1-3 bars before the actual high/low prints, providing an early entry edge.
C. Multi-Armed Bandit Reinforcement Learning
The system runs 4 parallel "bandits" (agents), each with different detection sensitivity:
Bandit Strategies:
Fast: Low curvature threshold (0.1), low Z-Score requirement (1.0) → High frequency, more signals
Balanced: Standard thresholds (0.2 curvature, 1.5 Z-Score) → Moderate frequency
Strict: High thresholds (0.4 curvature, 2.0 Z-Score) → Low frequency, high conviction
Tensor: Requires tensor magnitude > 0.5 → Geometric-weighted detection
Learning Algorithm (Thompson Sampling):
Each bandit maintains a Beta distribution with parameters (α, β)
After each trade outcome, α is incremented for wins, β for losses
Selection probability is proportional to sampled success rate from the distribution
This naturally balances exploration (trying underperformed strategies) vs exploitation (using best strategy)
Performance Metrics Tracked:
Equity curve for each shadow portfolio
Win rate percentage
Sharpe ratio (risk-adjusted returns)
Maximum drawdown
Total trades executed
The system displays all metrics in real-time on the dashboard so users can see which strategy is currently "winning."
D. Dynamic Volatility Scaling (DVS)
Markets cycle between high volatility (trending, news-driven) and low volatility (ranging, quiet). Static parameters fail when regime changes.
DVS Solution:
Measures current ATR(30) / close as normalized volatility
Compares to 100-bar SMA of normalized volatility
Ratio > 1 = high volatility → lengthen lookbacks, raise thresholds (prevent noise)
Ratio < 1 = low volatility → shorten lookbacks, lower thresholds (maintain sensitivity)
This single feature is why the indicator works on 1-minute crypto charts AND daily stock charts without parameter changes.
E. Confluence Zone Detection
The script divides the recent price range (200 bars) into 200 discrete zones. On each bar:
Each of the 4 bandits votes on potential pivot zones
Votes accumulate in a histogram array
Zones with ≥ 3 votes (75% agreement) are drawn as colored boxes
Red boxes = resistance confluence, Green boxes = support confluence
These zones act as magnet levels where price often returns multiple times.
IV. HOW TO USE THIS INDICATOR
For Scalpers (1m - 5m timeframes):
Settings: Use "Aggressive" or "Adaptive" pivot mode, Curvature Window 5-8, Min Pivot Strength 50-60
Entry Signal: Triangle marker appears (🔺 for longs, 🔻 for shorts)
Confirmation: Check that Hive Sentiment on dashboard agrees (3+ votes)
Stop Loss: Use the dotted volatility-adjusted target line in reverse (if pivot is at 100 with target at 110, stop is ~95)
Take Profit: Use the projected target line (default 3× ATR)
Advanced: Wait for confluence zone formation, then enter on retest of the zone
For Day Traders (15m - 1H timeframes):
Settings: Use "Adaptive" mode (default settings work well)
Entry Signal: Pivot marker + Hive Consensus alert
Confirmation: Check dashboard—ensure selected bandit has Sharpe > 1.5 and Win% > 55%
Filter: Only take pivots with Pivot Strength > 70 (shown in dashboard)
Risk Management: Monitor the Live Position Tracker—if your selected bandit is holding a position, consider that as market structure context
Exit: Either use target lines OR exit when opposite pivot appears
For Swing Traders (4H - Daily timeframes):
Settings: Use "Conservative" mode, Curvature Window 12-20, Min Bars Between Pivots 15-30
Focus on Confluence: Only trade when 4/4 bandits agree (unanimous hive consensus)
Entry: Set limit orders at confluence zones rather than market orders at pivot signals
Confirmation: Look for breakout diamonds (◆) after pivot—these signal momentum continuation
Risk Management: Use wider stops (base stop loss % = 3-5%)
Dashboard Interpretation:
Top Section (Real-Time Metrics):
κ (Curv): Current curvature. >0.6 = active pivot forming
Tensor: Geometric stress. Positive = bullish bias, Negative = bearish bias
Z-Score: Statistical deviation. >2.0 or <-2.0 = extreme outlier (strong signal)
Bandit Performance Table:
α/β: Bayesian parameters. Higher α = more wins in history
Win%: Self-explanatory. >60% is excellent
Sharpe: Risk-adjusted returns. >2.0 is institutional-grade
Status: Shows which strategy is currently selected
Live Position Tracker:
Shows if the selected bandit's shadow portfolio is currently holding a position
Displays entry price and real-time P&L
Use this as "what the AI would do" confirmation
Hive Sentiment:
Shows vote distribution across all 4 bandits
"BULLISH" with 3+ green votes = high-conviction long setup
"BEARISH" with 3+ red votes = high-conviction short setup
Alert Setup:
The script includes 6 alert conditions:
"AI High Pivot" = Selected bandit signals short
"AI Low Pivot" = Selected bandit signals long
"Hive Consensus BUY" = 3+ bandits agree on long
"Hive Consensus SELL" = 3+ bandits agree on short
"Breakout Up" = Resistance breakout (continuation long)
"Breakdown Down" = Support breakdown (continuation short)
Recommended Alert Strategy:
Set "Hive Consensus" alerts for high-conviction setups
Use "AI Pivot" alerts for active monitoring during your trading session
Use breakout alerts for momentum/trend-following entries
V. PARAMETER OPTIMIZATION GUIDE
Core Geometry Parameters:
Curvature Window (default 8):
Lower (3-5): Detects micro-structure, best for scalping volatile pairs (crypto, forex majors)
Higher (12-20): Detects macro-structure, best for swing trading stocks/indices
Rule of thumb: Set to ~0.5% of your typical trade duration in bars
Curvature Smoothing (default 5):
Increase if you see too many false pivots (noisy instrument)
Decrease if pivots lag (missing entries by 2-3 bars)
Inflection Threshold (default 0.20):
This is advanced. Lower = more inflection zones highlighted
Useful for identifying order blocks and liquidity voids
Most users can leave default
Pivot Detection Parameters:
Pivot Sensitivity Mode:
Aggressive: Use in low-volatility range-bound markets
Normal: General purpose
Adaptive: Recommended—auto-adjusts via DVS
Conservative: Use in choppy, whipsaw conditions or for swing trading
Min Bars Between Pivots (default 8):
THIS IS CRITICAL for visual clarity
If chart looks cluttered, increase to 12-15
If missing pivots, decrease to 5-6
Match to your timeframe: 1m charts use 3-5, Daily charts use 20+
Min Z-Score (default 1.2):
Statistical filter. Higher = fewer but stronger signals
During news events (NFP, FOMC), increase to 2.0+
In calm markets, 1.0 works well
Min Pivot Strength (default 60):
Composite quality score (0-100)
80+ = institutional-grade pivots only
50-70 = balanced
Below 50 = will show weak setups (not recommended)
RL & DVS Parameters:
Enable DVS (default ON):
Leave enabled unless you want to manually tune for a specific market condition
This is the "secret sauce" for cross-timeframe performance
DVS Sensitivity (default 1.0):
Increase to 1.5-2.0 for extremely volatile instruments (meme stocks, altcoins)
Decrease to 0.5-0.7 for stable instruments (utilities, bonds)
RL Algorithm (default Thompson Sampling):
Thompson Sampling: Best for non-stationary markets (recommended)
UCB1: Best for stable, mean-reverting markets
Epsilon-Greedy: For testing only
Contextual: Advanced—uses market regime as context
Risk Parameters:
Base Stop Loss % (default 2.0):
Set to 1.5-2× your instrument's average ATR as a percentage
Example: If SPY ATR = $3 and price = $450, ATR% = 0.67%, so use 1.5-2.0%
Base Take Profit % (default 4.0):
Aim for 2:1 reward/risk ratio minimum
For mean-reversion strategies, use 1.5-2.0%
For trend-following, use 3-5%
VI. UNDERSTANDING THE UNDERLYING CONCEPTS
Why Differential Geometry?
Traditional technical analysis treats price as discrete data points. Differential geometry models price as a continuous manifold —a smooth surface that can be analyzed using calculus. This allows us to ask: "At what rate is the trend changing?" rather than just "Is price going up or down?"
The curvature metric captures something fundamental: inflection points in market psychology . When buyers exhaust and sellers take over (or vice versa), the price trajectory must curve. By measuring this curvature mathematically, we detect these psychological shifts with precision.
Why Reinforcement Learning?
Markets are non-stationary —statistical properties change over time. A strategy that works in Q1 may fail in Q3. Traditional indicators have fixed parameters and degrade over time.
The multi-armed bandit framework solves this by:
Running multiple strategies in parallel (diversification)
Continuously measuring performance (feedback loop)
Automatically shifting capital to what's working (adaptation)
This is how professional hedge funds operate—they don't use one strategy, they use ensembles with dynamic allocation.
Why Kalman Filtering?
Raw price contains two components: signal (true movement) and noise (random fluctuations). Kalman filters are the gold standard in aerospace and robotics for extracting signal from noisy sensors.
By applying this to price data, we get a "clean" trajectory to measure curvature against. This prevents false pivots from bid-ask bounce or single-print anomalies.
Why Z-Score Validation?
Not all high-curvature points are tradeable. A sharp turn in a ranging market might just be noise. Z-Score ensures that pivots occur at statistically abnormal price levels —places where price has deviated significantly from its Kalman-filtered "fair value."
This filters out 70-80% of false signals while preserving true reversal points.
VII. COMMON USE CASES & STRATEGIES
Strategy 1: Confluence Zone Reversal Trading
Wait for confluence zone to form (red or green box)
Wait for price to approach zone
Enter when pivot marker appears WITHIN the confluence zone
Stop: Beyond the zone
Target: Opposite confluence zone or 3× ATR
Strategy 2: Hive Consensus Scalping
Set alert for "Hive Consensus BUY/SELL"
When alert fires, check dashboard—ensure 3-4 votes
Enter immediately (market order or 1-tick limit)
Stop: Tight, 1-1.5× ATR
Target: 2× ATR or opposite pivot signal
Strategy 3: Bandit-Following Swing Trading
On Daily timeframe, monitor which bandit has best Sharpe ratio over 30+ days
Take ONLY that bandit's signals (ignore others)
Enter on pivot, hold until opposite pivot or target line
Position size based on bandit's current win rate (higher win% = larger position)
Strategy 4: Breakout Confirmation
Identify key support/resistance level manually
Wait for pivot to form AT that level
If price breaks level and diamond breakout marker appears, enter in breakout direction
This combines support/resistance with geometric confirmation
Strategy 5: Inflection Zone Limit Orders
Enable "Show Inflection Zones"
Place limit buy orders at bottom of purple zones
Place limit sell orders at top of purple zones
These zones represent structural change points where price often pauses
VIII. WHAT THIS INDICATOR DOES NOT DO
To set proper expectations:
This is NOT:
A "holy grail" with 100% win rate
A strategy that works without risk management
A replacement for understanding market fundamentals
A signal copier (you must interpret context)
This DOES NOT:
Predict black swan events
Account for fundamental news (you must avoid trading during major news if not experienced)
Work well in extremely low liquidity conditions (penny stocks, microcap crypto)
Generate signals during consolidation (by design—prevents whipsaw)
Best Performance:
Liquid instruments (SPY, ES, NQ, EUR/USD, BTC/USD, etc.)
Clear trend or range conditions (struggles in choppy transition periods)
Timeframes 5m and above (1m can work but requires experience)
IX. PERFORMANCE EXPECTATIONS
Based on shadow portfolio backtesting across multiple instruments:
Conservative Mode:
Signal frequency: 2-5 per week (Daily charts)
Expected win rate: 60-70%
Average RRR: 2.5:1
Adaptive Mode:
Signal frequency: 5-15 per day (15m charts)
Expected win rate: 55-65%
Average RRR: 2:1
Aggressive Mode:
Signal frequency: 20-40 per day (5m charts)
Expected win rate: 50-60%
Average RRR: 1.5:1
Note: These are statistical expectations. Individual results depend on execution, risk management, and market conditions.
X. PRIVACY & INVITE-ONLY NATURE
This script is invite-only to:
Maintain signal quality (prevent market impact from mass adoption)
Provide dedicated support to users
Continuously improve the algorithm based on user feedback
Ensure users understand the complexity before deploying real capital
The script is closed-source to protect proprietary research in:
Ghost Vertex prediction mathematics
Tensor construction methodology
Bandit reward function design
DVS scaling algorithms
XI. FINAL RECOMMENDATIONS
Before Trading Live:
Paper trade for minimum 2 weeks to understand signal timing
Start with ONE timeframe and master it before adding others
Monitor the dashboard —if selected bandit Sharpe drops below 1.0, reduce size
Use confluence and hive consensus for highest-quality setups
Respect the Min Bars Between Pivots setting —this prevents overtrading
Risk Management Rules:
Never risk more than 1-2% of account per trade
If 3 consecutive losses occur, stop trading and review (possible regime change)
Use the shadow portfolio as a guide—if ALL bandits are losing, market is in transition
Combine with other analysis (order flow, volume profile) for best results
Continuous Learning:
The RL system improves over time, but only if you:
Keep the indicator running (it learns from bar data)
Don't constantly change parameters (confuses the learning)
Let it accumulate at least 50 samples before judging performance
Review the dashboard weekly to see which bandits are adapting
CONCLUSION
Curvature Tensor Pivots - HIVE represents a fusion of advanced mathematics, machine learning, and practical trading experience. It is designed for serious traders who want institutional-grade tools and understand that edge comes from superior methodology, not magic formulas.
The system's strength lies in its adaptive intelligence —it doesn't just detect pivots, it learns which detection method works best right now, in this market, under these conditions. The hive consensus mechanism provides confidence, the geometric foundation provides precision, and the reinforcement learning provides evolution.
Use it wisely, manage risk properly, and let the mathematics work for you.
Disclaimer: This indicator is a tool for analysis and does not constitute financial advice. Past performance of shadow portfolios does not guarantee future results. Trading involves substantial risk of loss. Always perform your own due diligence and never trade with capital you cannot afford to lose.
Taking you to school. — Dskyz, Trade with insight. Trade with anticipation.

GCM Heikin Ashi with PivotsTitle: GCM Heikin Ashi with Pivots
Description:
Overview
This indicator provides a powerful combination of trend visualization, precise reversal signals, and volume confirmation in a clean, customizable sub-chart. It is designed to help traders identify trend momentum using Heikin Ashi candles, pinpoint confirmed swing highs and lows (pivots), and spot surges in buying pressure with our unique Volume Rate-of-Change (VROC) highlighter.
The key feature of this script is its non-repainting pivot signals. A pivot high or low is only confirmed and plotted after a specific number of subsequent bars have closed, ensuring the signals are reliable and do not change after they appear.
Key Features
Heikin Ashi Sub-Chart: Displays smoothed Heikin Ashi candles in a separate pane to clearly visualize trend strength and direction without cluttering the main price chart.
Non-Repainting Pivot Signals: Uses ta.pivothigh and ta.pivotlow to identify confirmed swing points. The signals will not repaint or move once they are printed on the chart.
Smart Volume Spike Analysis (VROC): A Heikin Ashi candle will be highlighted in a distinct bright green (#2dff00) when the volume increases significantly on a bullish price candle. This "volume-confirmed" candle can signal strong conviction behind a move.
Complete Label Customization: Take full control over the look and feel of your signals:
Label Mode: Choose between "High & Low" (H/L) or "Buy & Sell" (B/S) to match your trading terminology.
Custom Colors: Set unique colors for both the high and low pivot labels.
Label Style: Select from various shapes like boxes, circles, diamonds, or squares.
Label Size: Adjust the size of the labels from Tiny to Huge for perfect visibility.
Adjustable Pivot Sensitivity: Fine-tune the pivot detection algorithm by setting the number of bars required to the left (strength) and right (confirmation) of a pivot point.
How to Use & Interpret the Signals
Assess the Trend with Heikin Ashi:
A series of green HA candles with little to no lower wicks indicates strong bullish momentum.
A series of red HA candles with little to no upper wicks indicates strong bearish momentum.
Look for Volume Confirmation:
A bright green highlighted candle signals a surge in buying pressure (VROC spike). This adds significant weight to bullish moves and can act as a leading indicator for a new leg up.
Identify Entry/Exit Points with Pivot Labels:
An "L" or "B" label marks a confirmed swing low. This is a potential buying opportunity, especially if it is followed by green Heikin Ashi candles and, ideally, a bright green VROC spike candle.
An "H" or "S" label marks a confirmed swing high. This is a potential selling/shorting opportunity, especially as HA candles turn red.
Example Strategy (High-Confluence)
A powerful way to use this indicator is to look for a sequence of events:
Wait for a "Buy" (B) or "Low" (L) signal to appear, confirming a bottom has likely formed.
Wait for the first bright green VROC spike candle to appear after the signal. This confirms that buyers are stepping in with conviction.
Consider an entry based on this high-confluence setup, using the swing low as a potential stop-loss area.
Settings Explained
Pivot Detection:
Left Bars (Strength): Number of bars to the left of a pivot. A higher number finds more significant pivots.
Right Bars (Confirmation): Number of bars to the right required to confirm a pivot. This creates a lag for reliability.
Volume Spike Detection (VROC):
Enable Volume Spike Highlighting: Turn the bright green candle highlight on or off.
VROC Length: The lookback period for calculating the volume's rate of change.
VROC Threshold %: The percentage volume must increase to trigger a highlight.
Label Customization:
Label Text Mode: Choose between "High & Low" or "Buy & Sell".
Label Color, Style, and Size: Full cosmetic control for the pivot labels.
Final Note
This indicator is a tool to aid in technical analysis and should not be used as a standalone trading system. Always use it in conjunction with other analysis methods, proper risk management, and a sound trading plan.
Enjoy!
poopivs [ULTIMATE PIVOT HIGHS AND LOWS]Big thanks to @LudaCode for the missing pivots script. Carried my dumpy trucky badoinkadoink.
This is an elevated pivot script that follows the 3 candle pivot rule (strictly) and does not miss pivots like williams fractals.
Missing pivots marked by transparent circles are derived pivots, giving you a higher resolution for price action.
Colored bars show potential problem areas for pivots (drawing zigzags in particular) and indicate a pivot high and low on the same candle.
Will potentially upgrade this script to include auto zig zags, trend, and intermediate highs and lows finder.
Let me know if you have any suggestions ideas in the comments.
Best,
P
