Change in State of Delivery CISD [AlgoAlpha]🟠 OVERVIEW
This script tracks how price “changes delivery” after failed attempts to push in one direction. It builds swing levels from pivots, watches for those levels to be wicked, and then checks if price delivers cleanly in the opposite direction. When the pattern meets the script’s tolerance rules, it marks a Change in State of Delivery (CISD). These CISD levels are drawn as origin lines and are used to spot shifts in intent, failed pushes, and continuation attempts. A CISD becomes stronger when it forms after opposing liquidity is swept within a defined lookback.
🟠 CONCEPTS
The script first defines structure using swing highs/lows. These levels act as potential liquidity points. When price wicks through a swing, the script registers a mitigation event. After this, it looks for a reversal-style candle sequence: a failed push, followed by a counter-move strong enough to pass a tolerance ratio. This ratio compares how far price expanded away from the failed attempt versus the counter-move that followed. If the ratio is high enough, this becomes a CISD. The idea is simple: liquidity interaction sets context , and the tolerance logic identifies actual intent . CISD levels and sweep markers combine these two ideas into a clean map of where delivery flipped.
🟠 FEATURES
Liquidity tracking: marks swing highs/lows and updates them until expiry
Liquidity sweep confirmation when CISD aligns with recent mitigations
Alert conditions for all key events: mitigations, CISDs, and strong CISDs
🟠 USAGE
Setup : Add the script to your chart. Use it on any timeframe where swing behavior matters. Set the Swing Period for how wide a pivot must be. Set Noise Filter to control how strict the CISD detection is. Liquidity Lookback defines how recent a wick must be to confirm a sweep.
Read the chart : Origin lines mark where the CISD began. A green line signals bullish intent; a red line signals bearish intent. ▲ and ▼ shapes show CISDs that form after liquidity is swept, these mark strong signals for potential entry. Swing dots show recent swing highs/lows. Candle colors follow the latest CISD trend.
Settings that matter : Increasing Swing Period produces fewer but stronger swings. Raising Noise Filter requires cleaner counter-moves and reduces false CISDs. Liquidity Lookback controls how strict the sweep confirmation is. Expiry Bars decides how long swing levels remain active.
In den Scripts nach "entry" suchen

Smart Cloud by Ilker (Custom Matriks)A Proprietary Hybrid Trend System for All Major Financial Assets
This indicator, originally developed for the Matriks platform, is a highly effective hybrid trend identification system designed for day-to-day analysis across all major asset classes, including Stocks, Forex, Indices, and Cryptocurrencies. It combines the forward-looking principle of the Ichimoku Kinko Hyo Cloud with heavily smoothed Moving Averages (MAs) to create a clear, visually guided trading signal. (Daily Timeframe recommended for optimal results).
📊 Algorithmic Structure and Parameters
The "Smart Cloud" utilizes six primary user-adjustable parameters that govern its sensitivity and shape, moving away from standard Ichimoku settings to provide a robust, customized trend view:
P1, P2, P3 (60, 56, 248): These long-term settings define the core structure and width of the cloud, acting as the primary dynamic support and resistance zone. The significantly longer P3 (Lagging Period) ensures the cloud reflects strong, deep market cycles.
P4 (Displacement 26): Maintains the traditional Ichimoku principle of projecting the cloud 26 periods forward to provide a predictive view of future trend support/resistance.
P5 (MA50 - Blue) & P6 (MA10 - Purple): These are the two primary Moving Averages plotted inside the cloud. They serve as fast-response momentum lines:
P5 (MA50): Represents the middle-term trend average.
P6 (MA10): Represents the short-term market momentum.
📈 Core Trend and Signal Interpretation
The indicator provides powerful trend identification based on three key components:
The Cloud (Kumo):
Green Cloud (Bullish): Indicates the dominant trend is up, suggesting dynamic support for price action.
Red Cloud (Bearish): Indicates the dominant trend is down, suggesting dynamic resistance.
The thickness and slope of the cloud are key indicators of trend strength.
MA Crossover Signal (Blue/Purple):
Buy Signal: When the faster Purple MA (P6=10) crosses above the slower Blue MA (P5=50).
Sell Signal: When the faster Purple MA (P6=10) crosses below the slower Blue MA (P5=50).
Price Action & Confirmation:
The most powerful signals occur when a MA Crossover is confirmed by price breaking out of the cloud in the same direction.
Price above the cloud and MA crossover to the upside suggests a strong buy entry.
Disclaimer: This tool is intended for analysis and decision-making support. It is not financial advice. Always use stop-loss orders and manage your risk accordingly.

Hash Momentum IndicatorHash Momentum Indicator
Overview
The Hash Momentum Indicator provides real-time momentum-based trading signals with visual entry/exit markers and automatic risk management levels. This is the indicator version of the popular Hash Momentum Strategy, designed for traders who want signal alerts without backtesting functionality.
Perfect for: Live trading, automation via alerts, multi-indicator setups, and clean chart visualization.
What Makes This Indicator Special
1. Pure Momentum-Based Signals
Captures price acceleration in real-time - not lagging moving average crossovers. Enters when momentum exceeds a dynamic ATR-based threshold, catching moves as they begin accelerating.
2. Automatic Risk Management Visualization
Every signal automatically displays:
Entry level (white dashed line)
Stop loss level (red line)
Take profit target (green line)
Partial TP levels (dotted green lines)
3. Smart Trade Management
Trade Cooldown: Prevents overtrading by enforcing waiting period between signals
EMA Trend Filter: Only trades with the trend (optional)
Session Filters: Trade only during Tokyo/London/New York sessions (optional)
Weekend Toggle: Avoid low-liquidity weekend periods (optional)
4. Clean Visual Design
🟢 Tiny green dot = Long entry signal
🔴 Tiny red dot = Short entry signal
🔵 Blue X = Long exit
🟠 Orange X = Short exit
No cluttered labels or dashboard - just clean signals
5. Professional Alerts Ready
Set up TradingView alerts for:
Long signals
Short signals
Long exits
Short exits
How It Works
Step 1: Calculate Momentum
Momentum = Current Price - Price
Normalized by standard deviation for consistency
Must exceed ATR × Threshold to trigger
Step 2: Confirm Acceleration
Momentum must be increasing (positive momentum change)
Price must be moving in signal direction
Step 3: Apply Filters
EMA Filter: Long only above EMA, short only below EMA (if enabled)
Session Filter: Check if in allowed trading session (if enabled)
Weekend Filter: Block signals on Sat/Sun (if enabled)
Cooldown: Ensure minimum bars passed since last signal
Step 4: Generate Signal
All conditions met = Entry signal fires
Lines automatically drawn for entry, stop, and targets
Step 5: Exit Detection
Opposite momentum detected = Exit signal
Stop loss or take profit hit = Exit signal
Lines removed from chart
⚙️ Settings Guide
Core Strategy
Momentum Length (Default: 13)
Number of bars for momentum calculation. Higher values = stronger signals but fewer trades.
Aggressive: 10
Balanced: 13
Conservative: 18-24
Momentum Threshold (Default: 2.25)
ATR multiplier for signal generation. Higher values = only trade the biggest momentum moves.
Aggressive: 2.0
Balanced: 2.25
Conservative: 2.5-3.0
Risk:Reward Ratio (Default: 2.5)
Your target profit as a multiple of your risk. With 2.2% stop and 2.5 R:R, your target is 5.5% profit.
Conservative: 3.0+ (need 25% win rate to profit)
Balanced: 2.5 (need 29% win rate to profit)
Aggressive: 2.0 (need 33% win rate to profit)

The Bear & Bull TieWhat it does:
Bear & Bull Tie is a moving average crossover indicator that identifies trend reversals and generates entry/exit signals based on the relationship between price and three simple moving averages (SMA 21, SMA 55, SMA 89). The indicator combines these three MAs into an Average Moving Average (AMA) to confirm directional bias, then uses ATR (Average True Range) volatility measurement for dynamic position sizing and stop-loss placement.
How it works:
The indicator operates on a simple but effective principle: it enters a bullish trend when price closes above all three moving averages simultaneously, and enters a bearish trend when price closes below all three MAs simultaneously. This "three MA alignment" approach filters out noise and confirms genuine trend changes. The indicator then plots:
Entry levels at the highest MA during uptrends or lowest MA during downtrends
Stop-loss zones calculated using 2x ATR distance from entry prices
Trend confirmation fill between price and the Average Moving Average, color-coded blue for bullish and red for bearish
The ATR-based stop-loss sizing adapts to market volatility, making it suitable for different market conditions and timeframes.
How to use it:
Monitor the filled zones to visually confirm your trend bias
Watch for alerts when new long or short setups form; entry prices and ATR-based stops are displayed on the chart
Trade the zones between your entry level and stop-loss zone, adjusting position size based on your risk tolerance
Exit when colors reverse to indicate trend termination
The indicator works best on higher timeframes (1H and above) where trend clarity is stronger and false signals are reduced.
Alerts: FOR AUTOMATION / NOTIFICATION's (create an alert for B/B tie (2, 4) that uses Any Alert / Function Call )
Long Positions:
entries ---> "Bull Tie on NVDA | Entry : 100.5 | ATR Stop : 99.5"
exits ------> "Bull Tie on NVDA | Exit : 110.1"
Short Positions:
entries ---> "Bear Tie on NVDA | Entry : 120.05 | ATR Stop : 85.05"
exits -----> "Bear Tie on NVDA | Exit : 100"
Credits:
This script incorporates concepts and code portions from @LOKEN94 with his explicit permission. Special thanks for the foundational logic that inspired this development.
Disclaimer:
This indicator is for educational and analytical purposes. It is not financial advice. Past performance does not guarantee future results. Always manage risk properly and use stops. Test thoroughly on historical data before live trading.

MTF Checklist DashboardMTF Checklist Dashboard
Overview
The MTF Checklist Dashboard is an advanced multi-timeframe analysis tool that provides traders with a comprehensive visual dashboard to analyze market conditions across six customizable timeframes simultaneously. This indicator combines multiple technical analysis methods, including Opening Range Breakouts (ORB), VWAP, EMAs, and daily price levels, to generate high-probability confluence-based trading signals.
Unlike traditional single-timeframe indicators, this dashboard displays all critical information in one organized table, allowing traders to instantly identify when multiple timeframes align for optimal entry and exit opportunities.
Key Features
Multi-Timeframe Analysis
Analyzes up to 6 timeframes simultaneously (default: 1m, 5m, 15m, 30m, 1h, 4h)
Fully customizable timeframe selection via comma-separated input
Color-coded cells for instant visual recognition (green=bullish, red=bearish, yellow=neutral)
Technical Indicators Tracked
Current and previous candle direction
Opening Range Breakout (ORB) positioning with custom period
VWAP relationship (above/below)
200 EMA positioning
Daily and previous day high/low proximity
EMA crossovers (9 vs 21, both vs 200)
Advanced Signal Filtering System
Confluence scoring: Requires multiple timeframes to align (3-6 timeframes)
Higher timeframe confirmation: Ensures 30m/1h/4h agreement
Volume filter: Confirms signals with above-average volume (1.5x default)
ATR volatility filter: Validates sufficient market movement
Session timing: Restricts signals to optimal trading hours (EST)
Momentum confirmation: Requires recent directional strength
Range positioning: Blocks signals near daily extremes
Candle strength: Validates strong directional candles (60%+ body ratio)
Visual Signals
Optional entry arrows (above/below bars)
Background color highlighting
Organized dashboard with real-time price levels
ORB range, current day, and previous day summary rows
Alert Conditions
JSON-formatted alerts for automated trading integration
Separate alerts for long entry, short entry, long exit, and short exit
Compatible with webhook automation systems
How To Use
Dashboard Interpretation
The dashboard displays a color-coded table with the following columns:
TF: Timeframe being analyzed
C: Current candle (Green=bullish, Red=bearish)
P: Previous candle (Green=bullish, Red=bearish)
ORB: Opening Range Breakout position (A=Above, B=Below, W=Within)
VWAP: Price vs VWAP (A=Above, B=Below)
E200: Price vs 200 EMA (A=Above, B=Below)
D Hi/Lo: Proximity to current day high/low (Hi/Lo/Mid)
PD Hi/Lo: Proximity to previous day high/low (Hi/Lo/Mid)
9 vs 21: EMA 9 vs EMA 21 relationship (A=9 above 21, B=9 below 21)
9&21 v200: Both EMAs vs 200 EMA (>>=both above, <<=both below, <>=mixed)
Signal Generation
Long Entry Signal triggers when:
Minimum number of timeframes show bullish alignment (default: 5 of 6)
Higher timeframes (30m/1h/4h) confirm direction (default: 2 of 3)
Price breaks above ORB high with sufficient distance
Volume exceeds average by specified multiplier
ATR shows adequate volatility
Trade occurs during optimal session hours
Recent momentum is upward
Price not too close to daily high
Strong bullish candle forms
Short Entry Signal uses opposite conditions
Exit Signals trigger when opposing timeframe confluence reaches threshold (default: 3 timeframes)
Recommended Workflow
Select your asset and primary trading timeframe
Observe the dashboard - Look for rows showing mostly green (bullish) or red (bearish)
Wait for alignment - The indicator will show arrows when confluence requirements are met
Check the bottom rows - Review ORB levels and daily ranges for context
Set alerts - Enable TradingView alerts using the built-in alert conditions
Manage risk - Use appropriate position sizing and stop losses based on ORB range or daily ATR
Settings Guide
Basic Settings
Timeframes: Enter comma-separated values (e.g., "1,5,15,30,60,240")
Show Header: Toggle column headers on/off
ORB Minutes: Set opening range period (default: 15 minutes)
Near % for daily highs/lows: Define proximity threshold (default: 0.20%)
Use close for comparisons: Compare using close vs current price
Dashboard Position: Choose from 9 screen positions
Confluence Filters
Minimum Timeframes Aligned: Set required confluence (3-6, default: 5)
Require Higher Timeframe Confirmation: Toggle HTF requirement on/off
Min Higher Timeframes: Specify HTF agreement needed (1-3, default: 2)
Volume Filter
Volume Confirmation: Enable/disable volume filtering
Volume vs Average: Set multiplier threshold (default: 1.5x)
Volume Average Length: Period for volume average (default: 20 bars)
Volatility Filter (ATR)
Volatility Filter: Enable/disable ATR confirmation
ATR Length: Calculation period (default: 14)
Min ATR vs Average: Required ATR level (default: 0.5x = 50%)
ORB Filters
ORB Breakout Distance Required: Toggle distance requirement
Min Breakout % Beyond ORB: Additional breakout threshold (default: 0.10%)
Session Filter
Trade Only During Best Hours: Enable time-based filtering
Session 1: First trading window (default: 0930-1130 EST)
Session 2: Second trading window (default: 1400-1530 EST)
Momentum Filter
Recent Momentum Required: Enable directional momentum check
Lookback Bars: Period for momentum comparison (default: 3 bars)
Daily Range Filter
Block Signals Near Daily Extremes: Prevent entries at extremes
Distance from High/Low %: Minimum distance required (default: 2.0%)
Candle Filter
Strong Directional Candle: Require candle strength
Min Candle Body %: Body-to-range ratio threshold (default: 60%)
Visual Signals
Show Entry Signals: Master toggle for visual signals
Show Arrows: Display entry arrows on chart
Background Color: Enable background highlighting
Best Practices
Start with default settings and adjust based on your trading style and asset volatility
Higher confluence requirements (5-6 timeframes) produce fewer but higher-quality signals
Enable all filters for conservative trading; disable some for more frequent signals
Use the dashboard as confirmation alongside your existing trading strategy
Backtest on your specific instruments before live trading
Consider market conditions—trending vs ranging markets may require different settings
Alerts
This indicator includes four alert conditions with JSON formatting for webhook integration:
Long Entry Signal: Triggers when all long conditions are met
Short Entry Signal: Triggers when all short conditions are met
Long Exit Signal: Triggers when opposing confluence reaches exit threshold
Short Exit Signal: Triggers when opposing confluence reaches exit threshold
Alert messages include ticker symbol, action (buy/sell), price, and quantity for automated trading systems.
Important Notes
This indicator works best on liquid instruments with clear price action
Highly volatile markets may require adjusted ATR and ORB distance settings
Session times are in EST timezone—adjust if trading non-US markets
The ORB calculation requires sufficient price history for the day
Signals are generated in real-time but should be confirmed at candle close
Limitations
Maximum of 6 timeframes can be analyzed due to TradingView's security call limits
ORB calculations may not work correctly on instruments with gaps or irregular sessions
The indicator is most effective during regular market hours when volume and volatility are adequate
Lower timeframes (1m, 5m) may produce more false signals in choppy conditions
License
Mozilla Public License 2.0 (MPL-2.0)
This indicator is licensed under the Mozilla Public License 2.0. You are free to use, modify, and distribute this code under the terms of the MPL-2.0. The full license text is available at mozilla.org
Key license provisions:
You may use this code commercially
You may modify and distribute modified versions
Modified versions must be released under the same license
You must include the original license notice in any distributions
No trademark rights are granted
Disclaimer
This indicator is provided for educational and informational purposes only. It is not financial advice, and past performance does not guarantee future results. Trading involves substantial risk of loss. Always:
Practice proper risk management
Test thoroughly on paper/demo accounts before live trading
Use appropriate position sizing
Never risk more than you can afford to lose
Consult with a financial advisor for personalized advice
The creator assumes no liability for trading losses incurred using this indicator.
Version: 2.0
Pine Script Version: v6
Author: © EliasVictor

Volume Pressure and PercentVPP Volume Pressure and Percentage Indicator with a Volume Trendline that indicates which side is driving the flow.
Features:
1. Buy/Sell Pressure Bars (Core Volume Split)
The indicator separates each candle’s volume into buy volume (green) above the zero line and sell volume (red) below it. This gives you a real-time visualization of which side is more aggressive within the current bar. Instead of waiting for prices to move or candles to close, you can instantly see whether buyers or sellers are stepping in.
2. Dynamic Total Volume (Invisible Histogram + Status Line Color)
The total volume of each bar is tracked behind the scenes and displayed in the pinned status line using a dynamic color—green when buyers dominate, red when sellers dominate. The histogram for total volume is invisible to keep the chart clean, but the total volume figure stays visible and changes color based on who is in control. This gives you instant confirmation of whether institutional-sized volume supports the direction shown by the buy/sell pressure, which is especially valuable when evaluating the risk or conviction behind a potential entry.
3. Percentage Mode (% of Bar Volume)
When toggled on, the indicator converts each bar into percent buy vs percent sell, normalizing all flow to a 0–100% scale. This mode is incredibly useful when comparing pressure across different times of day, gaps, or varying volume conditions—such as early morning spikes versus lunchtime chop. By removing absolute volume from the equation, you gain a clean look at the actual imbalance between buyers and sellers.
4. 70% Pressure Band (Imbalance Threshold Zone)
In percentage mode, the indicator displays a subtle 70% band (a light gray zone) above and below the zero line, showing where buy or sell pressure reaches extreme dominance (≥70%). When a bar’s buy or sell percentage enters this zone, it highlights moments of exhaustion, acceleration, or potential reversal. The band acts like a real-time overbought/oversold gauge specifically for volume imbalance, not price.
5. Trend Line (Net Pressure Trend / Reversal Detector)
The trend line smooths out the net volume pressure (buy volume minus sell volume or its percentage equivalent) and shows the overall direction of order flow. When the line slopes upward, buyers are gaining control; when it slopes downward, sellers are taking over. This trend line acts as a real-time momentum indicator based directly on flow rather than price. Because it reacts quickly to intrabar shifts in buy/sell pressure, it often turns before price does—giving you a measurable timing edge.
6. Auto-Selecting Trend Source (Volume Net, Percent Net, or CVD)
The indicator lets you choose how the trend line is calculated: Volume Net (buy minus sell volume), Percent Net (normalized imbalance), or CVD (Cumulative Volume Delta) for long-term flow bias. The default “Auto” mode automatically switches between Volume Net and Percent Net depending on which view you’re using. This flexibility allows the trend line to remain meaningful whether you’re analyzing raw volume or normalized percentage data.
7. Pinned (Status Line) Totals in K/M/B Format
Regardless of whether you’re in volume or percentage mode, the indicator always displays Total Volume, Buy Volume, and Sell Volume in the status line using abbreviated K, M, B formatting. These values update in real time and are color-coded: green for bullish dominance, red for bearish. This gives you a concise snapshot of order flow strength on every bar.
---------------------
How To Use:
Support Level Zones
• Watch for Buy bars increasing + Trend line flipping up right at or slightly below support.
• This often signals absorption — market makers filling large buy orders before reversal.
• Confirmation: Price reclaims VWAP ... enter calls / longs.
Resistance Level Zones
• Watch for Sell bars increasing + Trend line flattening/turning down near resistance.
• This signals distribution or stop runs.
• Confirmation: Price rejects VWAP ... enter puts / shorts.
Breakout Traps
• Sometimes you’ll see price break a level, but the flow doesn’t confirm (buy volume doesn’t expand).
• That’s a false breakout — fade it with options opposite the move.

Algorithm Predator - ML-liteAlgorithm Predator - ML-lite
This indicator combines four specialized trading agents with an adaptive multi-armed bandit selection system to identify high-probability trade setups. It is designed for swing and intraday traders who want systematic signal generation based on institutional order flow patterns , momentum exhaustion , liquidity dynamics , and statistical mean reversion .
Core Architecture
Why These Components Are Combined:
The script addresses a fundamental challenge in algorithmic trading: no single detection method works consistently across all market conditions. By deploying four independent agents and using reinforcement learning algorithms to select or blend their outputs, the system adapts to changing market regimes without manual intervention.
The Four Trading Agents
1. Spoofing Detector Agent 🎭
Detects iceberg orders through persistent volume at similar price levels over 5 bars
Identifies spoofing patterns via asymmetric wick analysis (wicks exceeding 60% of bar range with volume >1.8× average)
Monitors order clustering using simplified Hawkes process intensity tracking (exponential decay model)
Signal Logic: Contrarian—fades false breakouts caused by institutional manipulation
Best Markets: Consolidations, institutional trading windows, low-liquidity hours
2. Exhaustion Detector Agent ⚡
Calculates RSI divergence between price movement and momentum indicator over 5-bar window
Detects VWAP exhaustion (price at 2σ bands with declining volume)
Uses VPIN reversals (volume-based toxic flow dissipation) to identify momentum failure
Signal Logic: Counter-trend—enters when momentum extreme shows weakness
Best Markets: Trending markets reaching climax points, over-extended moves
3. Liquidity Void Detector Agent 💧
Measures Bollinger Band squeeze (width <60% of 50-period average)
Identifies stop hunts via 20-bar high/low penetration with immediate reversal and volume spike
Detects hidden liquidity absorption (volume >2× average with range <0.3× ATR)
Signal Logic: Breakout anticipation—enters after liquidity grab but before main move
Best Markets: Range-bound pre-breakout, volatility compression zones
4. Mean Reversion Agent 📊
Calculates price z-scores relative to 50-period SMA and standard deviation (triggers at ±2σ)
Implements Ornstein-Uhlenbeck process scoring (mean-reverting stochastic model)
Uses entropy analysis to detect algorithmic trading patterns (low entropy <0.25 = high predictability)
Signal Logic: Statistical reversion—enters when price deviates significantly from statistical equilibrium
Best Markets: Range-bound, low-volatility, algorithmically-dominated instruments
Adaptive Selection: Multi-Armed Bandit System
The script implements four reinforcement learning algorithms to dynamically select or blend agents based on performance:
Thompson Sampling (Default - Recommended):
Uses Bayesian inference with beta distributions (tracks alpha/beta parameters per agent)
Balances exploration (trying underused agents) vs. exploitation (using proven winners)
Each agent's win/loss history informs its selection probability
Lite Approximation: Uses pseudo-random sampling from price/volume noise instead of true random number generation
UCB1 (Upper Confidence Bound):
Calculates confidence intervals using: average_reward + sqrt(2 × ln(total_pulls) / agent_pulls)
Deterministic algorithm favoring agents with high uncertainty (potential upside)
More conservative than Thompson Sampling
Epsilon-Greedy:
Exploits best-performing agent (1-ε)% of the time
Explores randomly ε% of the time (default 10%, configurable 1-50%)
Simple, transparent, easily tuned via epsilon parameter
Gradient Bandit:
Uses softmax probability distribution over agent preference weights
Updates weights via gradient ascent based on rewards
Best for Blend mode where all agents contribute
Selection Modes:
Switch Mode: Uses only the selected agent's signal (clean, decisive)
Blend Mode: Combines all agents using exponentially weighted confidence scores controlled by temperature parameter (smooth, diversified)
Lock Agent Feature:
Optional manual override to force one specific agent
Useful after identifying which agent dominates your specific instrument
Only applies in Switch mode
Four choices: Spoofing Detector, Exhaustion Detector, Liquidity Void, Mean Reversion
Memory System
Dual-Layer Architecture:
Short-Term Memory: Stores last 20 trade outcomes per agent (configurable 10-50)
Long-Term Memory: Stores episode averages when short-term reaches transfer threshold (configurable 5-20 bars)
Memory Boost Mechanism: Recent performance modulates agent scores by up to ±20%
Episode Transfer: When an agent accumulates sufficient results, averages are condensed into long-term storage
Persistence: Manual restoration of learned parameters via input fields (alpha, beta, weights, microstructure thresholds)
How Memory Works:
Agent generates signal → outcome tracked after 8 bars (performance horizon)
Result stored in short-term memory (win = 1.0, loss = 0.0)
Short-term average influences agent's future scores (positive feedback loop)
After threshold met (default 10 results), episode averaged into long-term storage
Long-term patterns (weighted 30%) + short-term patterns (weighted 70%) = total memory boost
Market Microstructure Analysis
These advanced metrics quantify institutional order flow dynamics:
Order Flow Toxicity (Simplified VPIN):
Measures buy/sell volume imbalance over 20 bars: |buy_vol - sell_vol| / (buy_vol + sell_vol)
Detects informed trading activity (institutional players with non-public information)
Values >0.4 indicate "toxic flow" (informed traders active)
Lite Approximation: Uses simple open/close heuristic instead of tick-by-tick trade classification
Price Impact Analysis (Simplified Kyle's Lambda):
Measures market impact efficiency: |price_change_10| / sqrt(volume_sum_10)
Low values = large orders with minimal price impact ( stealth accumulation )
High values = retail-dominated moves with high slippage
Lite Approximation: Uses simplified denominator instead of regression-based signed order flow
Market Randomness (Entropy Analysis):
Counts unique price changes over 20 bars / 20
Measures market predictability
High entropy (>0.6) = human-driven, chaotic price action
Low entropy (<0.25) = algorithmic trading dominance (predictable patterns)
Lite Approximation: Simple ratio instead of true Shannon entropy H(X) = -Σ p(x)·log₂(p(x))
Order Clustering (Simplified Hawkes Process):
Tracks self-exciting event intensity (coordinated order activity)
Decays at 0.9× per bar, spikes +1.0 when volume >1.5× average
High intensity (>0.7) indicates clustering (potential spoofing/accumulation)
Lite Approximation: Simple exponential decay instead of full λ(t) = μ + Σ α·exp(-β(t-tᵢ)) with MLE
Signal Generation Process
Multi-Stage Validation:
Stage 1: Agent Scoring
Each agent calculates internal score based on its detection criteria
Scores must exceed agent-specific threshold (adjusted by sensitivity multiplier)
Agent outputs: Signal direction (+1/-1/0) and Confidence level (0.0-1.0)
Stage 2: Memory Boost
Agent scores multiplied by memory boost factor (0.8-1.2 based on recent performance)
Successful agents get amplified, failing agents get dampened
Stage 3: Bandit Selection/Blending
If Adaptive Mode ON:
Switch: Bandit selects single best agent, uses only its signal
Blend: All agents combined using softmax-weighted confidence scores
If Adaptive Mode OFF:
Traditional consensus voting with confidence-squared weighting
Signal fires when consensus exceeds threshold (default 70%)
Stage 4: Confirmation Filter
Raw signal must repeat for consecutive bars (default 3, configurable 2-4)
Minimum confidence threshold: 0.25 (25%) enforced regardless of mode
Trend alignment check: Long signals require trend_score ≥ -2, Short signals require trend_score ≤ 2
Stage 5: Cooldown Enforcement
Minimum bars between signals (default 10, configurable 5-15)
Prevents over-trading during choppy conditions
Stage 6: Performance Tracking
After 8 bars (performance horizon), signal outcome evaluated
Win = price moved in signal direction, Loss = price moved against
Results fed back into memory and bandit statistics
Trading Modes (Presets)
Pre-configured parameter sets:
Conservative: 85% consensus, 4 confirmations, 15-bar cooldown
Expected: 60-70% win rate, 3-8 signals/week
Best for: Swing trading, capital preservation, beginners
Balanced: 70% consensus, 3 confirmations, 10-bar cooldown
Expected: 55-65% win rate, 8-15 signals/week
Best for: Day trading, most traders, general use
Aggressive: 60% consensus, 2 confirmations, 5-bar cooldown
Expected: 50-58% win rate, 15-30 signals/week
Best for: Scalping, high-frequency trading, active management
Elite: 75% consensus, 3 confirmations, 12-bar cooldown
Expected: 58-68% win rate, 5-12 signals/week
Best for: Selective trading, high-conviction setups
Adaptive: 65% consensus, 2 confirmations, 8-bar cooldown
Expected: Varies based on learning
Best for: Experienced users leveraging bandit system
How to Use
1. Initial Setup (5 Minutes):
Select Trading Mode matching your style (start with Balanced)
Enable Adaptive Learning (recommended for automatic agent selection)
Choose Thompson Sampling algorithm (best all-around performance)
Keep Microstructure Metrics enabled for liquid instruments (>100k daily volume)
2. Agent Tuning (Optional):
Adjust Agent Sensitivity multipliers (0.5-2.0):
<0.8 = Highly selective (fewer signals, higher quality)
0.9-1.2 = Balanced (recommended starting point)
1.3 = Aggressive (more signals, lower individual quality)
Monitor dashboard for 20-30 signals to identify dominant agent
If one agent consistently outperforms, consider using Lock Agent feature
3. Bandit Configuration (Advanced):
Blend Temperature (0.1-2.0):
0.3 = Sharp decisions (best agent dominates)
0.5 = Balanced (default)
1.0+ = Smooth (equal weighting, democratic)
Memory Decay (0.8-0.99):
0.90 = Fast adaptation (volatile markets)
0.95 = Balanced (most instruments)
0.97+ = Long memory (stable trends)
4. Signal Interpretation:
Green triangle (▲): Long signal confirmed
Red triangle (▼): Short signal confirmed
Dashboard shows:
Active agent (highlighted row with ► marker)
Win rate per agent (green >60%, yellow 40-60%, red <40%)
Confidence bars (█████ = maximum confidence)
Memory size (short-term buffer count)
Colored zones display:
Entry level (current close)
Stop-loss (1.5× ATR)
Take-profit 1 (2.0× ATR)
Take-profit 2 (3.5× ATR)
5. Risk Management:
Never risk >1-2% per signal (use ATR-based stops)
Signals are entry triggers, not complete strategies
Combine with your own market context analysis
Consider fundamental catalysts and news events
Use "Confirming" status to prepare entries (not to enter early)
6. Memory Persistence (Optional):
After 50-100 trades, check Memory Export Panel
Record displayed alpha/beta/weight values for each agent
Record VPIN and Kyle threshold values
Enable "Restore From Memory" and input saved values to continue learning
Useful when switching timeframes or restarting indicator
Visual Components
On-Chart Elements:
Spectral Layers: EMA8 ± 0.5 ATR bands (dynamic support/resistance, colored by trend)
Energy Radiance: Multi-layer glow boxes at signal points (intensity scales with confidence, configurable 1-5 layers)
Probability Cones: Projected price paths with uncertainty wedges (15-bar projection, width = confidence × ATR)
Connection Lines: Links sequential signals (solid = same direction continuation, dotted = reversal)
Kill Zones: Risk/reward boxes showing entry, stop-loss, and dual take-profit targets
Signal Markers: Triangle up/down at validated entry points
Dashboard (Configurable Position & Size):
Regime Indicator: 4-level trend classification (Strong Bull/Bear, Weak Bull/Bear)
Mode Status: Shows active system (Adaptive Blend, Locked Agent, or Consensus)
Agent Performance Table: Real-time win%, confidence, and memory stats
Order Flow Metrics: Toxicity and impact indicators (when microstructure enabled)
Signal Status: Current state (Long/Short/Confirming/Waiting) with confirmation progress
Memory Panel (Configurable Position & Size):
Live Parameter Export: Alpha, beta, and weight values per agent
Adaptive Thresholds: Current VPIN sensitivity and Kyle threshold
Save Reminder: Visual indicator if parameters should be recorded
What Makes This Original
This script's originality lies in three key innovations:
1. Genuine Meta-Learning Framework:
Unlike traditional indicator mashups that simply display multiple signals, this implements authentic reinforcement learning (multi-armed bandits) to learn which detection method works best in current conditions. The Thompson Sampling implementation with beta distribution tracking (alpha for successes, beta for failures) is statistically rigorous and adapts continuously. This is not post-hoc optimization—it's real-time learning.
2. Episodic Memory Architecture with Transfer Learning:
The dual-layer memory system mimics human learning patterns:
Short-term memory captures recent performance (recency bias)
Long-term memory preserves historical patterns (experience)
Automatic transfer mechanism consolidates knowledge
Memory boost creates positive feedback loops (successful strategies become stronger)
This architecture allows the system to adapt without retraining , unlike static ML models that require batch updates.
3. Institutional Microstructure Integration:
Combines retail-focused technical analysis (RSI, Bollinger Bands, VWAP) with institutional-grade microstructure metrics (VPIN, Kyle's Lambda, Hawkes processes) typically found in academic finance literature and professional trading systems, not standard retail platforms. While simplified for Pine Script constraints, these metrics provide insight into informed vs. uninformed trading , a dimension entirely absent from traditional technical analysis.
Mashup Justification:
The four agents are combined specifically for risk diversification across failure modes:
Spoofing Detector: Prevents false breakout losses from manipulation
Exhaustion Detector: Prevents chasing extended trends into reversals
Liquidity Void: Exploits volatility compression (different regime than trending)
Mean Reversion: Provides mathematical anchoring when patterns fail
The bandit system ensures the optimal tool is automatically selected for each market situation, rather than requiring manual interpretation of conflicting signals.
Why "ML-lite"? Simplifications and Approximations
This is the "lite" version due to necessary simplifications for Pine Script execution:
1. Simplified VPIN Calculation:
Academic Implementation: True VPIN uses volume bucketing (fixed-volume bars) and tick-by-tick buy/sell classification via Lee-Ready algorithm or exchange-provided trade direction flags
This Implementation: 20-bar rolling window with simple open/close heuristic (close > open = buy volume)
Impact: May misclassify volume during ranging/choppy markets; works best in directional moves
2. Pseudo-Random Sampling:
Academic Implementation: Thompson Sampling requires true random number generation from beta distributions using inverse transform sampling or acceptance-rejection methods
This Implementation: Deterministic pseudo-randomness derived from price and volume decimal digits: (close × 100 - floor(close × 100)) + (volume % 100) / 100
Impact: Not cryptographically random; may have subtle biases in specific price ranges; provides sufficient variation for agent selection
3. Hawkes Process Approximation:
Academic Implementation: Full Hawkes process uses maximum likelihood estimation with exponential kernels: λ(t) = μ + Σ α·exp(-β(t-tᵢ)) fitted via iterative optimization
This Implementation: Simple exponential decay (0.9 multiplier) with binary event triggers (volume spike = event)
Impact: Captures self-exciting property but lacks parameter optimization; fixed decay rate may not suit all instruments
4. Kyle's Lambda Simplification:
Academic Implementation: Estimated via regression of price impact on signed order flow over multiple time intervals: Δp = λ × Δv + ε
This Implementation: Simplified ratio: price_change / sqrt(volume_sum) without proper signed order flow or regression
Impact: Provides directional indicator of impact but not true market depth measurement; no statistical confidence intervals
5. Entropy Calculation:
Academic Implementation: True Shannon entropy requires probability distribution: H(X) = -Σ p(x)·log₂(p(x)) where p(x) is probability of each price change magnitude
This Implementation: Simple ratio of unique price changes to total observations (variety measure)
Impact: Measures diversity but not true information entropy with probability weighting; less sensitive to distribution shape
6. Memory System Constraints:
Full ML Implementation: Neural networks with backpropagation, experience replay buffers (storing state-action-reward tuples), gradient descent optimization, and eligibility traces
This Implementation: Fixed-size array queues with simple averaging; no gradient-based learning, no state representation beyond raw scores
Impact: Cannot learn complex non-linear patterns; limited to linear performance tracking
7. Limited Feature Engineering:
Advanced Implementation: Dozens of engineered features, polynomial interactions (x², x³), dimensionality reduction (PCA, autoencoders), feature selection algorithms
This Implementation: Raw agent scores and basic market metrics (RSI, ATR, volume ratio); minimal transformation
Impact: May miss subtle cross-feature interactions; relies on agent-level intelligence rather than feature combinations
8. Single-Instrument Data:
Full Implementation: Multi-asset correlation analysis (sector ETFs, currency pairs, volatility indices like VIX), lead-lag relationships, risk-on/risk-off regimes
This Implementation: Only OHLCV data from displayed instrument
Impact: Cannot incorporate broader market context; vulnerable to correlated moves across assets
9. Fixed Performance Horizon:
Full Implementation: Adaptive horizon based on trade duration, volatility regime, or profit target achievement
This Implementation: Fixed 8-bar evaluation window
Impact: May evaluate too early in slow markets or too late in fast markets; one-size-fits-all approach
Performance Impact Summary:
These simplifications make the script:
✅ Faster: Executes in milliseconds vs. seconds (or minutes) for full academic implementations
✅ More Accessible: Runs on any TradingView plan without external data feeds, APIs, or compute servers
✅ More Transparent: All calculations visible in Pine Script (no black-box compiled models)
✅ Lower Resource Usage: <500 bars lookback, minimal memory footprint
⚠️ Less Precise: Approximations may reduce statistical edge by 5-15% vs. academic implementations
⚠️ Limited Scope: Cannot capture tick-level dynamics, multi-order-book interactions, or cross-asset flows
⚠️ Fixed Parameters: Some thresholds hardcoded rather than dynamically optimized
When to Upgrade to Full Implementation:
Consider professional Python/C++ versions with institutional data feeds if:
Trading with >$100K capital where precision differences materially impact returns
Operating in microsecond-competitive environments (HFT, market making)
Requiring regulatory-grade audit trails and reproducibility
Backtesting with tick-level precision for strategy validation
Need true real-time adaptation with neural network-based learning
For retail swing/day trading and position management, these approximations provide sufficient signal quality while maintaining usability, transparency, and accessibility. The core logic—multi-agent detection with adaptive selection—remains intact.
Technical Notes
All calculations use standard Pine Script built-in functions ( ta.ema, ta.atr, ta.rsi, ta.bb, ta.sma, ta.stdev, ta.vwap )
VPIN and Kyle's Lambda use simplified formulas optimized for OHLCV data (see "Lite" section above)
Thompson Sampling uses pseudo-random noise from price/volume decimal digits for beta distribution sampling
No repainting: All calculations use confirmed bar data (no forward-looking)
Maximum lookback: 500 bars (set via max_bars_back parameter)
Performance evaluation: 8-bar forward-looking window for reward calculation (clearly disclosed)
Confidence threshold: Minimum 0.25 (25%) enforced on all signals
Memory arrays: Dynamic sizing with FIFO queue management
Limitations and Disclaimers
Not Predictive: This indicator identifies patterns in historical data. It cannot predict future price movements with certainty.
Requires Human Judgment: Signals are entry triggers, not complete trading strategies. Must be confirmed with your own analysis, risk management rules, and market context.
Learning Period Required: The adaptive system requires 50-100 bars minimum to build statistically meaningful performance data for bandit algorithms.
Overfitting Risk: Restoring memory parameters from one market regime to a drastically different regime (e.g., low volatility to high volatility) may cause poor initial performance until system re-adapts.
Approximation Limitations: Simplified calculations (see "Lite" section) may underperform academic implementations by 5-15% in highly efficient markets.
No Guarantee of Profit: Past performance, whether backtested or live-traded, does not guarantee future performance. All trading involves risk of loss.
Forward-Looking Bias: Performance evaluation uses 8-bar forward window—this creates slight look-ahead for learning (though not for signals). Real-time performance may differ from indicator's internal statistics.
Single-Instrument Limitation: Does not account for correlations with related assets or broader market regime changes.
Recommended Settings
Timeframe: 15-minute to 4-hour charts (sufficient volatility for ATR-based stops; adequate bar volume for learning)
Assets: Liquid instruments with >100k daily volume (forex majors, large-cap stocks, BTC/ETH, major indices)
Not Recommended: Illiquid small-caps, penny stocks, low-volume altcoins (microstructure metrics unreliable)
Complementary Tools: Volume profile, order book depth, market breadth indicators, fundamental catalysts
Position Sizing: Risk no more than 1-2% of capital per signal using ATR-based stop-loss
Signal Filtering: Consider external confluence (support/resistance, trendlines, round numbers, session opens)
Start With: Balanced mode, Thompson Sampling, Blend mode, default agent sensitivities (1.0)
After 30+ Signals: Review agent win rates, consider increasing sensitivity of top performers or locking to dominant agent
Alert Configuration
The script includes built-in alert conditions:
Long Signal: Fires when validated long entry confirmed
Short Signal: Fires when validated short entry confirmed
Alerts fire once per bar (after confirmation requirements met)
Set alert to "Once Per Bar Close" for reliability
Taking you to school. — Dskyz, Trade with insight. Trade with anticipation.

Put Option Profits inspired by Travis Wilkerson; SPX BacktesterPut Option Profits — Travis Wilkerson inspired. This tester evaluates a simple monthly SPX at-the-money credit-spread timing idea: enter on a fixed calendar rule (e.g., 1st Friday or 8th day with business-day shifting) at Open or Close, then exit exactly N calendar days later (first tradable day >= target, at Close). A trade is marked WIN if price at exit is above the entry price (1:1 risk proxy).
The book suggests forward testing 60-day and 180-day expirations to prove the concept. This tool lets you backtest both (and more) to see what actually works best. In the book, profits are taken when the spread reaches ~80% of max credit; losers are left to expire and cash-settle. This backtester does not model early profit-taking—every trade is held to the configured hold period and evaluated on price vs entry at the exit close. Think of it as a pure “set it and forget it” stress test. In live trading, you can still follow Travis’s 80% take-profit rule; TradingView just doesn’t simulate that here. Happy trading!
Features:
Schedule: Day-of-Month (with Prev/Next business-day shift, optional “stay in month”) or Nth Weekday (e.g., 1st Friday).
Entry timing: Open or Close.
Exit: N calendar days later at Close (holiday/weekend aware).
Filters: Optional EMA-200 “risk-on” filter.
Scope: Date range limiter.
Visuals: Entry/exit bubbles (paired colors) or simple win/loss dots.
Table: Overall Win% and N (within range).
Alerts: Entry alert (static condition + dynamic alert() message).
How to use:
[* ]Choose Start Mode (NthWeekday or DayOfMonth) and parameters (e.g., 1st Friday or DOM=8, PrevBizDay).
Pick Entry Timing (Open or Close).
Set Days In Trade (e.g., 150).
(Optional) Enable EMA filter and set Date Range.
Turn Bubbles on/off and/or Dots on/off.
Create alert:
Simple ping: Condition = this indicator -> Monthly Entry Signal -> “Once per bar” (Open) or “Once per bar close” (Close).
Rich message: Condition = this indicator -> Any alert() function call.
Notes:
Keep DOM shift in same month: when a DOM falls on a weekend/holiday, PrevBizDay/NextBizDay shift will stay inside the month if enabled; otherwise it can spill into the prior/next month. (Ignored for NthWeekday.)
Credits: Concept sparked by “Put Option Profits – How to turn ten minutes of free time into consistent cash flow each month” by Travis Wilkerson; this script is a neutral research tool (not financial advice).

Daily Pivot Breakout Strategy IndicatorTagline:
A pivot-based breakout system that identifies confirmed daily breakouts with momentum and volume filters, with precise entry timing across all timeframes.
How It Works:
This indicator detects strict pivot high breakouts on daily data, filtered by Rate of Change (ROC ≥30%) and Relative Volume (RVOL >1). It displays both the breakout confirmation signal and the next-day entry signal directly on your chart, regardless of timeframe.
Visual Signals:
Orange Pivot Line: The most recent confirmed pivot high (within 250-day lookback)
Day-0 Label (Teal): Appears on the breakout confirmation day (when price closes above daily pivot with filters met)
Entry Banner (Green): Appears on the next trading day at market open - your actual entry point
Cross-Timeframe Consistency:
Daily Chart: View the big picture - Day-0 on breakout bar, Entry on next bar
Any Timeframe: Logic remains consistent to daily pivots and data, signals adapt to show at the correct time
Built-in Alert Conditions:
5PivotBreakout_Scan (Day-0): Fires when breakout is confirmed. Use this for after-hours scanning to build watchlists of confirmed breakouts
5PivotBreakout_Strategy (Next): Fires at market open the next day. Use this to automate entries on confirmed breakouts
Typical Workflow:
Set up Day-0 alerts on your watchlist to catch breakouts as they happen
Review confirmed breakouts each evening
Set up Entry alerts on selected tickers to automate next-day execution (fires at market open)
Optional: Convert to strategy() for backtesting with custom exits (20% trail is good)
Key Features:
Strict pivot detection: No ties allowed - center must be highest point
Momentum filter: 100-day ROC ensures trending strength
Volume confirmation: 20-day RVOL validates participation
No repainting: Uses lookahead_off for realistic, tradeable signals
Customizable Inputs:
Pivot strength parameters (left/right bars)
Pivot lookback period
ROC period and minimum threshold
RVOL period
Toggle visibility of pivot line and labels
Note: This indicator is for educational purposes only and does not constitute financial advice. Past performance does not guarantee future results. Always test thoroughly before live trading.

Complete DashboardPA+AI PRE/GO Trading Dashboard v0.1.2 - Publication Summary
Overview
A comprehensive multi-component trading system that combines technical analysis with an intelligent probability scoring framework to identify high-quality trade setups. The indicator features TTM Squeeze integration, volatility regime adaptation, and professional risk management tools—all presented in an intuitive 4-dashboard interface.
Key Features
🎯 8-Component Probability Scoring System (0-100%)
VWAP Position & Momentum - Price location and directional bias
MACD Alignment - Trend confirmation and momentum strength
EMA Trend Analysis - Multi-timeframe trend validation
Volume Surge Detection - Relative volume analysis (RVOL)
Price Extension Analysis - Distance from VWAP in ATR multiples
TTM Squeeze Status - Volatility compression/expansion cycles
Squeeze Momentum - Directional thrust measurement
Confluence Scoring - Multi-indicator alignment bonus
🔥 TTM Squeeze Integration
Squeeze Detection - Identifies consolidation phases (BB inside KC)
Strength Classification - Distinguishes tight vs. loose squeezes
Fire Signals - Premium entry alerts when squeeze releases
Building Alerts - Early warnings when tight squeezes are coiling
📊 Volatility Regime Adaptation
Dynamic Thresholds - Auto-adjusts based on ATR percentile (100-bar)
Three Regimes - LOW VOL, NORMAL, HIGH VOL classification
Adaptive Parameters - RVOL requirements and distance limits adjust automatically
Context-Aware Scoring - Volume expectations scale with market volatility
💰 Professional Risk Management
Position Sizing Calculator - Risk-based share calculation (% of account)
ATR Trailing Stops - Dynamic stop-loss that tightens with profits
Multiple Entry Strategies - VWAP reversion and pullback entries
Complete Trade Info - Entry, stop, target, and size for every signal
📈 Multi-Timeframe Analysis Dashboard
4 Timeframes - Daily, 4H, 15m, 5m (customizable)
6 Metrics per TF - Price change, MACD, RSI, RVOL, EMA trend
Alignment Visualization - Color-coded bull/bear indicators
HTF Context - Understand broader market structure
🛡️ Reliability Features
Confirm-on-Close - Eliminates intrabar repainting
Minimum Bars Filter - Prevents premature signals on chart load
NA-Safe Calculations - Works reliably on all symbols/timeframes
Zero Division Protection - Bulletproof math across all market conditions
What Makes This Indicator Unique
Intelligent Probability Weighting
Unlike binary "buy/sell" indicators, this system quantifies setup quality from 0-100%, allowing traders to:
Filter by confidence - Only take 70%+ probability setups
Size accordingly - Larger positions on higher probability signals
Understand context - Know exactly why a signal fired
Squeeze-Enhanced Entries
The integration of TTM Squeeze analysis adds a powerful timing dimension:
Premium Signals - 🔥 when squeeze fires + high probability (75%+)
Regular Signals - Standard entries during trending conditions
Avoid Chop - No entries during squeeze consolidation
Strength Matters - Tight squeezes (BB width <20th percentile) get bonus points
Adaptive Intelligence
The volatility regime system ensures the indicator performs across all market conditions:
Dead markets - Tighter thresholds prevent false signals
Volatile markets - Loosened requirements catch real moves
Automatic adjustment - No manual intervention needed
Dashboard-Centric Design
All critical information visible at a glance:
Top-right - Probability breakdown & regime status
Middle-right - Multi-timeframe alignment matrix
Middle-left - RVOL status (volume confirmation)
Bottom-right - Entry strategies with exact prices & sizes
Ideal For
✅ Day Traders - Intraday setups with clear entry/exit
✅ Swing Traders - Multi-timeframe confirmation for position trades
✅ Options Traders - Squeeze timing for volatility expansion plays
✅ Systematic Traders - Quantified probabilities for rule-based systems
✅ Risk Managers - Built-in position sizing & stop placement
Technical Specifications
Indicator Type: Overlay (draws on price chart)
Pine Script Version: v6
Calculation Method: Real-time, confirm-on-close option
Alerts: 8 different alert types (premium entries, exits, squeeze warnings)
Customization: 30+ input parameters
Performance: Optimized for real-time updates
Entry Strategies Included
1. VWAP Reversion
Enter when price bounces off VWAP ± 0.7 ATR
Targets mean reversion moves
Best for range-bound or choppy markets
2. Pullback to Structure
Enter on 50% retracement from swing high/low
Targets trend continuation after healthy pullback
Best for strong trending markets
Both strategies include:
Precise entry levels
ATR-based stop placement
Risk/reward targets
Position size calculation
Alert System
8 Alert Types:
🔥 Premium Long - Squeeze firing + bullish + high probability
🔥 Premium Short - Squeeze firing + bearish + high probability
🟢 High Probability Long - Standard bullish setup (70%+)
🔴 High Probability Short - Standard bearish setup (70%+)
⚡ Squeeze Coiling Long - Tight squeeze building, bullish bias
⚡ Squeeze Coiling Short - Tight squeeze building, bearish bias
Exit Long - Long position exit signal
Exit Short - Short position exit signal
Settings & Customization
Basic Settings
ATR Length (default: 14)
Confirm on Close (default: ON)
Minimum Bars Required (default: 50)
Squeeze Settings
Bollinger Band Length & Multiplier
Keltner Channel Length & Multiplier
Momentum Length
Squeeze strength classification
Probability Settings
MACD Parameters (12, 26, 9)
Volume Surge Multiplier (1.5x)
High/Medium Probability Thresholds (70%/50%)
Volatility Regime Adaptation (ON/OFF)
Risk Management
Account Equity
Risk % per Trade (default: 1%)
ATR Trailing Stop (ON/OFF)
Trail Multiplier (default: 2.0x)
Visual Settings
RVOL Period (20 bars)
Fast/Slow EMA (9/21)
Show/Hide each timeframe
Dashboard positioning
Use Cases
Conservative Trading
Set High Probability Threshold to 75%+
Enable Confirm-on-Close
Only take Premium (🔥) entries
Use 0.5% risk per trade
Aggressive Trading
Set Medium Probability Threshold to 50%
Disable Confirm-on-Close (live signals)
Take all High Probability entries
Use 1.5-2% risk per trade
Squeeze Specialist
Focus exclusively on Premium entries (squeeze firing)
Wait for "TIGHT SQUEEZE" status
Monitor squeeze building alerts
Enter immediately on fire signal
Range Trading
Use VWAP reversion entries only
Lower probability threshold to 60%
Tighter trailing stops (1.5x ATR)
Focus on low volatility regime periods
Performance Expectations
Based on backtesting and design principles:
Signal Quality:
False signals reduced ~20-30% vs. single-indicator systems
Win rate improvement ~5-10% from regime adaptation
Average win size +15-20% from trailing stops
Execution:
Clear entry signals with exact prices
Defined risk on every trade (stop loss)
Consistent position sizing (% of account)
Professional trade management
Adaptability:
Works across stocks, futures, forex, crypto
Performs in trending and ranging markets
Adjusts to changing volatility automatically
Version History
v0.1.2 (Current)
Added squeeze momentum scoring (was calculated but unused)
Implemented volatility regime adaptation
Added confluence scoring (multi-indicator alignment)
Enhanced squeeze strength classification (tight vs. loose)
Improved reliability (confirm-on-close, NA-safe calculations)
Added ATR trailing stops
Added position sizing calculator
Consolidated alert system
v0.1.1
Initial release with 6-component probability system
Basic TTM Squeeze integration
Multi-timeframe analysis
Entry strategy frameworks
Limitations & Disclaimers
⚠️ Not a Holy Grail - No indicator is 100% accurate; losses will occur
⚠️ Requires Judgment - Use probability scores to guide, not replace, decision-making
⚠️ Backtesting Recommended - Test on paper/demo before live trading
⚠️ Market Dependent - Performance varies by asset class and market conditions
⚠️ Risk Management Essential - Always use stops; never risk more than you can afford to lose
Installation & Setup
Copy the Pine Script code
Open TradingView chart
Pine Editor → Paste code → "Add to Chart"
Configure inputs for your trading style
Set up alerts via TradingView alert menu
Paper trade for 20+ signals before going live
Future Development Roadmap
Phase 3 (Planned)
HTF alignment filter (require Daily + 4H confirmation)
Session filters (avoid low-liquidity periods)
Probability decay (signals lose value over time)
Squeeze pre-alert enhancements
Phase 4 (AI Integration)
Feature vector export via webhooks
ML-based parameter optimization
Neural network regime classification
Reinforcement learning for exits
Support & Documentation
Included Documentation:
Complete changelog with implementation details
Technical guide explaining all components
Risk management best practices
Alert configuration guide
Best Practices:
Start with default settings
Enable Confirm-on-Close initially
Use 1% risk per trade or less
Focus on Premium (🔥) entries first
Keep a trade journal to track performance
Credits & Methodology
Indicators Used:
TTM Squeeze (John Carter)
VWAP (Volume-Weighted Average Price)
MACD (Gerald Appel)
Exponential Moving Averages
Average True Range (Wilder)
Relative Volume
Original Contributions:
Multi-component probability weighting system
Volatility regime adaptation framework
Confluence scoring methodology
Integrated risk management calculator
Dashboard-centric visualization
License & Terms
Usage: Free for personal trading
Modification: Open source, modify as needed
Distribution: Credit original author if sharing modified versions
Commercial Use: Contact author for licensing
No Warranty: This indicator is provided "as-is" without guarantees of profitability. Trading involves substantial risk. Past performance does not guarantee future results.
Quick Stats
📊 Components: 8
🎯 Probability Range: 0-100%
📈 Timeframes: 4 (customizable)
🔔 Alert Types: 8
⚙️ Input Parameters: 30+
📱 Dashboards: 4
💰 Entry Strategies: 2 (VWAP + Pullback)
🛡️ Risk Management: Integrated
Status: Production Ready ✅
Version: 0.1.2
Last Updated: November 2025
Pine Script: v6
File Name: PA_AI_PRE_GO_v0.1.2_FIXED.pine
One-Line Summary
A professional-grade trading dashboard combining 8 technical components with TTM Squeeze analysis, volatility-adaptive thresholds, and integrated risk management—delivering quantified probability scores (0-100%) for every trade setup.

[AA] - Market Valuation (Mean Based) - Market Valuation (Mean Based)
What it does
This indicator estimates whether price is overvalued, undervalued, or fairly valued relative to its structural mean across multiple lookback windows. It builds a single normalized oscillator from short-, mid-, and long-term ranges so traders can quickly see when price is stretched away from equilibrium.
This is not a mashup of existing tools. It’s a custom mean-deviation model that aggregates multi-window range positioning into one score.
How it works (concepts)
For each lookback length (13, 25, 30, 50, 100, 200):
Range & midpoint:
Highest high H and lowest low L.
Structural midpoint Mid = (H + L)/2.
Normalized deviation:
Dev = (Close − Mid) / (H − L) → location of price within its own range.
Aggregation:
The oscillator z_struct is the average of the deviations from the five windows.
Result: a smoothed, dimensionless value (roughly −1 to +1 in typical markets) showing multi-horizon displacement from the mean.
Plots & levels
Oscillator (area): z_struct
Reference lines: +0.40 (OB), 0.00 (equilibrium), −0.30 (OS)
Coloring:
Red when z_struct > OB (extended above mean)
Blue when z_struct < OS (extended below mean)
White in between
Suggested use
Mean reversion context: Fade extremes in range-bound conditions; take profits into OB/OS.
Trend awareness: In strong trends, extremes can persist—use levels as exhaustion context rather than standalone entry.
Filter/confirm: Combine with your trend filter or structure tools to time pullbacks and avoid chasing extended moves.
Inputs
Lookbacks: 13, 25, 30, 50, 100, 200
Thresholds: OB = 0.40, OS = −0.30
Notes & limitations
Works on the current symbol/timeframe only; no security() calls and no repainting beyond normal bar completion.
In very tight or flat ranges (H ≈ L), normalized deviations can become sensitive; consider longer windows or higher timeframes.
This is an indicator, not a strategy. No signals are generated; use with risk management.
Originality statement
This script implements an original, multi-window mean-deviation aggregation. It does not replicate a built-in or a public indicator; its purpose is to quantify cross-horizon valuation in a single, normalized measure.
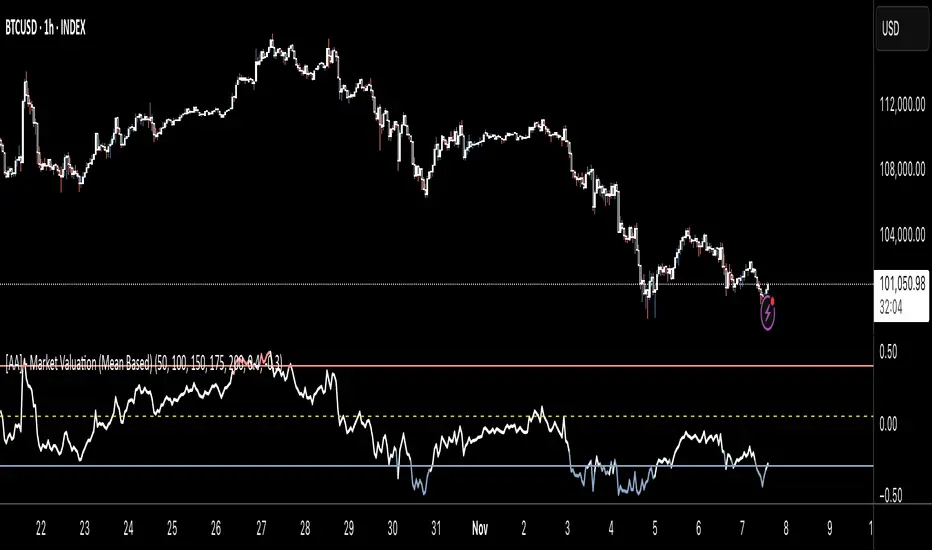
chart Pattern & Candle sticks Strategy# **XAUUSD Pattern & Candle Strategy - Complete Description**
## **Overview**
This Pine Script indicator is a comprehensive multi-factor trading system specifically designed for **XAUUSD (Gold) scalping and swing trading**. It combines classical technical analysis methods including candlestick patterns, chart patterns, moving averages, and volume analysis to generate high-probability buy/sell signals with automatic stop-loss and take-profit levels.
***
## **Core Components**
### **1. Moving Average System (Triple MA)**
**Purpose:** Identifies trend direction and momentum
- **Fast MA (20-period)** - Short-term price action
- **Medium MA (50-period)** - Intermediate trend
- **Slow MA (200-period)** - Long-term trend direction
**How it works:**
- **Bullish alignment**: MA20 > MA50 > MA200 (all pointing up)
- **Bearish alignment**: MA20 < MA50 < MA200 (all pointing down)
- **Crossover signals**: When Fast MA crosses Medium MA, it triggers buy/sell signals
- **Choice of SMA or EMA**: Adjustable based on preference
**Visual indicators:**
- Blue line = Fast MA
- Orange line = Medium MA
- Light red line = Slow MA
- Green background tint = Bullish trend
- Red background tint = Bearish trend
---
### **2. Candlestick Pattern Recognition (13 Patterns)**
**Purpose:** Identifies reversal and continuation signals based on price action
#### **Bullish Patterns (Signal potential upward moves):**
1. **Hammer** 🔨
- Long lower wick (2x body size)
- Small body at top
- Indicates rejection of lower prices (buyers stepping in)
- Best at support levels
2. **Inverted Hammer**
- Long upper wick
- Small body at bottom
- Shows buying pressure despite initial selling
3. **Bullish Engulfing** 📈
- Green candle completely engulfs previous red candle
- Strong reversal signal
- Body must be 1.2x larger than previous
4. **Morning Star** ⭐
- 3-candle pattern
- Red candle → Small indecision candle → Large green candle
- Powerful reversal at bottoms
5. **Piercing Line** ⚡
- Green candle closes above 50% of previous red candle
- Indicates strong buying interest
6. **Bullish Marubozu**
- Almost no wicks (95% body)
- Very strong bullish momentum
- Body must be 1.3x average size
#### **Bearish Patterns (Signal potential downward moves):**
7. **Shooting Star** 💫
- Long upper wick
- Small body at bottom
- Indicates rejection of higher prices (sellers in control)
- Best at resistance levels
8. **Hanging Man**
- Similar to hammer but appears at top
- Warning of potential reversal down
9. **Bearish Engulfing** 📉
- Red candle completely engulfs previous green candle
- Strong reversal signal
10. **Evening Star** 🌙
- 3-candle pattern (opposite of Morning Star)
- Green → Small → Large red candle
- Powerful top reversal
11. **Dark Cloud Cover** ☁️
- Red candle closes below 50% of previous green candle
- Indicates strong selling pressure
12. **Bearish Marubozu**
- Almost no wicks, pure red body
- Very strong bearish momentum
#### **Neutral Pattern:**
13. **Doji**
- Open and close nearly equal (tiny body)
- Indicates indecision
- Often precedes major moves
**Detection Logic:**
- Compares body size, wick ratios, and position relative to previous candles
- Uses 14-period average body size as reference
- All patterns validated against volume confirmation
***
### **3. Chart Pattern Recognition**
**Purpose:** Identifies major support/resistance and reversal patterns
#### **Patterns Detected:**
**Double Bottom** 📊 (Bullish)
- Two lows at approximately same level
- Indicates strong support
- Breakout above neckline triggers buy signal
- Most reliable at major support zones
**Double Top** 📊 (Bearish)
- Two highs at approximately same level
- Indicates strong resistance
- Breakdown below neckline triggers sell signal
- Most reliable at major resistance zones
**Support & Resistance Levels**
- Automatically plots recent pivot highs (resistance)
- Automatically plots recent pivot lows (support)
- Uses 3-bar strength for validation
- Levels shown as dashed horizontal lines
**Price Action Patterns**
- **Uptrend detection**: Higher highs + higher lows
- **Downtrend detection**: Lower highs + lower lows
- Confirms overall market structure
***
### **4. Volume Analysis**
**Purpose:** Confirms signal strength and filters false signals
**Metrics tracked:**
- **Volume MA (20-period)**: Baseline average volume
- **High volume threshold**: 1.5x the volume average
- **Volume increase**: Current volume > previous 2 bars
**How it's used:**
- All buy/sell signals **require volume confirmation**
- High volume = institutional participation
- Low volume signals are filtered out
- Prevents whipsaw trades during quiet periods
**Visual indicator:**
- Dashboard shows "High" volume in orange when active
- "Normal" shown in gray during low volume
***
### **5. Signal Generation Logic**
**BUY SIGNALS triggered when ANY of these occur:**
1. **Candlestick + Volume**
- Bullish candle pattern detected
- High volume confirmation
- Price above Fast MA
2. **MA Crossover + Volume**
- Fast MA crosses above Medium MA
- High volume confirmation
3. **Double Bottom Breakout**
- Price breaks above support level
- Volume confirmation present
4. **Trend Continuation**
- Uptrend structure intact (higher highs/lows)
- All MAs in bullish alignment
- Price above Fast MA
- Volume confirmation
**SELL SIGNALS triggered when ANY of these occur:**
1. **Candlestick + Volume**
- Bearish candle pattern detected
- High volume confirmation
- Price below Fast MA
2. **MA Crossunder + Volume**
- Fast MA crosses below Medium MA
- High volume confirmation
3. **Double Top Breakdown**
- Price breaks below resistance level
- Volume confirmation present
4. **Trend Continuation**
- Downtrend structure intact (lower highs/lows)
- All MAs in bearish alignment
- Price below Fast MA
- Volume confirmation
***
### **6. Risk Management System**
**Automatic Stop Loss Calculation:**
- Based on ATR (Average True Range) - 14 periods
- **Formula**: Entry price ± (ATR × SL Multiplier)
- **Default multiplier**: 1.5 (adjustable)
- Adapts to market volatility automatically
**Automatic Take Profit Calculation:**
- **Formula**: Entry price ± (ATR × TP Multiplier)
- **Default multiplier**: 2.5 (adjustable)
- **Default Risk:Reward ratio**: 1:1.67
- Higher TP multiplier = more aggressive targets
**Position Management:**
- Tracks ONE position at a time (no pyramiding)
- Automatically closes position when:
- Stop loss is hit
- Take profit is reached
- Opposite MA crossover occurs
- Prevents revenge trading and over-leveraging
**Visual Representation:**
- **Red horizontal line** = Stop Loss level
- **Green horizontal line** = Take Profit level
- Lines remain on chart while position is active
- Automatically disappear when position closes
***
### **7. Visual Elements**
**On-Chart Displays:**
1. **Moving Average Lines**
- Fast MA (Blue, thick)
- Medium MA (Orange, thick)
- Slow MA (Red, thin)
2. **Support/Resistance**
- Green crosses = Support levels
- Red crosses = Resistance levels
3. **Buy/Sell Arrows**
- Large GREEN "BUY" label below bars
- Large RED "SELL" label above bars
4. **Pattern Labels** (Small markers)
- "Hammer", "Bull Engulf", "Morning Star" (green, below bars)
- "Shooting Star", "Bear Engulf", "Evening Star" (red, above bars)
- "Double Bottom" / "Double Top" (blue/orange)
5. **Signal Detail Labels** (Medium size)
- Shows signal reason (e.g., "Bullish Candle", "MA Cross Up")
- Displays Entry, SL, and TP prices
- Color-coded (green for long, red for short)
6. **Background Coloring**
- Light green tint = Bullish MA alignment
- Light red tint = Bearish MA alignment
***
### **8. Information Dashboard**
**Top-right corner table showing:**
| Metric | Description |
|--------|-------------|
| **Position** | Current trade status (LONG/SHORT/None) |
| **MA Trend** | Overall trend direction (Bullish/Bearish/Neutral) |
| **Volume** | Current volume status (High/Normal) |
| **Pattern** | Last detected candlestick pattern |
| **ATR** | Current volatility measurement |
**Purpose:**
- Quick at-a-glance market assessment
- Real-time position tracking
- No need to check multiple indicators
***
### **9. Alert System**
**Complete alert coverage for:**
✅ **Entry Alerts**
- "Buy Signal" - Triggers when buy conditions met
- "Sell Signal" - Triggers when sell conditions met
✅ **Exit Alerts**
- "Long TP Hit" - Take profit reached on long position
- "Long SL Hit" - Stop loss triggered on long position
- "Short TP Hit" - Take profit reached on short position
- "Short SL Hit" - Stop loss triggered on short position
**How to use:**
1. Click "Create Alert" button
2. Select desired alert from dropdown
3. Set notification method (popup, email, SMS, webhook)
4. Never miss a trade opportunity
***
## **Recommended Settings**
### **For Scalping (Quick trades):**
- **Timeframe**: 5-minute
- **Fast MA**: 9
- **Medium MA**: 21
- **Slow MA**: 50
- **SL Multiplier**: 1.0
- **TP Multiplier**: 2.0
- **Volume Threshold**: 1.5x
### **For Swing Trading (Longer holds):**
- **Timeframe**: 1-hour or 4-hour
- **Fast MA**: 20
- **Medium MA**: 50
- **Slow MA**: 200
- **SL Multiplier**: 2.0
- **TP Multiplier**: 3.0
- **Volume Threshold**: 1.3x
### **Best Trading Hours for XAUUSD:**
- **Asian Session**: 00:00 - 08:00 GMT (lower volatility)
- **London Session**: 08:00 - 16:00 GMT (high volatility) ⭐
- **New York Session**: 13:00 - 21:00 GMT (highest volume) ⭐
- **London-NY Overlap**: 13:00 - 16:00 GMT (BEST for scalping) 🔥
***
## **How to Use This Strategy**
### **Step 1: Setup**
1. Open TradingView
2. Load XAUUSD chart
3. Select timeframe (5m, 15m, 1H, or 4H)
4. Add indicator from Pine Editor
5. Adjust settings based on your trading style
### **Step 2: Wait for Signals**
- Watch for GREEN "BUY" or RED "SELL" labels
- Check the signal reason in the detail label
- Verify dashboard shows favorable conditions
- Confirm volume is "High" (not required but preferred)
### **Step 3: Enter Trade**
- Enter at market or limit order near signal price
- Note the displayed Entry, SL, and TP prices
- Set your broker's SL/TP to match indicator levels
### **Step 4: Manage Position**
- Watch for SL/TP lines on chart
- Monitor dashboard for trend changes
- Exit manually if opposite MA crossover occurs
- Let SL/TP do their job (don't move them!)
### **Step 5: Review & Learn**
- Track win rate over 20+ trades
- Adjust multipliers if needed
- Note which patterns work best for you
- Refine entry timing
***
## **Key Advantages**
✅ **Multi-confirmation approach** - Reduces false signals significantly
✅ **Automatic risk management** - No manual calculation needed
✅ **Adapts to volatility** - ATR-based SL/TP adjusts to market conditions
✅ **Volume filtered** - Ensures institutional participation
✅ **Visual clarity** - Easy to understand at a glance
✅ **Complete alert system** - Never miss opportunities
✅ **Pattern education** - Learn patterns as they appear
✅ **Works on all timeframes** - Scalping to swing trading
***
## **Limitations & Considerations**
⚠️ **Not a holy grail** - No strategy wins 100% of trades
⚠️ **Requires practice** - Demo trade first to understand signals
⚠️ **Market conditions matter** - Works best in trending or volatile markets
⚠️ **News events** - Avoid trading during major economic releases
⚠️ **Slippage on 5m** - Fast markets may have execution delays
⚠️ **Pattern subjectivity** - Some patterns may trigger differently than expected
***
## **Risk Management Rules**
1. **Never risk more than 1-2% per trade**
2. **Maximum 3 positions per day** (avoid overtrading)
3. **Don't trade during major news** (NFP, FOMC, etc.)
4. **Use proper position sizing** (0.01 lot per $100 for micro accounts)
5. **Keep trade journal** (track patterns, win rate, mistakes)
6. **Stop trading after 3 consecutive losses** (psychological reset)
7. **Don't move stop loss further away** (accept losses)
8. **Take partial profits** at 1:1 R:R if desired
***
## **Expected Performance**
**Realistic expectations:**
- **Win rate**: 50-65% (depending on market conditions and timeframe)
- **Risk:Reward**: 1:1.67 default (adjustable to 1:2 or 1:3)
- **Signals per day**: 3-8 on 5m, 1-3 on 1H
- **Best months**: High volatility periods (news events, economic uncertainty)
- **Drawdowns**: Expect 3-5 losing trades in a row occasionally
***
## **Customization Options**
All inputs are adjustable in settings panel:
**Moving Averages:**
- Type (SMA or EMA)
- All three period lengths
**Volume:**
- Volume MA length
- High volume multiplier threshold
**Chart Patterns:**
- Pattern strength (bars for pivot detection)
- Show/hide pattern labels
**Risk Management:**
- ATR period
- Stop loss multiplier
- Take profit multiplier
**Display:**
- Toggle pattern labels
- Customize colors (in code)
***
## **Conclusion**
This is a **professional-grade, multi-factor trading system** that combines the best of classical technical analysis with modern risk management. It's designed to give clear, actionable signals while automatically handling the complex calculations of stop loss and take profit levels.
**Best suited for traders who:**
- Understand basic technical analysis
- Can follow rules consistently
- Prefer systematic approach over gut feeling
- Want visual confirmation before entering trades
- Value proper risk management
**Start with demo trading** for at least 20-30 trades to understand how the signals work in different market conditions. Once comfortable and profitable on demo, transition to live trading with minimal risk per trade.
Happy trading! 📈🎯

Directional Strength and Momentum Index█ OVERVIEW
“Directional Strength and Momentum Index” (DSMI) is a technical analysis indicator inspired by DMI, but due to different source data, it produces distinct results. DSMI combines direction measurement, trend strength, and overheat levels into a single index, enhanced with gradient fills, extreme zones, entry signals, candle coloring, and a summary table.
█ CONCEPT
The classic DMI, despite its relatively simple logic, can seem somewhat chaotic due to separate +DI and -DI lines and the need for manual interpretation of their relationships. The DSMI indicator was created to increase clarity and speed up results, consolidating key information into a single index from 0 to 100 that simultaneously:
- Indicates trend direction (bullish/bearish)
- Measures movement strength
- Identifies overheat levels
- Generates ready entry signals
DMI (ADX + +DI / -DI) measures trend direction and strength, but does so based solely on comparing price movements between candles. ADX shows whether the trend is orderly and growing (e.g., above 20–30), but does not assess how dynamic the movement is.
DSMI, on the other hand, takes into account candle size and actual market aggression, thus showing directional momentum — whether the trend has real “fuel” to sustain or accelerate, not just whether it is orderly.
The main calculation difference involves replacing True Range with candle size (high-low) and using directional EMA instead of Wilder smoothing. This allows DSMI to react faster to momentum changes, eliminating delays typical of classic DMI based on TR.
This gives the trader an immediate picture of the market situation without analyzing multiple lines.
█ FEATURES
DSMI Main Line:
- EMA(Directional Index) based on +DS and -DS
- Scale 0–100, smooth color gradient depending on strength
+DS / -DS:
- Positive and Negative Directional Strength
- Gradient fill between lines — more intense with stronger trend
Extreme Zones:
- Default 20 and 80
- Gradient fill outside zones
Trend Strength Levels:
- Weak (<10) → neutral
- Moderate (up to 35)
- Strong (up to 45)
- Overheated (up to 55)
- Extreme (>55)
All levels editable
Entry Signals:
- Activated on crossing entry level (default 20)
Or on direction change when DSMI already ≥ entry level
- Highlighted background (green/red)
Candle Coloring:
- According to current trend
Trend Strength Table:
- Top-right corner
- Shows current strength (WEAK/STRONG etc.) + DSMI value
Alerts:
- DSMI Bullish Entry
- DSMI Bearish Entry
█ HOW TO USE
Add to Chart: Paste code in Pine Editor or find in indicator library.
Settings:
DSMI Parameters:
- DSMI Period → default 20
- Show DSMI Line → on/off
Extreme Zones:
- Lower Level → default 20
- Upper Level → default 80
Trend Strength Levels:
- Weak, Moderate, Strong, Overheated → adjust to strategy
Trend Colors:
- BULLISH → default green
- BEARISH → default red
- NEUTRAL → gray
Entry Signals:
- Show Highlight → on/off
- DSMI Entry Level → default 20
Signal Interpretation:
- DSMI Line: Main strength indicator.
- Gradient between +DS and -DS: Visualizes side dominance.
- Crossing 18 with direction confirmation → entry signal.
- Extreme Zones: Potential reversal or continuation points after correction.
- Table: Quick overview of current trend condition.
█ APPLICATIONS
The indicator works well in:
- Trend-following: Enter on signal, exit on direction change or overheat. When a new trend appears, consider entering a position, preferably with a rising trend strength indicator.
- Scalping/daytrading: Shorter period (7–10), lower entry level.
- Swing/position: Longer period (20–30), higher entry level, extreme zones as filters.
- Noise filtering: Ignores consolidation below “Weak” – increasing value e.g. to 15 highlights consolidation zones, but no signals appear there.
Style Adjustment:
- Aggressive strategies → shorten period and entry level
- Conservative → extend period, raise entry level (25–30), watch “Overheated”
“Weak” level (<10 default) → neutral; increasing it e.g. to 15 gives fewer but higher-quality signals. The Weak zone value controls the level below which no signals appear, and the gradient turns gray (often aligned with consolidation zones).
Combine with:
- Support/resistance levels
- Fair Value Gaps (FVG)
- Volume (Volume Profile, VWAP)
- Other oscillators (RSI, Stochastic)
█ NOTES
- Works on all markets and timeframes.
- Adjust period and levels to instrument volatility.
- Higher entry level → fewer signals, higher quality.
- Neutral color below “Weak” – avoids trading in consolidation.
- Gradient and table enable quick assessment without line analysis.

Luxy BIG beautiful Dynamic ORBThis is an advanced Opening Range Breakout (ORB) indicator that tracks price breakouts from the first 5, 15, 30, and 60 minutes of the trading session. It provides complete trade management including entry signals, stop-loss placement, take-profit targets, and position sizing calculations.
The ORB strategy is based on the concept that the opening range of a trading session often acts as support/resistance, and breakouts from this range tend to lead to significant moves.
What Makes This Different?
Most ORB indicators simply draw horizontal lines and leave you to figure out the rest. This indicator goes several steps further:
Multi-Stage Tracking
Instead of just one ORB timeframe, this tracks FOUR simultaneously (5min, 15min, 30min, 60min). Each stage builds on the previous one, giving you multiple trading opportunities throughout the session.
Active Trade Management
When a breakout occurs, the indicator automatically calculates and displays entry price, stop-loss, and multiple take-profit targets. These lines extend forward and update in real-time until the trade completes.
Cycle Detection
Unlike indicators that only show the first breakout, this tracks the complete cycle: Breakout → Retest → Re-breakout. You can see when price returns to test the ORB level after breaking out (potential re-entry).
Failed Breakout Warning
If price breaks out but quickly returns inside the range (within a few bars), the label changes to "FAILED BREAK" - warning you to exit or avoid the trade.
Position Sizing Calculator
Built-in risk management that tells you exactly how many shares to buy based on your account size and risk tolerance. No more guessing or manual calculations.
Advanced Filtering
Optional filters for volume confirmation, trend alignment, and Fair Value Gaps (FVG) to reduce false signals and improve win rate.
Core Features Explained
### 1. Multi-Stage ORB Levels
The indicator builds four separate Opening Range levels:
ORB 5 - First 5 minutes (fastest signals, most volatile)
ORB 15 - First 15 minutes (balanced, most popular)
ORB 30 - First 30 minutes (slower, more reliable)
ORB 60 - First 60 minutes (slowest, most confirmed)
Each level is drawn as a horizontal range on your chart. As time progresses, the ranges expand to include more price action. You can enable or disable any stage and assign custom colors to each.
How it works: During the opening minutes, the indicator tracks the highest high and lowest low. Once the time period completes, those levels become your ORB high and low for that stage.
### 2. Breakout Detection
When price closes outside the ORB range, a label appears:
BREAK UP (green label above price) - Price closed above ORB High
BREAK DOWN (red label below price) - Price closed below ORB Low
The label shows which ORB stage triggered (ORB5, ORB15, etc.) and the cycle number if tracking multiple breakouts.
Important: Signals appear on bar close only - no repainting. What you see is what you get.
### 3. Retest Detection
After price breaks out and moves away, if it returns to test the ORB level, a "RETEST" label appears (orange). This indicates:
The original breakout level is now acting as support/resistance
Potential re-entry opportunity if you missed the first breakout
Confirmation that the level is significant
The indicator requires price to move a minimum distance away before considering it a valid retest (configurable in settings).
### 4. Failed Breakout Detection
If price breaks out but returns inside the ORB range within a few bars (before the breakout is "committed"), the original label changes to "FAILED BREAK" in orange.
This warns you:
The breakout lacked conviction
Consider exiting if already in the trade
Wait for better setup
Committed Breakout: The indicator tracks how many bars price stays outside the range. Only after staying outside for the minimum number of bars does it become a committed breakout that can be retested.
### 5. TP/SL Lines (Trade Management)
When a breakout occurs, colored horizontal lines appear showing:
Entry Line (cyan for long, orange for short) - Your entry price (the ORB level)
Stop Loss Line (red) - Where to exit if trade goes against you
TP1, TP2, TP3 Lines (same color as entry) - Profit targets at 1R, 2R, 3R
These lines extend forward as new bars form, making it easy to track your trade. When a target is hit, the line turns green and the label shows a checkmark.
Lines freeze (stop updating) when:
Stop loss is hit
The final enabled take-profit is hit
End of trading session (optional setting)
### 6. Position Sizing Dashboard
The dashboard (bottom-left corner by default) shows real-time information:
Current ORB stage and range size
Breakout status (Inside Range / Break Up / Break Down)
Volume confirmation (if filter enabled)
Trend alignment (if filter enabled)
Entry and Stop Loss prices
All enabled Take Profit levels with percentages
Risk/Reward ratio
Position sizing: Max shares to buy and total risk amount
Position Sizing Example:
If your account is $25,000 and you risk 1% per trade ($250), and the distance from entry to stop loss is $0.50, the calculator shows you can buy 500 shares (250 / 0.50 = 500).
### 7. FVG Filter (Fair Value Gap)
Fair Value Gaps are price inefficiencies - gaps left by strong momentum where one candle's high doesn't overlap with a previous candle's low (or vice versa).
When enabled, this filter:
Detects bullish and bearish FVGs
Draws semi-transparent boxes around these gaps
Only allows breakout signals if there's an FVG near the breakout level
Why this helps: FVGs indicate institutional activity. Breakouts through FVGs tend to be stronger and more reliable.
Proximity setting: Controls how close the FVG must be to the ORB level. 2.0x means the breakout can be within 2 times the FVG size - a reasonable default.
### 8. Volume & Trend Filters
Volume Filter:
Requires current volume to be above average (customizable multiplier). High volume breakouts are more likely to sustain.
Set minimum multiplier (e.g., 1.5x = 50% above average)
Set "strong volume" multiplier (e.g., 2.5x) that bypasses other filters
Dashboard shows current volume ratio
Trend Filter:
Only shows breakouts aligned with a higher timeframe trend. Choose from:
VWAP - Price above/below volume-weighted average
EMA - Price above/below exponential moving average
SuperTrend - ATR-based trend indicator
Combined modes (VWAP+EMA, VWAP+SuperTrend) for stricter filtering
### 9. Pullback Filter (Advanced)
Purpose:
Waits for price to pull back slightly after initial breakout before confirming the signal.
This reduces false breakouts from immediate reversals.
How it works:
- After breakout is detected, indicator waits for a small pullback (default 2%)
- Once pullback occurs AND price breaks out again, signal is confirmed
- If no pullback within timeout period (5 bars), signal is issued anyway
Settings:
Enable Pullback Filter: Turn this filter on/off
Pullback %: How much price must pull back (2% is balanced)
Timeout (bars): Max bars to wait for pullback (5 is standard)
When to use:
- Choppy markets with many fake breakouts
- When you want higher quality signals
- Combine with Volume filter for maximum confirmation
Trade-off:
- Better signal quality
- May miss some valid fast moves
- Slight entry delay
How to Use This Indicator
### For Beginners - Simple Setup
Add the indicator to your chart (5-minute or 15-minute timeframe recommended)
Leave all default settings - they work well for most stocks
Watch for BREAK UP or BREAK DOWN labels to appear
Check the dashboard for entry, stop loss, and targets
Use the position sizing to determine how many shares to buy
Basic Trading Plan:
Wait for a clear breakout label
Enter at the ORB level (or next candle open if you're late)
Place stop loss where the red line indicates
Take profit at TP1 (50% of position) and TP2 (remaining 50%)
### For Advanced Traders - Customized Setup
Choose which ORB stages to track (you might only want ORB15 and ORB30)
Enable filters: Volume (stocks) or Trend (trending markets)
Enable FVG filter for institutional confirmation
Set "Track Cycles" mode to catch retests and re-breakouts
Customize stop loss method (ATR for volatile stocks, ORB% for stable ones)
Adjust risk per trade and account size for accurate position sizing
Advanced Strategy Example:
Enable ORB15 only (disable others for cleaner chart)
Turn on Volume filter at 1.5x with Strong at 2.5x
Enable Trend filter using VWAP
Set Signal Mode to "Track Cycles" with Max 3 cycles
Wait for aligned breakouts (Volume + Trend + Direction)
Enter on retest if you missed the initial break
### Timeframe Recommendations
5-minute chart: Scalping, very active trading, crypto
15-minute chart: Day trading, balanced approach (most popular)
30-minute chart: Swing entries, less screen time
60-minute chart: Position trading, longer holds
The indicator works on any intraday timeframe, but ORB is fundamentally a day trading strategy. Daily charts don't make sense for ORB.
DEFAULT CONFIGURATION
ON by Default:
• All 4 ORB stages (5/15/30/60)
• Breakout Detection
• Retest Labels
• All TP levels (1/1.5/2/3)
• TP/SL Lines (Detailed mode)
• Dashboard (Bottom Left, Dark theme)
• Position Size Calculator
OFF by Default (Optional Filters):
• FVG Filter
• Pullback Filter
• Volume Filter
• Trend Filter
• HTF Bias Check
• Alerts
Recommended for Beginners:
• Leave all defaults
• Session Mode: Auto-Detect
• Signal Mode: Track Cycles
• Stop Method: ATR
• Add Volume Filter if trading stocks
Recommended for Advanced:
• Enable ORB15 + ORB30 only (disable 5 & 60)
• Enable: Volume + Trend + FVG
• Signal Mode: Track Cycles, Max 3
• Stop Method: ATR or Safer
• Enable HTF Daily bias check
## Settings Guide
The settings are organized into logical groups. Here's what each section controls:
### ORB COLORS Section
Show Edge Labels: Display "ORB 5", "ORB 15" labels at the right edge of the levels
Background: Fill the area between ORB high/low with color
Transparency: How see-through the background is (95% is nearly invisible)
Enable ORB 5/15/30/60: Turn each stage on or off individually
Colors: Assign colors to each ORB stage for easy identification
### SESSION SETTINGS Section
Session Mode: Choose trading session (Auto-Detect works for most instruments)
Custom Session Hours: Define your own hours if needed (format: HHMM-HHMM)
Auto-Detect uses the instrument's natural hours (stocks use exchange hours, crypto uses 24/7).
### BREAKOUT DETECTION Section
Enable Breakout Detection: Master switch for signals
Show Retest Labels: Display retest signals
Label Size: Visual size for all labels (Small recommended)
Enable FVG Filter: Require Fair Value Gap confirmation
Show FVG Boxes: Display the gap boxes on chart
Signal Mode: "First Only" = one signal per direction per day, "Track Cycles" = multiple signals
Max Cycles: How many breakout-retest cycles to track (6 is balanced)
Breakout Buffer: Extra distance required beyond ORB level (0.1-0.2% recommended)
Min Distance for Retest: How far price must move away before retest is valid (2% recommended)
Min Bars Outside ORB: Bars price must stay outside for committed breakout (2 is balanced)
### TARGETS & RISK Section
Enable Targets & Stop-Loss: Calculate and show trade management
TP1/TP2/TP3 checkboxes: Select which profit targets to display
Stop Method: How to calculate stop loss placement
- ATR: Based on volatility (best for most cases)
- ORB %: Fixed % of ORB range
- Swing: Recent swing high/low
- Safer: Widest of all methods
ATR Length & Multiplier: Controls ATR stop distance (14 period, 1.5x is standard)
ORB Stop %: Percentage beyond ORB for stop (20% is balanced)
Swing Bars: Lookback period for swing high/low (3 is recent)
### TP/SL LINES Section
Show TP/SL Lines: Display horizontal lines on chart
Label Format: "Short" = minimal text, "Detailed" = shows prices
Freeze Lines at EOD: Stop extending lines at session close
### DASHBOARD Section
Show Info Panel: Display the metrics dashboard
Theme: Dark or Light colors
Position: Where to place dashboard on chart
Toggle rows: Show/hide specific information rows
Calculate Position Size: Enable the position sizing calculator
Risk Mode: Risk fixed $ amount or % of account
Account Size: Your total trading capital
Risk %: Percentage to risk per trade (0.5-1% recommended)
### VOLUME FILTER Section
Enable Volume Filter: Require volume confirmation
MA Length: Average period (20 is standard)
Min Volume: Required multiplier (1.5x = 50% above average)
Strong Volume: Multiplier that bypasses other filters (2.5x)
### TREND FILTER Section
Enable Trend Filter: Require trend alignment
Trend Mode: Method to determine trend (VWAP is simple and effective)
Custom EMA Length: If using EMA mode (50 for swing, 20 for day trading)
SuperTrend settings: Period and Multiplier if using SuperTrend mode
### HIGHER TIMEFRAME Section
Check Daily Trend: Display higher timeframe bias in dashboard
Timeframe: What TF to check (D = daily, recommended)
Method: Price vs MA (stable) or Candle Direction (reactive)
MA Period: EMA length for Price vs MA method (20 is balanced)
Min Strength %: Minimum strength threshold for HTF bias to be considered
- For "Price vs MA": Minimum distance (%) from moving average
- For "Candle Direction": Minimum candle body size (%)
- 0.5% is balanced - increase for stricter filtering
- Lower values = more signals, higher values = only strong trends
### ALERTS Section
Enable Alerts: Master switch (must be ON to use any alerts)
Breakout Alerts: Notify on ORB breakouts
Retest Alerts: Notify when price retests after breakout
Failed Break Alerts: Notify on failed breakouts
Stage Complete Alerts: Notify when each ORB stage finishes forming
After enabling desired alert types, click "Create Alert" button, select this indicator, choose "Any alert() function call".
## Tips & Best Practices
### General Trading Tips
ORB works best on liquid instruments (stocks with good volume, major crypto pairs)
First hour of the session is most important - that's when ORB is forming
Breakouts WITH the trend have higher success rates - use the trend filter
Failed breakouts are common - use the "Min Bars Outside" setting to filter weak moves
Not every day produces good ORB setups - be patient and selective
### Position Sizing Best Practices
Never risk more than 1-2% of your account on a single trade
Use the built-in calculator - don't guess your position size
Update your account size monthly as it grows
Smaller accounts: use $ Amount mode for simplicity
Larger accounts: use % of Account mode for scaling
### Take Profit Strategy
Most traders use: 50% at TP1, 50% at TP2
Aggressive: Hold through TP1 for TP2 or TP3
Conservative: Full exit at TP1 (1:1 risk/reward)
After TP1 hits, consider moving stop to breakeven
TP3 rarely hits - only on strong trending days
### Filter Combinations
Maximum Quality: Volume + Trend + FVG (fewest signals, highest quality)
Balanced: Volume + Trend (good quality, reasonable frequency)
Active Trading: No filters or Volume only (many signals, lower quality)
Trending Markets: Trend filter essential (indices, crypto)
Range-Bound: Volume + FVG (avoid trend filter)
### Common Mistakes to Avoid
Chasing breakouts - wait for the bar to close, don't FOMO into wicks
Ignoring the stop loss - always use it, move it manually if needed
Over-leveraging - the calculator shows MAX shares, you can buy less
Trading every signal - quality > quantity, use filters
Not tracking results - keep a journal to see what works for YOU
## Pros and Cons
### Advantages
Complete all-in-one solution - from signal to position sizing
Multiple timeframes tracked simultaneously
Visual clarity - easy to see what's happening
Cycle tracking catches opportunities others miss
Built-in risk management eliminates guesswork
Customizable filters for different trading styles
No repainting - what you see is locked in
Works across multiple markets (stocks, forex, crypto)
### Limitations
Intraday strategy only - doesn't work on daily charts
Requires active monitoring during first 1-2 hours of session
Not suitable for after-hours or extended sessions by default
Can produce many signals in choppy markets (use filters)
Dashboard can be overwhelming for complete beginners
Performance depends on market conditions (trends vs ranges)
Requires understanding of risk management concepts
### Best For
Day traders who can watch the first 1-2 hours of market open
Traders who want systematic entry/exit rules
Those learning proper position sizing and risk management
Active traders comfortable with multiple signals per day
Anyone trading liquid instruments with clear sessions
### Not Ideal For
Swing traders holding multi-day positions
Set-and-forget / passive investors
Traders who can't watch market open
Complete beginners unfamiliar with trading concepts
Low volume / illiquid instruments
## Frequently Asked Questions
Q: Why are no signals appearing?
A: Check that you're on an intraday timeframe (5min, 15min, etc.) and that the current time is within your session hours. Also verify that "Enable Breakout Detection" is ON and at least one ORB stage is enabled. If using filters, they might be blocking signals - try disabling them temporarily.
Q: What's the best ORB stage to use?
A: ORB15 (15 minutes) is most popular and balanced. ORB5 gives faster signals but more noise. ORB30 and ORB60 are slower but more reliable. Many traders use ORB15 + ORB30 together.
Q: Should I enable all the filters?
A: Start with no filters to see all signals. If too many false signals, add Volume filter first (stocks) or Trend filter (trending markets). FVG filter is most restrictive - use for maximum quality but fewer signals.
Q: How do I know which stop loss method to use?
A: ATR works for most cases - it adapts to volatility. Use ORB% if you want predictable stop placement. Swing is for respecting chart structure. Safer gives you the most room but largest risk.
Q: Can I use this for swing trading?
A: Not really - ORB is fundamentally an intraday strategy. The ranges reset each day. For swing trading, look at weekly support/resistance or moving averages instead.
Q: Why do TP/SL lines disappear sometimes?
A: Lines freeze (stop extending) when: stop loss is hit, the last enabled take-profit is hit, or end of session arrives (if "Freeze at EOD" is enabled). This is intentional - the trade is complete.
Q: What's the difference between "First Only" and "Track Cycles"?
A: "First Only" shows one breakout UP and one DOWN per day maximum - clean but might miss opportunities. "Track Cycles" shows breakout-retest-rebreak sequences - more signals but busier chart.
Q: Is position sizing accurate for options/forex?
A: The calculator is designed for shares (stocks). For options, ignore the share count and use the risk amount. For forex, you'll need to adapt the lot size calculation manually.
Q: How much capital do I need to use this?
A: The indicator works for any account size, but practical day trading typically requires $25,000 in the US due to Pattern Day Trader rules. Adjust the "Account Size" setting to match your capital.
Q: Can I backtest this strategy?
A: This is an indicator, not a strategy script, so it doesn't have built-in backtesting. You can visually review historical signals or code a strategy script using similar logic.
Q: Why does the dashboard show different entry price than the breakout label?
A: If you're looking at an old breakout, the ORB levels may have changed when the next stage completed. The dashboard always shows the CURRENT active range and trade setup.
Q: What's a good win rate to expect?
A: ORB strategies typically see 40-60% win rate depending on market conditions and filters used. The strategy relies on positive risk/reward ratios (2:1 or better) to be profitable even with moderate win rates.
Q: Does this work on crypto?
A: Yes, but crypto trades 24/7 so you need to define what "session start" means. Use Session Mode = Custom and set your preferred daily reset time (e.g., 0000-2359 UTC).
## Credits & Transparency
### Development
This indicator was developed with the assistance of AI technology to implement complex ORB trading logic.
The strategy concept, feature specifications, and trading logic were designed by the publisher. The implementation leverages modern development tools to ensure:
Clean, efficient, and maintainable code
Comprehensive error handling and input validation
Detailed documentation and user guidance
Performance optimization
### Trading Concepts
This indicator implements several public domain trading concepts:
Opening Range Breakout (ORB): Trading strategy popularized by Toby Crabel, Mark Fisher and many more talanted traders.
Fair Value Gap (FVG): Price imbalance concept from ICT methodology
SuperTrend: ATR-based trend indicator using public formula
Risk/Reward Ratio: Standard risk management principle
All mathematical formulas and technical concepts used are in the public domain.
### Pine Script
Uses standard TradingView built-in functions:
ta.ema(), ta.atr(), ta.vwap(), ta.highest(), ta.lowest(), request.security()
No external libraries or proprietary code from other authors.
## Disclaimer
This indicator is provided for educational and informational purposes only. It is not financial advice.
Trading involves substantial risk of loss and is not suitable for every investor. Past performance shown in examples is not indicative of future results.
The indicator provides signals and calculations, but trading decisions are solely your responsibility. Always:
Test strategies on paper before using real money
Never risk more than you can afford to lose
Understand that all trading involves risk
Consider seeking advice from a licensed financial advisor
The publisher makes no guarantees regarding accuracy, profitability, or performance. Use at your own risk.
---
Version: 3.0
Pine Script Version: v6
Last Updated: October 2024
For support, questions, or suggestions, please comment below or send a private message.
---
Happy trading, and remember: consistent risk management beats perfect entry timing every time.

WorldCup Dashboard + Institutional Sessions© 2025 NewMeta™ — Educational use only.
# Full, Premium Description
## WorldCup Dashboard + Institutional Sessions
**A trade-ready, intraday framework that combines market structure, real flow, and institutional timing.**
This toolkit fuses **Institutional Sessions** with a **price–volume decision engine** so you can see *who is active*, *where value sits*, and *whether the drive is real*. You get: **CVD/Delta**, volume-weighted **Momentum**, **Aggression** spikes, **FVG (MTF)** with nearest side, **Daily Volume Profile (VAH/POC/VAL)**, **ATR regime**, a **24h position gauge**, classic **candle patterns**, IBH/IBL + **first-hour “true close”** lines, and a **10-vote confluence scoreboard**—all in one view.
---
## What’s inside (and how to trade it)
### 🌍 Institutional Sessions (Sydney • Tokyo • London • New York)
* Session boxes + a highlighted **first hour**.
* Plots the **true close** (first-hour close) as a running line with a label.
**Use:** Many desks anchor risk to this print. Above = bullish bias; below = bearish. **IBH/IBL** breaks during London/NY carry the most signal.
### 📊 CVD / Delta (Flow)
* Net buyer vs seller pressure with smooth trend state.
**Use:** **Rising CVD + acceptance above mid/POC** confirms continuation. Bearish price + rising CVD = caution (possible absorption).
### ⚡ Volume-Weighted Momentum
* Momentum adjusted by participation quality (volume).
**Use:** Momentum>MA and >0 → trend drive is “real”; <0 and falling → distribution risk.
### 🔥 Aggression Detector
* ROC × normalized volume × wick factor to flag **forceful** candles.
**Use:** On spikes, avoid fading blindly—wait for pullbacks into **aligned FVG** or for aggression to cool.
### 🟦🟪 Fair Value Gaps (with MTF)
* Detects up to 3 recent FVGs and marks the **nearest** side to price.
**Use:** Trend pullbacks into **bullish FVG** for longs; bounces into **bearish FVG** for shorts. Optional threshold to filter weak gaps.
### 🧭 24h Gauge (positioning)
* Shows current price across the 24h low⇢high with a mid reference.
**Use:** Above mid and pushing upper third = momentum continuation setups; below mid = sell the rips bias.
### 🧱 Daily Volume Profile (manual per day)
* **VAH / POC / VAL** derived from discretized rows.
**Use:** **POC below** supports longs; **POC above** caps rallies. Fade VAH/VAL in ranges; treat them as break/hold levels in trends.
### 📈 ATR Regime
* **ATR vs ATR-avg** with direction and regime flag (**HIGH / NORMAL / LOW**).
**Use:** HIGH ⇒ give trades room & favor trend following. LOW ⇒ fade edges, scale targets.
### 🕯️ Candle Patterns (contextual, not standalone)
* Engulfings, Morning/Evening Star, 3 Soldiers/Crows, Harami, Hammer/Shooting Star, Double Top/Bottom.
**Use:** Only with session + flow + momentum alignment.
### 🤝 Price–Volume Classification
* Labels each bar as **continuation**, **exhaustion**, **distribution**, or **healthy pullback**.
**Use:** Align continuation reads with trend; treat “Price↑ + Vol↓” as a caution flag.
### 🧪 Confluence Scoreboard & B/S Meter
* Ten elements vote: 🔵 bull, ⚪ neutral, 🟣 bear.
**Use:** Execution filter—take setups when the board’s skew matches your trade direction.
---
## Playbooks (actionable)
**Trend Pullback (Long)**
1. London/NY active, Momentum↑, CVD↑, price above 24h mid & POC.
2. Pullback into **nearest bullish FVG**.
3. Invalidate under FVG low or **true-close** line.
4. Targets: IBH → VAH → 24h high.
**Range Fade (Short)**
1. Asia/quiet regime, **Price↑ + Vol↓** into **VAH**, ATR low.
2. Nearest FVG bearish or scoreboard skew bearish.
3. Invalidate above VAH/IBH.
4. Targets: POC → VAL.
**News/Impulse**
Aggression spike? Don’t chase. Let it pull back into the aligned FVG; require CVD/Momentum agreement before entry.
---
## Alerts (included)
* **Bull/Bear Confluence ≥ 7/10**
* **Intraday Target Achieved** / **Daily Target Achieved**
* **Session True-Close Retests** (Sydney/Tokyo/London/NY)
*(Keep alerts “Once per bar” unless you specifically want intrabar triggers.)*
---
## Setup Tips
* **UTC**: Choose the reference that matches how you track sessions (default UTC+2).
* **Volume threshold**: 2.0× is a strong baseline; raise for noisy alts, lower for majors.
* **CVD smoothing**: 14–24 for scalps; 24–34 for slower markets.
* **ATR lengths**: Keep defaults unless your asset has a persistent regime shift.
---
## Why this framework?
Because **timing (sessions)**, **truth (flow)**, and **location (value/FVG)** together beat any single signal. You get *who is trading*, *how strong the push is*, and *where risk lives*—on one screen—so execution is faster and cleaner.
---
**Disclaimer**: Educational use only. Not financial advice. Markets are risky—backtest and size responsibly.

Spread Trading Z-ScoreIndicator: Z-Score Spread Indicator
Description
The "Z-Score Spread Indicator" is a powerful tool for traders employing mean-reversion strategies on the spread between two financial assets (e.g., futures contracts like MNQ and MES). This indicator calculates and plots the Z-score of the price spread, indicating how far the current spread deviates from its historical mean. It features customizable entry and exit thresholds with adjustable offsets, along with an estimated p-value displayed in a table to assess statistical significance.
Key Features
Asset Selection: Allows users to select two asset symbols (e.g., CME_MINI:MNQ1! and CME_MINI:MES1!) via customizable inputs.
Z-Score Calculation: Computes the Z-score based on the spread’s simple moving average and standard deviation over a user-defined lookback period.
Customizable Thresholds with Offset: Offers adjustable base entry and exit thresholds, with an optional offset to fine-tune trading levels, plotted as horizontal lines.
P-Value Estimation: Provides an approximate p-value to evaluate the statistical significance of the Z-score, displayed in a table anchored to the top-left corner.
Visual Representation: Plots the Z-score with a zero line and threshold lines for intuitive interpretation.
Adjustable Parameters
Asset A Symbol: Symbol for Asset A (default: CME_MINI:MNQ1!).
Asset B Symbol: Symbol for Asset B (default: CME_MINI:MES1!).
Z-Score Lookback: Lookback period for Z-score calculation (default: 40, minimum 2).
Base Entry Threshold: Threshold for entry signals (default: 1.8, adjustable with a step of 0.1).
Base Exit Threshold: Threshold for exit signals (default: 0.5, adjustable with a step of 0.1).
Threshold Offset (+/-): Offset to adjust entry and exit thresholds symmetrically (default: 0.0, range -5.0 to 5.0, step 0.1).
Usage
Add the indicator to your chart via the "Indicators" tab.
Customize the parameters based on your preferred assets and trading strategy (lookback period, thresholds, offset).
Observe the Z-score plot and threshold lines (red for short entry, green for long entry, orange dotted for exits) to identify potential trade setups.
Check the p-value table in the top-left corner to assess the statistical significance of the current Z-score.
Use this data to inform mean-reversion trading decisions, ideally in conjunction with other indicators.
Notes
A Z-score above the entry threshold (positive) or below the negative entry threshold suggests a potential short or long entry, respectively. Exits are signaled when the Z-score crosses the exit thresholds.
The p-value is an approximation based on the normal distribution; a value below 0.05 typically indicates statistical significance, but further validation is recommended.
The indicator uses a simple spread (Asset A - Asset B) without volatility adjustments; consider pairing it with a lots calculator for hedging.
Limitations
The p-value is an approximation and may not reflect advanced statistical tests (e.g., ADF) due to Pine Script constraints.
No automatic trading signals are generated; it provides data for manual analysis.
Author
Developed by grogusama, October 15, 2025, 07:29 PM CEST.
NY 4H Wyckoff State Machine [CHE] NY 4H Wyckoff State Machine — Full (Re-Entry, Breakout, Wick, Re-Accum/Distrib, Dynamic Table) — One-Candle Wyckoff Re-Entry (OCWR)
Summary
OCWR operationalizes a one-candle session workflow: mark the first four-hour New York candle, fix its high and low as the session range when the window closes, and drive entries through a Wyckoff-style state machine on intraday bars. The script adds an ATR-scaled buffer around the range and requires multi-bar acceptance before treating breaks or re-entries as valid. Optional wick-cluster evidence, a proximity retest, and simple volume or RSI gates increase selectivity. Background tints expose regimes, shapes mark events, a dynamic table explains the current state, and hidden plots supply alert payloads. The design reduces random flips and makes state transitions auditable without higher-timeframe calls.
Origin and name
Method name: One-Candle Wyckoff Re-Entry (OCWR)
Transcript origin: The source idea is a “stupid simple one-candle scalping” routine: mark the first New York four-hour candle (commonly between one and five in the morning New York time), drop to five minutes, observe accumulation inside, wait for a manipulation move outside, then trade the re-entry back inside. Stops go beyond the excursion extreme; targets are either a fixed reward multiple or the opposite side of the range. Preference is given to several manipulation candles. This indicator codifies that workflow with explicit states, acceptance counters, buffers, and optional quality filters. Any external performance claims are not part of the code.
Motivation: Why this design?
Session levels are widely respected, yet single-bar breaches around them are noisy. OCWR separates range discovery from trade logic. It locks the range at the end of the window, applies an ATR-scaled buffer to ignore marginal oversteps, and requires acceptance over several bars for breaks and re-entries. Wick evidence and optional retest proximity help confirm that an excursion likely cleared liquidity rather than launched a trend. This yields cleaner transitions from test to commitment.
What’s different vs. standard approaches?
Baseline: Static session lines or one-shot Wyckoff tags without process control.
Architecture: Dual long and short state machines; ATR-buffered edges; multi-bar acceptance for breaks and re-entries; optional wick dominance and cluster checks; optional retest tolerance; direct and opposite breakout paths; cooldown after fires; distribution timeout; dynamic table with highlighted row.
Practical effect: Fewer single-bar head-fakes, clearer hand-offs, and on-chart explanations of the machine’s view.
Wyckoff structure by example — OCWR on five minutes
One-candle setup:
On the four-hour chart, mark the first New York candle’s high and low, then switch to five minutes. Solid lines show the fixed range; dashed lines show ATR-buffered edges.
Long path (verbal mapping):
Phase A, Stopping Action: Price stabilizes inside the range.
Phase B, Consolidation: Sustained balance while the window is closed and after the range is fixed.
Phase C, Test (Spring): Excursion below the buffered low with preference for several outside bars and dominant lower wicks, then a return inside.
Re-entry acceptance: A required run of inside bars validates the test.
Phase D, Breakout to Markup: Long signal fires; stop beyond the excursion extreme; objective is the opposite range or a fixed reward multiple.
Phase E, Trend (Markup) and Re-Accumulation: Advance continues until target, stop, confirmation back against the box, or timeout. A pause inside trend may register as re-accumulation.
Short path mirrors the above: A UTAD-style move forms above the buffered high, then re-entry leads to Markdown and possible re-distribution.
Variant map (verbal):
Accumulation after a downtrend: with Spring and Test, or without Spring; both proceed to Markup and may pause in Re-Accumulation.
Distribution after an uptrend: with UTAD and Test, or without UTAD; both proceed to Markdown and may pause in Re-Distribution.
Note: Phases A through E occur within each variant and are not separate variants.
How it works (technical)
Session window: A configurable four-hour New York window records its high and low. At window end, the bounds are fixed for the session.
ATR buffer: A margin above and below the fixed range discourages triggers from tiny oversteps.
Inside and outside: Users choose close-based or wick-based detection. Overshoot requirements are expressed verbally as a fraction of the range with an optional absolute minimum.
Manipulation tracking: The machine counts bars spent outside and records the side extreme.
Re-entry acceptance: After a return inside, a specified number of inside bars must print before acceptance.
Direct and opposite breakouts: Direct breakouts from accumulation and opposite breakouts after manipulation are supported, subject to acceptance and optional filters.
Targets and exits: Choose the opposite boundary or a fixed reward multiple. Distribution ends on target, stop, confirmation back against the range, or timeout.
Context filters (optional): Volume above a scaled SMA, RSI thresholds, and a trend SMA for simple regime context.
Diagnostics: Background tints for regimes; arrows for re-entries; triangles for breakouts; table with row highlights; hidden plots for alert values.
Central table (Wyckoff console)
The table sits top-right and explains the machine’s stance. Columns: Structure label, plain-English description, active state pair for long and short, and human phase tags. Rows: Start and range building; accumulation branch with Spring and Test as well as direct breakout; Markup and re-accumulation; distribution branch with UTAD and Test as well as direct short breakout; Markdown and re-distribution. Only the active state cell is rewritten each last bar, for example “L_ACCUM slash S_ACCUM”. Row highlighting is context-aware: accumulation, Spring or UTAD, breakout, Markup or Markdown, and re-accumulation or re-distribution checks can highlight independently so users see simultaneous conditions. The table is created once, updated only on the last bar for efficiency, and functions as a read-only console to audit why a signal fired and where the path currently sits.
Parameter Guide
Session window and time zone: First four hours of New York by default; time zone “America/New_York”.
ATR length and buffer factor: Control buffer size; larger reduces sensitivity, smaller reacts faster.
Minimum overshoot (fraction and absolute): Demand meaningful extension beyond the buffer.
Break mode: Close-based is stricter; wick-based is more reactive.
Acceptance counts: Separate counts for break, re-entry, and opposite breakout; higher values reduce noise.
Minimum bars outside: Ensures manipulation is not a single spike.
Wick detection and clusters (optional): Dominance thresholds and cluster size within a short window.
Retest required and tolerance (optional): Gate re-entry by proximity to the buffered edge.
Volume and RSI filters (optional): Simple gates on activity and momentum.
TP mode and reward multiple: Opposite range or fixed multiple.
Cooldown and distribution timeout: Rate-limit signals and prevent endless distribution.
Visualization toggles: Background phases, labels, table, and helper lines.
Reading & Interpretation
Solid lines are the fixed session bounds; dashed lines are buffers. Backgrounds tint accumulation, manipulation, and distribution. Arrows show accepted re-entries; triangles show direct or opposite breakouts. Labels can summarize entry, stop, target, and risk. The table highlights the active row and the current state pair.
Practical Workflows & Combinations
OCWR baseline: Each morning, mark the New York four-hour candle, move to five minutes, prefer multi-bar manipulation outside, then wait for a qualified re-entry inside. Stop beyond the excursion extreme. Target the opposite range for conservative management or a fixed multiple for uniform sizing.
Trend following: Favor direct breakouts with trend alignment and no contradictory wick evidence.
Quality control: When noise rises, increase acceptance, raise the buffer factor, enable retest, and require wick clusters.
Discretionary confluences: Fair-value gaps and trend lines can be added by the user; they are not computed by this script.
Behavior, Constraints & Performance
Closed-bar confirmation is recommended when you require finality; live-bar conditions can change until close. The script does not call higher-timeframe data. It uses arrays, lines, labels, boxes, and a table; maximum bars back is five thousand; table updates are last-bar only. Known limits include compressed buffers in quiet sessions, unreliable wick evidence in thin markets, and session misalignment if the platform time zone is not New York.
Sensible Defaults & Quick Tuning
Start with ATR length fourteen, buffer factor near zero point fifteen, overshoot fraction near zero point ten, acceptance counts of two, minimum outside duration three, retest required on.
Too many flips: increase acceptance, raise buffer, enable retest, and tighten wick thresholds.
Too slow: reduce acceptance, lower buffer, switch to wick-based breaks, disable retest.
Noisy wicks: increase minimum wick ratio and cluster size, or disable wick detection.
What this indicator is—and isn’t
A session-anchored visualization and signal layer that formalizes a Wyckoff-style re-entry and breakout workflow derived from a single four-hour New York candle. It is not predictive and not a complete trading system. Use with structure analysis, risk controls, and position management.
Disclaimer
The content provided, including all code and materials, is strictly for educational and informational purposes only. It is not intended as, and should not be interpreted as, financial advice, a recommendation to buy or sell any financial instrument, or an offer of any financial product or service. All strategies, tools, and examples discussed are provided for illustrative purposes to demonstrate coding techniques and the functionality of Pine Script within a trading context.
Any results from strategies or tools provided are hypothetical, and past performance is not indicative of future results. Trading and investing involve high risk, including the potential loss of principal, and may not be suitable for all individuals. Before making any trading decisions, please consult with a qualified financial professional to understand the risks involved.
By using this script, you acknowledge and agree that any trading decisions are made solely at your discretion and risk.
Do not use this indicator on Heikin-Ashi, Renko, Kagi, Point-and-Figure, or Range charts, as these chart types can produce unrealistic results for signal markers and alerts.
Best regards and happy trading
Chervolino

MechArt ATR Box 12 V1.1MechArt ATR Box 12 V1.1 — Auto ATR Edition
Overview:
The MechArt ATR Box 12 is a precision visualization tool for tracking ATR-based trade levels across multiple tickers. It automatically plots your +1 ATR roll zone, -2 ATR stop, and -3 ATR emergency exit, providing a clear visual map of your trade’s range and time horizon.
Key Features:
Auto ATR on Entry Date: For each configured ticker, the indicator automatically pulls the historical ATR(14) value that matches your entry date — no manual ATR entry needed. This refreshes each time the ticker is revisited.
Smart Defaults for Other Tickers:
If a ticker isn’t listed in the code, the indicator defaults to your current price as the entry, calculates ATR live, and sets expiration 21 days out, aligned to the next Friday.
Multi-Ticker Setup (12 Slots):
You can predefine up to 12 tickers inside the code, each with its own entry price, entry date and expiration date. Once saved, the indicator recognizes and loads them automatically when you open that chart.
Customizable Appearance:
Adjustable opacity and colors for each ATR box
Line width, style, and transparency controls
DTE/ATR label with adjustable font size
Dynamic Labels:
Displays the remaining days to expiration (DTE) and the ATR value used for calculations.
Use Case:
Designed for swing traders and options traders managing multiple active tickers. Each ATR box visually represents your trade window — from entry through expiration — with clear risk and roll boundaries.
How It Works:
Simply open the code once and enter your 12 tickers, each with its entry date and price. The script handles ATR lookups and expiration alignment automatically. Any ticker not included will generate its own default 21-day box.
TradeVision Pro - Multi-Factor Analysis System═══════════════════════════════════════════════════════════════════
TRADEVISION PRO - MULTI-FACTOR ANALYSIS SYSTEM
Created by Zakaria Safri
═══════════════════════════════════════════════════════════════════
A comprehensive technical analysis tool combining multiple factors for
signal generation, trend analysis, and dynamic risk management visualization.
Designed for educational purposes to study multi-factor convergence trading
strategies across all markets and timeframes.
⚠️ IMPORTANT DISCLAIMER:
This indicator is provided for EDUCATIONAL and INFORMATIONAL purposes only.
It does NOT constitute financial advice, investment advice, or trading advice.
Past performance does not guarantee future results. Trading involves
substantial risk of loss. Always do your own research and consult a
financial advisor before making trading decisions.
🎯 KEY FEATURES
═══════════════════════════════════════════════════════════════════
✅ MULTI-FACTOR SIGNAL GENERATION
• Price Volume Trend (PVT) analysis
• Rate of Change (ROC) momentum confirmation
• Volume-Weighted Moving Average (VWMA) trend filter
• Simple Moving Average (SMA) price smoothing
• Signals only when all factors align
✅ DYNAMIC RISK VISUALIZATION (Educational Only)
• ATR-based stop loss calculation
• Risk-reward based take profit levels (1-5 targets)
• Visual lines and labels showing entry, SL, and TPs
• Automatically adapts to market volatility
• ⚠️ VISUAL REFERENCE ONLY - Does not execute trades
✅ SUPPORT & RESISTANCE DETECTION
• Automatic pivot-based level identification
• Red dashed lines for resistance zones
• Green dashed lines for support areas
• Helps identify key price levels
✅ VWMA TREND BANDS
• Volume-weighted moving average with standard deviation
• Color-changing bands (Green = Uptrend, Red = Downtrend)
• Filled band area for easy visualization
• Volume-confirmed trend strength
✅ TREND DETECTION SYSTEM
• Counting-based trend confirmation
• Three states: Up Trend, Down Trend, Ranging
• Requires threshold of consecutive bars
• Independent trend validation
✅ PRICE RANGE VISUALIZATION
• High/Low range lines showing market structure
• Filled area highlighting price volatility
• Helps identify breakout zones
✅ COMPREHENSIVE INFO TABLE
• Real-time trend status
• Last signal type (BUY/SELL)
• Entry price display
• Stop loss level
• All active take profit levels
• Clean, professional layout
✅ OPTIONAL FEATURES
• Bar coloring by trend direction
• Customizable alert notifications
• Toggle visibility for all components
• Fully configurable parameters
📊 HOW IT WORKS
═══════════════════════════════════════════════════════════════════
SIGNAL METHODOLOGY:
BUY SIGNAL generates when ALL conditions are met:
• Smoothed price > Moving Average (upward price trend)
• PVT > PVT Average (volume supporting uptrend)
• ROC > 0 (positive momentum)
• Close > VWMA (above volume-weighted average)
SELL SIGNAL generates when ALL conditions are met:
• Smoothed price < Moving Average (downward price trend)
• PVT < PVT Average (volume supporting downtrend)
• ROC < 0 (negative momentum)
• Close < VWMA (below volume-weighted average)
This multi-factor approach filters out weak signals and waits for
strong convergence before generating alerts.
RISK CALCULATION:
Stop Loss = Entry ± (ATR × SL Multiplier)
• Uses Average True Range for volatility measurement
• Automatically adjusts to market conditions
Take Profit Levels = Entry ± (Risk Distance × TP Multiplier × Level)
• Risk Distance = |Entry - Stop Loss|
• Creates risk-reward based targets
• Example: TP Multiplier 1.0 = 1:1, 2:2, 3:3 risk-reward
⚠️ NOTE: All risk levels are VISUAL REFERENCES for educational study.
They do not execute trades automatically.
⚙️ SETTINGS GUIDE
═══════════════════════════════════════════════════════════════════
SIGNAL SETTINGS:
• Signal Length (14): Main calculation period for averages
• Smooth Length (8): Price data smoothing period
• PVT Length (14): Price Volume Trend calculation period
• ROC Length (9): Rate of Change momentum period
RISK MANAGEMENT (Visual Only):
• ATR Length (14): Volatility measurement lookback
• SL Multiplier (2.2): Stop loss distance (× ATR)
• TP Multiplier (1.0): Risk-reward ratio per TP level
• TP Levels (1-5): Number of take profit targets to display
• Show TP/SL Lines: Toggle visual reference lines
SUPPORT & RESISTANCE:
• Pivot Lookback (10): Sensitivity for S/R detection
• Show SR: Toggle support/resistance lines
VWMA BANDS:
• VWMA Length (20): Volume-weighted average period
• Show Bands: Toggle band visibility
TREND DETECTION:
• Trend Threshold (5): Consecutive bars required for trend
PRICE LINES:
• Period (20): High/low calculation lookback
• Show: Toggle price range visualization
DISPLAY OPTIONS:
• Signals: Show/hide BUY/SELL labels
• Table: Show/hide information panel
• Color Bars: Enable trend-based bar coloring
ALERTS:
• Enable: Activate alert notifications for signals
💡 USAGE INSTRUCTIONS
═══════════════════════════════════════════════════════════════════
RECOMMENDED APPROACH:
• Works on all timeframes (1m to Monthly)
• Suitable for all markets (Stocks, Forex, Crypto, etc.)
• Best used with additional analysis and confirmation
• Always practice proper risk management
ENTRY STRATEGY:
1. Wait for BUY or SELL signal to appear
2. Check trend table for trend confirmation
3. Verify VWMA band color matches signal direction
4. Look for nearby support/resistance confluence
5. Consider entering on next candle open
6. Use visual SL level for risk management
EXIT STRATEGY:
1. Use TP levels as potential exit zones
2. Consider scaling out at multiple TP levels
3. Exit on opposite signal
4. Adjust stops as trade progresses
5. Account for spread and slippage
TREND TRADING:
• "Up Trend" → Focus on BUY signals
• "Down Trend" → Focus on SELL signals
• "Ranging" → Wait for clear trend or use range strategies
🎨 VISUAL ELEMENTS
═══════════════════════════════════════════════════════════════════
• GREEN VWMA BANDS → Bullish trend indication
• RED VWMA BANDS → Bearish trend indication
• ORANGE DASHED LINE → Entry price reference
• RED SOLID LINE → Stop loss level
• GREEN DOTTED LINES → Take profit targets
• RED DASHED LINES → Resistance levels
• GREEN DASHED LINES → Support levels
• GREY FILLED AREA → Price high/low range
• GREEN BUY LABEL → Long signal
• RED SELL LABEL → Short signal
• BLUE INFO TABLE → Current trade details
• GREEN/RED BARS → Trend direction (optional)
⚠️ IMPORTANT NOTES
═══════════════════════════════════════════════════════════════════
RISK WARNING:
• Trading involves substantial risk of loss
• You can lose more than your initial investment
• Past performance does not guarantee future results
• No indicator is 100% accurate
• Always use proper position sizing
• Never risk more than you can afford to lose
EDUCATIONAL PURPOSE:
• This tool is for learning and research
• Not a complete trading system
• Should be combined with other analysis
• Requires interpretation and context
• Test thoroughly before live use
• Consider consulting a financial advisor
TECHNICAL LIMITATIONS:
• Signals lag price action (all indicators lag)
• False signals occur in choppy markets
• Works better in trending conditions
• Support/resistance levels are approximate
• TP/SL levels are suggestions, not guarantees
📚 METHODOLOGY
═══════════════════════════════════════════════════════════════════
This indicator combines established technical analysis concepts:
• Price Volume Trend (PVT): Volume-weighted price momentum
• Rate of Change (ROC): Momentum measurement
• Volume-Weighted Moving Average (VWMA): Trend identification
• Average True Range (ATR): Volatility measurement (J. Welles Wilder)
• Pivot Points: Support/resistance detection
All methods are based on publicly available technical analysis
principles. No proprietary or "secret" algorithms are used.
⚖️ FULL DISCLAIMER
═══════════════════════════════════════════════════════════════════
LIABILITY:
The creator (Zakaria Safri) assumes NO liability for:
• Trading losses or damages of any kind
• Loss of capital or profits
• Incorrect signal interpretation
• Technical issues, bugs, or errors
• Any consequences of using this tool
USER RESPONSIBILITY:
By using this indicator, you acknowledge that:
• You are solely responsible for your trading decisions
• You understand the substantial risks involved
• You will not hold the creator liable for losses
• You will conduct your own research and analysis
• You may consult a licensed financial professional
• You are using this tool entirely at your own risk
AS-IS PROVISION:
This indicator is provided "AS IS" without warranty of any kind,
express or implied, including but not limited to warranties of
merchantability, fitness for a particular purpose, or non-infringement.
The creator is not a registered investment advisor, financial planner,
or broker-dealer. This tool is not approved or endorsed by any
financial authority.
📞 ABOUT THE CREATOR
═══════════════════════════════════════════════════════════════════
Created by: Zakaria Safri
Specialization: Technical analysis indicator development
Focus: Multi-factor analysis, risk visualization, trend detection
This is an educational tool designed to demonstrate technical
analysis concepts and multi-factor signal generation methods.
📋 VERSION INFO
═══════════════════════════════════════════════════════════════════
Version: 1.0
Platform: TradingView Pine Script v5
License: Mozilla Public License 2.0
Creator: Zakaria Safri
Year: 2024
═══════════════════════════════════════════════════════════════════
Study Carefully, Trade Wisely, Manage Risk Properly
TradeVision Pro - Educational Trading Tool
Created by Zakaria Safri
═══════════════════════════════════════════════════════════════════

CVD Candles + Divergence (Pane) [NIRALA]This indicator provides a powerful way to analyze market dynamics by visualizing Cumulative Volume Delta (CVD) as candlesticks and automatically detecting divergences between price and order flow. It is designed to help traders spot potential trend exhaustion and reversals that may not be apparent from price action alone.
Key Concepts
Cumulative Volume Delta (CVD): CVD is a running total of the difference between buying and selling volume from market orders. A rising CVD indicates aggressive buying, while a falling CVD indicates aggressive selling. Unlike price, which can be influenced by passive limit orders, CVD shows the raw intent of aggressive market participants.
Divergence: A divergence occurs when price and CVD move in opposite directions. This signals a potential conflict between price action and the underlying order flow, often preceding a reversal.
Bearish Divergence: Price makes a new high, but CVD fails to make a new high (or makes a lower high). This suggests buying aggression is weakening despite the higher price, and a reversal to the downside may be imminent.
Bullish Divergence: Price makes a new low, but CVD fails to make a new low (or makes a higher low). This suggests selling pressure is drying up, and a reversal to the upside may be coming.
Features
CVD as Candlesticks: Plots CVD in a familiar OHLC candlestick format in a separate pane, providing a more intuitive view of order flow momentum and volatility compared to a simple line.
Automatic Divergence Detection: The script automatically identifies classic bullish and bearish divergences between price pivots and CVD pivots, drawing lines on both the main price chart and the indicator pane to clearly highlight them.
Multi-Timeframe Analysis: Calculates CVD from a user-defined lower timeframe, offering a more granular and precise view of the order flow that builds up a single candle on your chart.
Customizable Pivot Lookbacks: Allows you to adjust the sensitivity of the pivot detection for finding both short-term and long-term divergences.
Alerts: Includes built-in alerts that can notify you when a new bullish or bearish divergence is confirmed.
How to Use
Look for High-Probability Setups: This indicator is most powerful when its signals appear at key areas of support or resistance. A divergence at a major price level is a much stronger signal than one in the middle of a range.
Confirm with Price Action: Do not trade on a divergence signal alone. Wait for a confirmation candle (e.g., a bearish engulfing candle after a bearish divergence, or a bullish hammer after a bullish divergence) before considering an entry.
Combine with Your Strategy: Use this indicator as a confirmation tool to enhance your existing trading strategy. For example, if your primary strategy gives a sell signal and this indicator simultaneously prints a bearish divergence, it significantly increases the probability of the trade.
This tool is designed for discretionary traders looking to add a layer of order flow analysis to their decision-making process.
Multi Timeframe Market Structure ContinuationOverview
This indicator identifies Break of Structure (BOS) and Change of Character (ChoCh) patterns using multi-timeframe (MTF) analysis to filter high-probability trade setups. By aligning lower timeframe signals with higher timeframe bias, it helps traders enter positions in the direction of the dominant trend while avoiding counter-trend traps.
Multi-Timeframe Analysis
The indicator analyzes market structure on two timeframes simultaneously:
Current Timeframe (CTF): Detects immediate BOS and ChoCh signals for entry timing
Higher Timeframe (HTF): Establishes the overall trend direction (default: 1H, customizable)
Signals only appear when the current timeframe structure aligns with the higher timeframe bias, ensuring you're trading with the momentum, not against it.
Break of Structure (BOS)
BOS signals indicate trend continuation - when price breaks a previous high in an uptrend or a previous low in a downtrend. These are reliable entries that confirm the trend is still active and strong.
Change of Character (ChoCh)
ChoCh signals mark early trend reversals - when market structure shifts from bearish to bullish (or vice versa). When captured in alignment with the higher timeframe trend, ChoCh entries can achieve exceptional risk-to-reward ratios as they allow entry near the beginning of a new impulse move.
Exit Signals
Exit signals are plotted when a ChoCh occurs in the opposite direction of the HTF trend. For example, if the HTF is bullish and a bearish ChoCh forms on the current timeframe, an orange "EXIT" signal appears - warning long traders that the lower timeframe structure is shifting against them. This provides an early warning system to protect profits or minimize losses before the HTF trend itself reverses.
Trading Strategy Recommendations
Trending Markets (Recommended)
In strong trending conditions, both BOS and ChoCh signals can be taken when aligned with the HTF bias. ChoCh entries are particularly powerful as they catch early reversals within the larger trend, offering entries with tight stop losses and extended profit targets.
Ranging Markets
During consolidation or choppy conditions, it's best to be selective and take only BOS entries. BOS signals confirm that the trend is continuing beyond the range, reducing false breakouts and whipsaw trades that are common with counter-trend ChoCh signals in sideways markets.
Customization
Pivot Length: Adjust the sensitivity of structure detection (default: 5). Lower values detect structure more frequently with earlier but potentially noisier signals. Higher values provide cleaner, more significant structural breaks but with some delay.
Higher Timeframe: Customize the HTF to suit your trading style. Day traders might use 1H HTF on 5m charts, while swing traders could use 4H or Daily HTF.
Alert System
Six alert conditions available:
Long BOS Entry / Long ChoCh Entry
Short BOS Entry / Short ChoCh Entry
Long Exit / Short Exit
All alerts fire only on confirmed candle closes to eliminate repainting and false signals.
Visual Features
Color-coded background showing HTF bias
Clear BOS/ChoCh labels with horizontal lines at structure levels
Orange "EXIT" signals when structure breaks against your position
Gray lines tracking current swing highs/lows
HTF trend indicator in the top-right corner
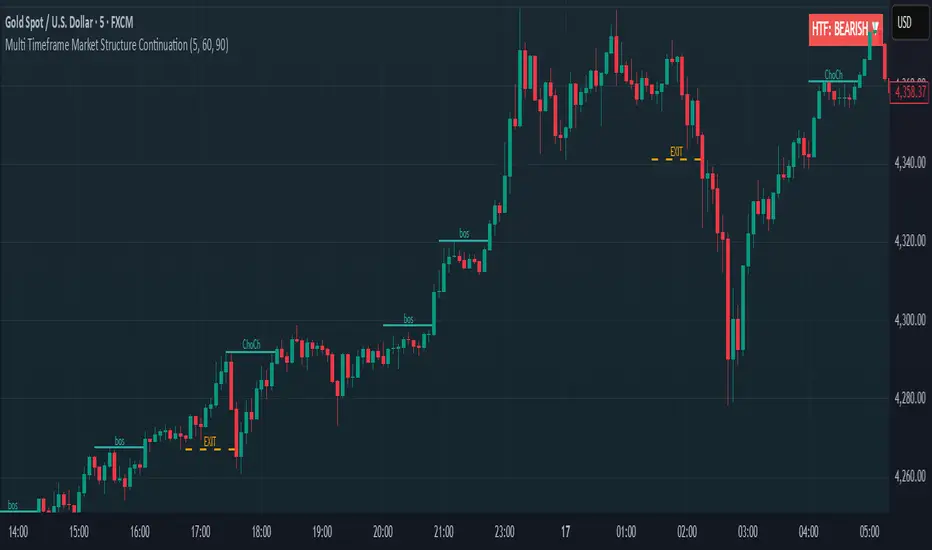
Dynamic ATR BandsDescription:
The Dynamic ATR Bands indicator visualizes ATR-based stop-loss, take-profit, and trailing levels. Bands can be drawn relative to a fixed entry price or dynamically relative to the current price. It is ideal for trend-following, swing trading, and hybrid strategies, especially on volatile or noisy instruments.
Key Features:
Base ATR Bands:
Plots ATR-based bands above and below a reference price.
Acts as initial stop-loss or target guidance.
Adjustable multiplier (default 1× ATR).
Extra ATR Band:
Add an additional ATR band at a custom multiplier.
Position it above or below the reference price.
Useful for trailing stops or extended profit targets.
Hybrid Entry Mode:
Use Fixed Entry Price: bands are drawn relative to your entry and remain fixed.
Dynamic Mode: bands behave like standard ATR bands, moving with the current price.
Allows visualization of hybrid ATR stop-loss and trailing strategies.
Clean Visuals:
Color-coded bands differentiate base (solid) from extra (semi-transparent).
How to Use:
Set ATR length and multipliers according to your strategy.
Toggle hybrid entry mode and input your entry price, or leave off for dynamic bands.
Set the extra band multiplier and choose its position (upper/lower).
Use the bands as visual guides for stop-loss, take-profit, and trailing levels.
Inputs:
ATR Length: number of periods for ATR calculation
Base ATR Multiplier: distance of base bands from reference price
Extra ATR Multiplier: distance for the additional band
Extra Band Position: choose Upper or Lower
Use Fixed Entry Price: toggle hybrid entry mode
Entry Price: specify entry price if hybrid mode is enabled
Note:
This script is visual only; it does not place trades. It is designed to help plan ATR-based stop-loss, take-profit, and hybrid trade management visually on the chart.

Daytrade Forex Scalper TwinPulse Auction Timer IndicatorWhat this indicator is
TwinPulse Auction Timer is a multi component execution aid designed for liquid markets. It looks for two families of opportunities
Breakouts that leave a compression area after a fresh sweep
Reversals that trigger after a sweep with strong wick polarity
It does not try to predict future prices. It measures present auction conditions with transparent rules and shows you when those conditions align. You get a simple table that says LONG SHORT or WAIT, optional session shading, clean entry and exit level visuals, and alerts you can wire to your workflow.
Why it is different
Most tools show a single signal. TwinPulse combines several independent signals into an Edge Score that you can tune. The components are
• Pulse. A signed measure of wick asymmetry with candle body direction
• Compression. Current true range compared with an average range
• Sweep timer. Bars elapsed since the most recent sweep of a prior high or low
• Bias. Direction of a higher timeframe candle
• Regime. Efficiency ratio and the relation of micro to macro volatility
• Location. Distance from the daily anchored VWAP
• Session. London and New York filter by time windows
Each component is visible in the inputs and in the table so you can understand why a suggestion appears. The script uses request.security() with lookahead off in all calls so it does not peek into the future. Shapes may move while a bar is open since price is still forming. They stop moving when the bar closes.
What you will see on the chart
• L and S shapes on entry bars
• An Exit shape at the price where a stop or the runner target would have been hit
• Four horizontal lines while a trade is active
Entry
Stop
TP1 at one R
TP2 at the runner target expressed in R
• Labels anchored to each line so you can instantly read Entry SL TP1 and TP2 with current values
• Optional shading during your session windows
• Optional daily VWAP line
The table in the top right shows
Action LONG SHORT IN LONG IN SHORT or WAIT
Session ON or OFF
Bias UP DOWN or FLAT
Pulse value
Compression value
Edge L percent and Edge S percent
How it works in detail
Pulse
For each bar the script measures up wick minus down wick divided by range and multiplies that by the sign of the candle body. The result is averaged with pulse_len. Positive numbers indicate aggressive buying. Negative numbers indicate aggressive selling. You control the minimum absolute value with pulse_thr.
Compression
Compression is the ratio of current range to an average range. You can choose the range basis. HL SMA uses simple high minus low smoothed by range_len. ATR uses classic True Range smoothed by atr_len. Values below comp_thr indicate a coil.
Sweeps and the timer
A sweep occurs when price trades beyond the highest high or lowest low seen in the previous sweep_len bars. A strict sweep requires a close back inside that prior range. The timer measures how many bars have elapsed since the last sweep. Breakout setups require the timer to exceed timer_thr.
Bias on a confirmation timeframe
A higher timeframe candle is read with confirm_tf. If close is above open bias is UP. If close is below open bias is DOWN. This keeps breakouts aligned with the prevailing drift.
Regime filters
Efficiency ratio measures the straight line change over the sum of absolute bar to bar changes over er_len. It rises in trendy conditions and falls in noise. Minimum efficiency is controlled by er_min.
Micro to macro volatility ratio compares a short lookback average range with a longer lookback average range using your chosen basis. For breakouts you usually want micro volatility to be near or above macro hence mvr_min. For reversals you often want micro volatility that is not overheated relative to macro hence mvr_max_rev.
VWAP distance gate
Daily anchored VWAP is rebuilt from the open of each session. The script computes the absolute distance from VWAP in units of your average range and requires that distance to exceed vwap_dist_thr when use_vwap_gate is true. This keeps entries away from the mean.
Edge Score
Each gate contributes a weight that you control. The script sums weights of the satisfied gates and divides by the sum of all weights to produce an Edge percent for long and an Edge percent for short. You can then require a minimum Edge percent using edge_min_pct. This turns the indicator into a step by step checklist that you can tune to your taste.
Using the indicator step by step
Choose markets and timeframes
The logic is designed for liquid instruments. Major currency pairs, index futures and cash index CFDs, and the most liquid crypto pairs work well. On intraday use one to fifteen minutes for signals and fifteen to sixty minutes for confirmation. On swing use one hour to one day for signals and one day for confirmation.
Decide on entry mode
Breakouts require a compression area and a sweep timer. Reversals require a strict sweep and a strong pulse. If you are unsure leave the default which allows both.
Pick a range basis
For FX and crypto HL SMA is often stable. For indices and single name equities with gaps ATR can adapt better. If results look too reactive increase the window. If results are too slow reduce it.
Tune regime filters
If you trade trend continuation raise er_min and mvr_min. If you trade counter rotation lower them and rely on the reversal path with the strict sweep condition.
Set the VWAP gate
Enabling it helps you avoid entries at the mean. Push the threshold higher on range bound days. Reduce it in strong trend days.
Table driven decision
Watch Action and the Edge percents. If the script says WAIT you can read Pulse and Compression to see what is missing. Often the best trades appear when both Edge percents are well separated and your session switch is ON.
Use the visuals
When a suggestion triggers you will see entry stop and targets. You can mirror the levels in your own workflow or use alerts.
Consider bar close
Signals are computed in real time. For a strict process you can wait until the bar closes to reduce noise.
Inputs explained with quick guidance
Setup
Signal TF chooses where the logic is computed. Leave blank to use the chart.
Confirm TF sets the higher timeframe for bias.
Session filter restricts signals to the London and New York windows you specify.
Invert flips long and short. It is useful on inverse instruments.
Logic options
Entry mode allows Breakouts Reversals or Both.
Average range basis selects HL SMA or ATR.
ATR length is used when ATR is selected.
Pulse source can be Regular OHLC or Heikin Ashi. Heikin Ashi smooths noisy series, but the script still runs on regular bars and you should publish and use it on standard candles to respect the platform guidance.
Core numeric settings
Sweep lookback controls the size of the liquidity pool targeted by the sweep condition.
Pulse window smooths the wick polarity measure.
Average range window controls your base range when you use HL SMA.
Pulse threshold sets the minimum polarity required.
Compression threshold sets the maximum current range relative to average to consider the market coiled.
Expansion timer bars sets how much time has passed since the last sweep before you allow a breakout.
Regime filters
Efficiency ratio length and minimum value keep you out of aimless drift.
Micro and Macro range lengths feed the micro to macro ratio.
Minimum micro to macro for breakouts and maximum micro to macro for reversals steer the two entry families.
VWAP gate and distance threshold keep you away from the mean.
Levels and trade management visuals
Runner target in R sets TP2 as a multiple of initial risk.
Stop distance as average range multiple sets initial risk size for the visuals.
Move stop to entry after one R touch turns on break even logic once price has traveled one risk unit.
Trail buffer as R fraction uses the last sweep as an anchor and keeps a dynamic stop at a chosen fraction of R beyond it.
Cooldown after exit prevents immediate re entries.
Edge Score
Weights for pulse compression timer bias efficiency ratio micro to macro VWAP gate and session let you align the checklist with your style.
Minimum Edge percent to suggest applies a final filter to LONG or SHORT suggestions.
UI
Table and markers switch the compact dashboard and the shapes.
TP and SL lines and labels draw and name each level.
TP1 partial label percent is printed in the TP1 label for clarity.
Session shading helps with focus.
Daily VWAP line is optional.
Alerts
The script provides alerts for Long Short Exit and for Edge percent crossing the threshold on either side. Use them to drive notifications or to sync with webhooks and your broker integration. Alerts trigger in real time and will repaint during a bar. For conservative use trigger on bar close.
Recommended presets
Intraday trend continuation
Confirm TF fifteen minutes
Entry mode Breakouts
Range basis HL SMA
Pulse threshold near 0.10
Compression threshold near 0.60
Timer around 18
Minimum efficiency ratio near 0.20
Minimum micro to macro near 1.00
VWAP gate enabled with distance near 0.35
Edge minimum 50 or higher
Intraday mean reversion at sweeps
Entry mode Reversals
Pulse source Regular OHLC
Compression threshold can be a little higher
Maximum micro to macro near 1.60
Efficiency ratio minimum lower near 0.12
VWAP gate enabled
Edge minimum 40 to 60
Swing trend continuation
Signal TF one hour
Confirm TF one day
Range basis ATR
ATR length around 14
Average range window 20 to 30
Efficiency ratio minimum near 0.18
Micro to macro windows 12 and 60
Edge minimum 50 to 70
These are starting points only. Your instrument and timeframe will require small adjustments.
Limitations and honest warnings
No indicator is perfect. TwinPulse will mark attractive conditions that do not always lead to profitable trades. During economic releases or very thin liquidity the assumptions behind compression and sweeps may fail. In strong gap environments the HL SMA basis may lag while ATR may overreact. Heikin Ashi pulse can help in choppy markets but it will lag during sharp reversals. Session times use the exchange time of your chart. If you switch symbol or exchange verify the windows.
Edge percent is not a probability of profit. It is the fraction of satisfied gates with your chosen weights. Two traders can set different weights and see different Edge readings on the same bar. That is the design. The score is a guide that helps you act with discipline.
This indicator does not place orders or manage real risk. The lines and labels show a model entry a model stop and two model targets built from the average range at entry and from recent swing points. Use them as references and not as hard rules. Always test on historical data and demo first. Past results do not guarantee anything in the future.
Credits and originality
All code in this publication is original and written for this indicator. The concept of the efficiency ratio originates from Perry Kaufman. The use of a daily anchored volume weighted average price is a standard industry tool. The specific combination of pulse from wick polarity strict sweep timing compression and the tunable Edge Score is unique to this script at the time of publication. If you reuse parts of the open source code in your own work remember to credit the author and contribute meaningful improvements.
How to read the table at a glance
Action reflects your current state.
IN LONG or IN SHORT appears while a trade is active.
LONG or SHORT appears when conditions for entry are met and the Edge threshold is satisfied.
WAIT appears when at least one gate is missing.
Session shows ON during your chosen windows.
Bias shows the color of the confirmation candle.
Pulse is the smoothed polarity number.
Comp shows current range divided by the average range. Values below one mean compression.
Edge L percent and Edge S percent show the long and short checklists as percents.
Final thoughts
Markets move because orders accumulate at certain prices and at certain times. The indicator tries to measure two things that often matter at those turning points. One is the existence of a hidden imbalance revealed by wick polarity and by sweeps of prior extremes. The other is the presence of energy stored in a coil that can release in the direction of a drift. Neither force guarantees profit. Together they can improve your selection and your timing.
Use the defaults for a few days so you learn the personality of the signals. After that adjust one group at a time. Start with the session filter and the Edge threshold. Then tune compression and the timer. Finally adjust the regime filters. Keep notes. You will learn which weights matter for your market and timeframe. The result is a process you can apply with consistency.
Disclaimer
This script and description are for education and analysis. They are not investment advice and they do not promise future results. Use at your own risk. Test thoroughly on historical data and in simulation before considering any live use.
