Consecutive Bars Above/Below EMA Buy the Dip Strategy█ STRATEGY DESCRIPTION
The "Consecutive Bars Above/Below EMA Buy the Dip Strategy" is a mean-reversion strategy designed to identify potential buying opportunities when the price dips below a moving average for a specified number of consecutive bars. It enters a long position when the dip condition is met and exits when the price shows strength by exceeding the previous bar's high. This strategy is suitable for use on various timeframes.
█ WHAT IS THE MOVING AVERAGE?
The strategy uses either a Simple Moving Average (SMA) or an Exponential Moving Average (EMA) as a reference for identifying dips. The type and length of the moving average can be customized in the settings.
█ SIGNAL GENERATION
1. LONG ENTRY
A Buy Signal is triggered when:
The close price is below the selected moving average for a specified number of consecutive bars (`consecutiveBarsTreshold`).
The signal occurs within the specified time window (between `Start Time` and `End Time`).
2. EXIT CONDITION
A Sell Signal is generated when the current closing price exceeds the high of the previous bar (`close > high `). This indicates that the price has shown strength, potentially confirming the reversal and prompting the strategy to exit the position.
█ ADDITIONAL SETTINGS
Consecutive Bars Threshold: The number of consecutive bars the price must remain below the moving average to trigger a Buy Signal. Default is 3.
MA Type: The type of moving average used (SMA or EMA). Default is SMA.
MA Length: The length of the moving average. Default is 5.
Start Time and End Time: The time window during which the strategy is allowed to execute trades.
█ PERFORMANCE OVERVIEW
This strategy is designed for mean-reverting markets and performs best when the price frequently oscillates around the moving average.
It is sensitive to the number of consecutive bars below the moving average, which helps to identify potential dips.
Backtesting results should be analysed to optimize the Consecutive Bars Threshold, MA Type, and MA Length for specific instruments.
In den Scripts nach "ema" suchen

NNFX RSI EMA FVMA MACD ALGOThis Pine Script introduces a cutting-edge trading strategy that seamlessly integrates multiple technical indicators—namely, the Flexible Variable Moving Average ( FVMA ), Relative Strength Index ( RSI ), Moving Average Convergence Divergence ( MACD ), and Exponential Moving Average ( EMA )—to deliver a sophisticated trading experience. This script stands out due to its comprehensive approach, robust risk management, and the inclusion of crucial data tables for various timeframes, making it an invaluable tool for traders seeking to enhance their market performance.
Originality of the Strategy:
The originality of this script lies in its unique combination of multiple powerful indicators, enabling traders to benefit from diverse perspectives on market dynamics. This mashup enhances decision-making processes, providing multiple layers of confirmation for trade entries and exits. The strategy is designed to offer an innovative solution for traders looking to improve their performance through well-defined rules and a solid framework.
Flexible Variable Moving Average (FVMA):
The FVMA adapts dynamically to market conditions, offering a more responsive trend line than traditional moving averages. This flexibility allows for quick identification of trends and reversals, crucial for fast-paced trading environments.
Exponential Moving Average (EMA):
By giving greater weight to recent price data, the EMA enhances sensitivity to price changes, allowing for more accurate entries and exits when used alongside the FVMA. This combination maximizes the effectiveness of the strategy in identifying optimal trading opportunities.
Relative Strength Index (RSI):
The RSI helps identify overbought or oversold conditions, integrating seamlessly with other indicators to enhance the strategy's ability to pinpoint potential reversal points. This aspect of the strategy ensures that traders can make informed decisions based on market momentum.
Moving Average Convergence Divergence (MACD):
The MACD serves as an essential confirmation tool, providing insights into trend strength and momentum. This enhances the accuracy of entry and exit signals, allowing traders to make more informed decisions based on robust technical analysis.
Multi-Take Profit (TP) and Stop Loss (SL) Levels:
The strategy supports multiple TPs, allowing traders to lock in profits at various levels while effectively managing risk through a robust SL system. This flexibility caters to diverse trading styles and risk profiles, ensuring that the strategy can adapt to individual trader needs.
Default Properties:
Take Profit Levels: TP1 is set to 2.0, and TP2 is set to 2.9, which is designed to enhance profit potential while maintaining a solid risk-reward ratio.
Stop Loss: A SL is set at 2% of the 5% account balance, which helps to preserve capital and manage risk effectively, adhering to the guideline of not risking more than 5-10% of the account balance per trade.
Labeling System for Exits: Automatic labeling of TP and SL exits on the chart provides clear visualization of trading outcomes. This feature supports informed decision-making and performance tracking, aligning with the guideline of providing transparent results.
Custom Alerts System:
The inclusion of customizable alerts for trade entries, exits, and SL/TP hits keeps traders informed in real-time, enabling prompt actions without constant market monitoring. This is crucial for effective trade management and helps traders respond quickly to market changes.
API Boxes for Automated Trading:
The strategy features API boxes, allowing traders to set up automated trading based on indicator signals. This functionality enables seamless integration with trading platforms, enhancing efficiency and streamlining the trading process, which is particularly valuable for traders looking to optimize their execution.
Data Tables for Enhanced Analysis:
The script includes data tables displaying critical insights across various timeframes: 2-hour, daily, weekly, and monthly. These tables provide a comprehensive overview of market conditions, allowing traders to analyze trends and make informed decisions based on a broad spectrum of data. By leveraging this information, traders can identify high-probability setups and align their strategies with prevailing market trends, significantly increasing their chances of success.
Default Properties:
Initial Capital: £1,000, ensuring a realistic starting point for traders.
Risk per Trade: 5% of the account balance, promoting sustainable trading practices.
Commission: 0.1%, reflecting realistic transaction costs that traders may encounter.
Slippage: 1%, accounting for potential market volatility during trade execution.
Take Profit Levels:
TP1: 2.0
TP2: 2.9
Stop Loss (SL): 2% of the 5% account balance, which is well within acceptable risk parameters.
Compliance with TradingView Guidelines:
This script fully complies with TradingView's guidelines, specifically:
Strategy Results:
The strategy is designed to publish backtesting results that do not mislead traders. The realistic parameters outlined in the default properties ensure that traders have a clear understanding of potential outcomes.
The dataset used for backtesting has sufficient trades to produce a reliable sample size, aligning with the guideline of ideally having more than 100 trades.
Any deviations from recommended practices are justified in the script description, ensuring transparency and adherence to best practices.
The script explains the default properties in detail, providing a thorough understanding of how these settings influence performance.
Why This Script is Worth Paying For:
This Pine Script offers an unparalleled trading experience through its unique combination of technical indicators, comprehensive trade management features, and detailed data tables for multiple timeframes. Here are compelling reasons to invest in this strategy:
Holistic Approach: The integration of multiple indicators ensures a well-rounded perspective on market conditions, increasing the likelihood of successful trades.
Advanced Risk Management: The flexibility of multiple TPs and SLs empowers traders to tailor their risk profiles according to individual strategies, enhancing overall profitability.
Automated Trading Capability: The inclusion of API boxes for automated trading streamlines execution, allowing traders to capitalize on opportunities without the need for manual intervention.
Comprehensive Data Analysis: The detailed data tables provide invaluable insights across different timeframes, enabling traders to make informed decisions based on robust market analysis.
In summary, this innovative Pine Script represents a powerful tool designed to empower traders at all levels. Its originality, synergistic functionality, and comprehensive features create a dynamic and effective trading environment, justifying its value and positioning it as a must-have for anyone serious about achieving consistent trading success.

Smoothed Heiken Ashi Strategy Long OnlyThis is a trend-following approach that uses a modified version of Heiken Ashi candles with additional smoothing. Here are the key components and features:
1. Heiken Ashi Modification: The strategy starts by calculating Heiken Ashi candles, which are known for better trend visualization. However, it modifies the traditional Heiken Ashi by using Exponential Moving Averages (EMAs) of the open, high, low, and close prices.
2. Double Smoothing: The strategy applies two layers of smoothing. First, it uses EMAs to calculate the Heiken Ashi values. Then, it applies another EMA to the Heiken Ashi open and close prices. This double smoothing aims to reduce noise and provide clearer trend signals.
3. Long-Only Approach: As the name suggests, this strategy only takes long positions. It doesn't short the market during downtrends but instead exits existing long positions when the sell signal is triggered.
4. Entry and Exit Conditions:
- Entry (Buy): When the smoothed Heiken Ashi candle color changes from red to green (indicating a potential start of an uptrend).
- Exit (Sell): When the smoothed Heiken Ashi candle color changes from green to red (indicating a potential end of an uptrend).
5. Position Sizing: The strategy uses a percentage of equity for position sizing, defaulting to 100% of available equity per trade. This should be tailored to each persons unique approach. Responsible trading would use less than 5% for each trade. The starting capital used is a responsible and conservative $1000, reflecting the average trader.
This strategy aims to provide a smooth, trend-following approach that may be particularly useful in markets with clear, sustained trends. However, it may lag in choppy or ranging markets due to its heavy smoothing. As with any strategy, it's important to thoroughly backtest and forward test before using it with real capital, and to consider using it in conjunction with other analysis tools and risk management techniques.
This has been created mainly to provide data to judge what time frame is most profitable for any single asset, as the volatility of each asset is different. This can bee seen using it on AUXUSD, which has a higher profitable result on the daily time frame, whereas other currencies need a higher or lower time frame. The user can toggle between each time frame and watch for the higher profit results within the strategy tester window.
Other smoothed Heiken Ashi indicators also do not provide buy and sell signals, and only show the change in color to dictate a change in trend. By adding buy and sell signals after the close of the candle in which the candle changes color, alerts can be programmed, which helps this be a more hands off protocol to experiment with. Other smoothed Heiken Ashi indicators do not allow for alarms to be set.
This is a unique HODL strategy which helps identify a change in trend, without the noise of day to day volatility. By switching to a line chart, it removes the candles altogether to avoid even more noise. The goal is to HODL a coin while the color is bullish in an uptrend, but once the indicator gives a sell signal, to sell the holdings back to a stable coin and let the chart ride down. Once the chart gives the next buy signal, use that same capital to buy back into the asset. In essence this removes potential losses, and helps buy back in cheaper, gaining more quantitity fo the asset, and therefore reducing your average initial buy in price.
Most HODL strategies ride the price up, miss selling at the top, then riding the price back down in anticipation that it will go back up to sell. This strategy will not hit the absolute tops, but it will greatly reduce potential losses.

Triple EMA + QQE Trend Following Strategy [TradeDots]The "Triple EMA + QQE Trend Following Strategy" harnesses the power of two sophisticated technical indicators, the Triple Exponential Moving Average (TEMA) and the Qualitative Quantitative Estimation (QQE), to generate precise buy and sell signals. This strategy excels in capturing shifts in trends by identifying short-term price momentum and dynamic overbought or oversold conditions.
HOW IT WORKS
This strategy integrates two pivotal indicators:
Triple Exponential Moving Average (TEMA): TEMA enhances traditional moving averages by reducing lag and smoothing the data more effectively. It achieves this by applying the EMA formula three times onto the price, as follows:
tema(src, length) =>
ema1 = ta.ema(src, length)
ema2 = ta.ema(ema1, length)
ema3 = ta.ema(ema2, length)
tema = 3*ema1 - 3*ema2 + ema3
This computation helps to sharpen the sensitivity to price movements.
Qualitative Quantitative Estimation (QQE): The QQE indicator improves upon the standard RSI by incorporating a smoothing mechanism. It starts with the standard RSI, overlays a 5-period EMA on this RSI, and then enhances the result using a double application of a 27-period EMA. A slow trailing line is then derived by multiplying the result with a factor number. This approach establishes a more refined and less jittery trend-following signal, complementing the TEMA to enhance overall market timing during fluctuating conditions.
APPLICATION
Referenced from insights on "Trading Tact," the strategy implementation follows:
First of all, we utilize two TEMA lines: one set at a 20-period and the other at a 40-period. Then following the rules below:
40-period TEMA is rising
20-period TEMA is above 40-period TEMA
Price closes above 20-period TEMA
Today is not Monday
RSI MA crosses the Slow trailing line
This strategy does not employ an active take profit mechanism; instead, it utilizes a trailing stop loss to allow the price to reach the stop loss naturally, thereby maximizing potential profit margins.
DEFAULT SETUP
Commission: 0.01%
Initial Capital: $10,000
Equity per Trade: 80%
Users are advised to adjust and personalize this trading strategy to better match their individual trading preferences and style.
RISK DISCLAIMER
Trading entails substantial risk, and most day traders incur losses. All content, tools, scripts, articles, and education provided by TradeDots serve purely informational and educational purposes. Past performances are not definitive predictors of future results.
Reference:
Trading Tact. What Is the QQE Indicator? Retrieved from: tradingtact.com

INFINITY ALGO🆕Meet the updated version of our flagship indicator, now it's INFINITY ALGO!
🏃🏻 QUICK START
In very simple terms, our indicator generates complex trading signals on your chart (buy/sell), including Entry Point, Take Profit levels, Stop Loss level
To start, you need to add our indicator to your chart , choose a timeframe (we recommend 13min,15min and 4h but you can try any, these only have the best results) and set up notifications (how to do it told below) and that's it, you can work with it even without changing the settings!
Of course, to improve the accuracy of signals you will have to choose the optimal settings of the script for each trading pair and timeframe (you can find a guide below)
📊 SIGNALS
This script will generate complex trading recommendations, both Long and Short (signals); signals include:
- Entry Point:
Calculated based on pivot levels with confirmation by EMA/SMA (you can select this in the settings); also bullish/bearish cup is checked to confirm the entry.
Additionally, in the settings you can enable Heiken Ashi calculation mode (it shows much better on some trading pairs).
Why do we mashup these components and how they work together?
- The main indicator in our script is pivot levels, it is enabled by default and cannot be disabled. Auxiliary indicators (which you can switch on and off in the script settings) are EMA/SMA and Heiken Ashi. We have used pivot levels, which mark potential support and resistance zones based on previous price action. We have also used EMA/SMA that smooth out price fluctuations and show the direction of the trend. We have added an option to use Heiken Ashi that filters out noise and highlights the trend. We have also checked for bullish/bearish cup patterns, which are reversal patterns that indicate a change in momentum. By combining these indicators, we have created a more robust entry point that considers multiple factors such as price levels, trend, noise, and momentum.
- 6 Take Profit levels:
It is also possible to change in the settings (It is also possible to change the values for Short or Long positions separately), it will be fixed values in % (The default Take Profits for Long&Short are as follows: TP1-0.3%; TP2-1%; TP3-2%; TP4-3%; TP5-7.5%; TP6-16.5%)
- Stop Loss Level:
As with Take Profits, this is a fixed % value that you can customise to suit your risk management needs (It is also possible to change the values for Short or Long positions separately, by default is 4.5% for Long&Short positions)
*When trading on these signals, we strongly recommend that you exit the position in parts at each take profit or close your entire position at one particular take profit. Our script was designed specifically for exiting a position on take profits
⚙️ SETTINGS
Now let's talk about the settings of this script, which allow you to customise the signals quite a lot. In general, we recommend selecting the settings for each trading pair and timeframe separately, this will allow you to achieve better targets accuracy (the default settings are universal, you can trade with them without changing them if you want)
-> IMAGE <-
1. Period - minimum value of 2. Increasing this parameter will increase the accuracy of signals, but will reduce their number (accordingly, lowering the parameter will do the opposite). For the majority of trading pairs and timeframes the optimal period will be between 5 and 10 (the default value is 5).
2. Maximum Breakout length (in bars) - for most trading pairs you can set the value from 200 to 300 and it will be optimal. Below 200 is not recommended
3. T hreshold Rate % - this value also affects the accuracy and the number of signals - the higher this value is, the more often signals will be generated, but it can negatively affect the accuracy. The minimum value is 3, and the maximum value is 10. We recommend to try values in the range from 4 to 7 for most tickers
4. Minimum Number of tests - the number of level checks is required, we recommend to try 2, and only for some timeframes increase to 3
5. MA type & MA filter - The shorter the length of moving averages, the faster they react to trend changes, and show more local trends than global ones. If the length of MAs is longer, more global trends are shown. By default, the most optimal values are set.
By the way, you can ask us for a ready-made preset for any pair and we will be happy to help you!
📄 BACKTESTING
Now let's talk about how to properly test the settings and evaluate their effectiveness. Our script has a c ustom built-in backtester that shows statistics on the current trading pair and allows you to calculate the accuracy of each take profit target, as well as calculate values such as Gross profit/loss, net profit, and the ratio of initial deposit to profit. (you can enable/disable backtester "statistics" label in main settings)
In the main settings you can change the values for: initial deposit (Deposit $), trade size $ and leverage (by the way, it also affects the display of the label "Peak profit", which is calculated with this leverage)
-> IMAGE <-
Now let's look at the backtester - it shows detailed statistics for each Take Profit level, including: accuracy in % and number of trades; gross profit & loss; net profit in % and $ (based on selected settings); deposit to profit ratio in % and $.
Why did we choose such properties in the backtest for publication?
- Well, as the initial capital we took 5000$ and deposit 3% (150$) of the initial capital in each trade. For the fee was taken the value from the exchange Binance, which is 0.06% per trade (Taker + Maker, for a user without VIP on Binance and without taking into account additional fees such as funding, leverage fees, etc).
- Please also take a look at our inbuilt backtester ( IMAGE ) which counts the accuracy to each Take Profit. Also note that our inbuilt backtester does not take any fees into account. Pay attention to the last field "Deposit with Profit" it shows the value if you would close all positions at a certain target. For example, we can see that the most optimal is TP3 at these settings for this trading pair and timeframe, as the deposit to profit ratio will be +61.2%
- Also the script is more designed for swing and long term trading, so on most trading pairs you will be able to see statistics for 60-90 trades dataset
*disclaimer: please note that past results does not guarantee future performance! The accuracy of take profit targets in our backtester is calculated on past results, keep this in mind please
📥 NOTIFICATIONS
We have provided notifications that will deliver the latest signals to you in a convenient format in TradingView. The notification looks like this: It contains the entry point, Take Profits, Stop Loss, and a bit of advice on risk management. -> IMAGE <-
To set up notifications:
1. Select the script settings, trading pair and timeframe
2. Click "add alert on InfinityAlgo", then select "alert () function calls only" in the settings
-> IMAGE <-
3. That's it, now all that's left is to wait for a fresh alert
🔑 HOW TO GET ACCESS
We hope you will like this script :) We are always ready to help you with customisation, just let us know! To learn more about our scripts & get access - check out the “Author’s instructions” below 👇🏼

Risk Management Strategy TemplateThis strategy is intended to be used as a base template for building new strategies.
It incorporates the following features:
Risk management:
Configurable X% loss per stop loss
Configurable R:R ratio
Trade entry:
Calculated position size based on risk tolerance
Trade exit:
Stop Loss currently configurable ATR multiplier but can be replaced based on strategy
Take Profit calculated from Stop Loss using R:R ratio
Backtesting:
Configurable backtesting range by date
Trade drawings:
TP/SL boxes drawn for all trades. Can be turned on and off
Trade exit information labels. Can be turned on and off
NOTE: Trade drawings will only be applicable when using overlay strategies
Debugging:
Includes section with useful debugging techniques
Strategy conditions
Trade entry:
LONG
C1: Price is above EMA line
C2: RSI is crossing out of oversold area
SHORT
C1: Price is below EMA line
C2: RSI is crossing out of overbought area
Trade exit:
Stop Loss: Stop Loss ATR multiplier is hit
Take Profit: R:R multiplier * Stop Loss is hit
The idea is to use RSI to catch pullbacks within the main trend.
Note that this strategy is intended to be a simple base strategy for building upon. It was not designed to be traded in its current form.

VXD SupercycleVXD is a brand new indicator and still developing. to minimize stop losses and overcome sideways market conditions, Higher Timeframe are recommended
Trend lines
-using Rolling VWAP as trend line to determined if Volume related to a certain price.
-you can switch RVWAP to EMA in the setting
ATR
-trailing 12*ATR and 2.4 Mutiplier
Pivot point and Rejected Block
Pivot show last High and low of a price in past bars
Rejected Block show when that High or Low price are important level to determined if it's Hidden Divergence or Divergence
Symbols on chart show Premium and Discount Prices
X-Cross - show potential reversal trend with weak volume .
O-circle - show potential reversal trend with strong volume .
Setting
Momentum: RSI = 25 , RSI MA = 14
Trend: Rolling VWAP and ATR and Subhag
Trailing STOP: ATR 12 x 2.4
Highlight Bars color when volume is above SMA 6
SMA200 act as TP Line
Risk:Reward Calculation
if Buy your Stoploss will be previous Pivot low
if Sell your Stoploss will be previous Pivot high and will be calculated form there, then show TP in Orange color line
VXD เป็นระบบเทรดที่ผมทดลองเอาหลาย ๆ ไอเดีย ทั้งจาก Youtube facebook และกลุ่มคนต่าง ๆ มารวบรวมไว้ แล้วตกผลึกขึ้นมาเป็นระบบนี้ ใน Timeframe ใหญ่ ๆ สามารถลากได้ทั้ง Cycle กันเลย
Trend lines
-ใช้ Rolling VWAP ของแอพ Tradingview (สามารถตั้งแค่าเป็น EMA ได้)
ATR
-ใช้ค่า ATR 12 Mutiplier 2.4
Pivot point and Rejected Block
Pivot โชว์เส้น High low และมีผลกับออเดอร์ หากแท่งเทียนปิดทะลุเส้นนี้
Rejected Block วาดแนวรับ-ต้าน อัตโนมัติ ใช้ประกอบ RSI ว่ามี Divergence หรือไม่
สัญลักษณ์ต่าง ๆ
X-Cross - แท่งกลืนกิน วอลุ่มน้อย
O-circle - แท่งกลืนกิน มีวอลุ่ม
Setting
Momentum: RSI = 25 , RSI MA = 14
Trend: Rolling VWAP and ATR and Subhag
Trailing STOP: ATR 12 x 2.4
Highlight Bars color when volume is above SMA 6
SMA200 act as TP Line
Risk:Reward Calculation
หาก Buy จุด SL จะอยู่ที่ Pivot low
หาก Sell จุด SL จะอยู่ที่ Pivot high และระบบจะคำนวณจากตรงนั้น จากนั้นแสดงเป็นเส้น TP สีส้ม
This Strategy Combined the following indicators and conditioning by me
ATR , RSI , EMA , SMA
Rolling VWAP - /script/ZU2UUu9T-Rolling-VWAP/
Regression Lines - Subhag form Subhag Ghosh /script/LHHBVpQu-Subhag-Ghosh-Algo-Version-for-banknifty/
Rejection Block , Pivots , High Volume Bars and PPDD form Super OrderBlock / FVG / BoS Tools by makuchaku & eFe /script/aZACDmTC-Super-OrderBlock-FVG-BoS-Tools-by-makuchaku-eFe/
ขอให้รวยครับ.

"NoSKi Hammer/Star /w angle of ema Backtester % Applied the angle of ema filter to stars formed in an uptrend, and hammers in a downtrend to try to pick good trading entries
Uses the average angle of the ema over the last 20 bars
(Please note: the angle calculation default value is calibrated for BTCUSD . There is no way currently to code it to be used across multiple pairs. The price to bar ratio has to be adjusted for other trading pairs. Please research price to bar ratio if unfamiliar). I have used a rough calculation so it can be used on other charts but won't be 100% accurate
Strategy uses % take profit and stop loss settings, and only enters one trade at a time (wont show entry if already in a position).
Separate ATR settings for filtering the size of hammer and star candles. (can filter out candles which are too large or small)
Red background colour is for when ema is at or below the set -ve angle slope. Green is for positive angle. Default is set at -45 and 45 degrees.
Big thankyou to ZenAndTheArtOfTrading for hammer and star coding, and Cosmic Angle - by cosmic_indicators for calculating the angle of emas.
Code was borrowed and used directly from these scripts.

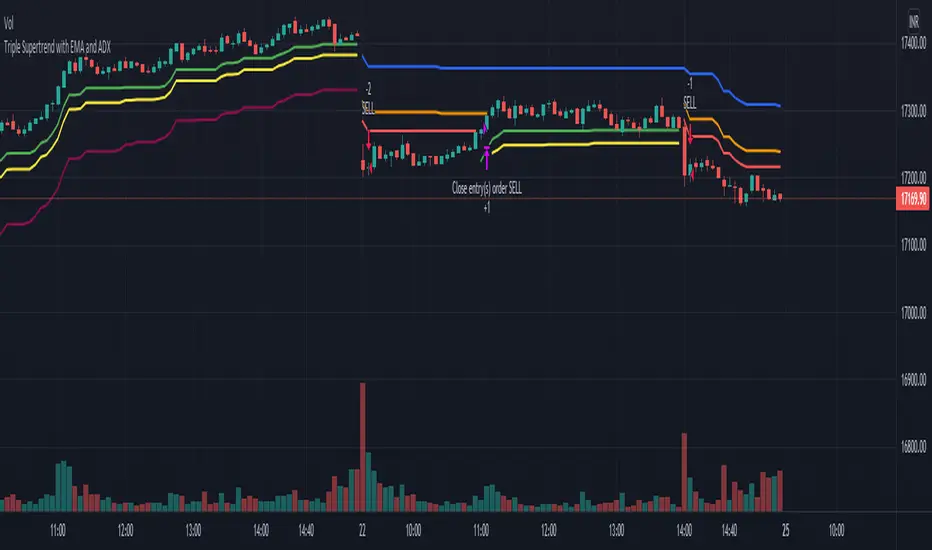
Triple Supertrend with EMA and ADX strategyPublishing a strategy that includes adx and ema filter as well
Entry: all three Supertrend turns positive. If a filter of ADX and EMA is applied, also check if ADX is above the selected level and close is above EMA
Exit: when the first supertrend turns negative
opposite for short entries
A FIlter is given to take or avoid re-enter on the same side. For example, After a long exit, if the entry condition is satisfied again for long before the short single is triggered it takes re-entry if selected.
MACD Strategy [Trading Nerd]This Strategy uses a EMA as a trend filter and MACD for entries. The stoploss can be calculated by the last highs/lows or by the ATR.
Entry Conditions
Long:
close price must be above the EMA
MACD-Line crossover MACD-Signal-Line
MACD-Signal- Line mus be below 0
Short:
close price must be below the EMA
MACD-Line crossunder MACD-Signal-Line
MACD-Signal- Line mus be above 0
Exit Conditions
The Stoploss can be set in two different ways:
1. By the calculated ATR value of the entry Candle. This Value can be multiplied with the ATR multiplier for SL .
For Longs: SL = entry Price - ATR * ATR-multiplier
For Shorts: SL = entry Price + ATR * ATR-multiplier
2. By the previous highest high or lowest low (also called Donchain Channels). The lookback length can be changed in the at Lookback length for HH/LL SL .
For Longs: SL = LL of the last X candles
For Shorts: SL = HH of the last X candles
Take Profit
The TP is calculated by the Risk * Risk Reward Ratio . The Risk Reward Ratio can be changed in the Settings. The Risk is the difference of entry price and stoploss price: Risk = absolute(entry price - stoploss price)
For Longs: TP = entry Price + Risk * Risk Reward Ratio.
For Shorts: TP = entry Price - Risk * Risk Reward Ratio.
Risk Management
You can set the Risk % per Trade in the settings. A Value of 2 means that the position size is calculated in a way that at a loosing trade the strategy will only loose 2% of the current capital (initial capital + net profit).
E.g.: The current capital is $1000 and a trade hits the SL. The strategy will only loose $20.
Info for Alerts: Alert message conversion of JSON Strings. You don't need to add any \n or \" to the alert String.
When you create the Alert the Message must be: {{strategy.order.alert_message}}

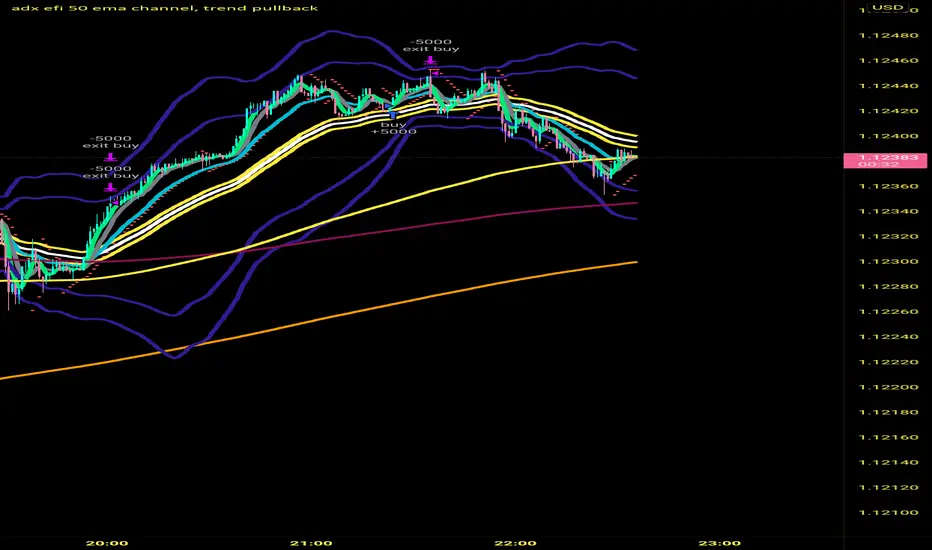
adx efi 50 ema channel, trend pullbackHi so this strategy is based off 50 ema channel and the 15 ma crossing it to generate signals. But with my adjusted strategy it's a 10 rma crossing 50 ema channels and a 5 and 9 wma to help see pullbacks. 50 period bollinger bands to gage volatility a0nd help during range markets. The strategy signals are generated when longer period efi is above 0 and shorter period efi is below zero and price has pulled back near 50 ema to buy long. And the reverse for shorts, I made this to help me trade more mechanically and to trade 1 minute time frame, that's where the strategy seems to Excell the most, I developed it on eur usd but a brief check seems like it still is profitable on gbp usd aud usd usd jpy I only trade the forex market so not sure about stocks and crypto. If you get signals I would place buy stops and sell stops above high and low of respective signal candle and let price take you into trade. Also adx 20 has to be greater than 20 to take trades. Let me know if this is helpful. I've only been coding for a month so it might look sloppy the way it's coded also there are a few other buy and sell conditions left in the source code if you want to switch between different buy and sell triggers, they all produce good results on 1 min timeframe
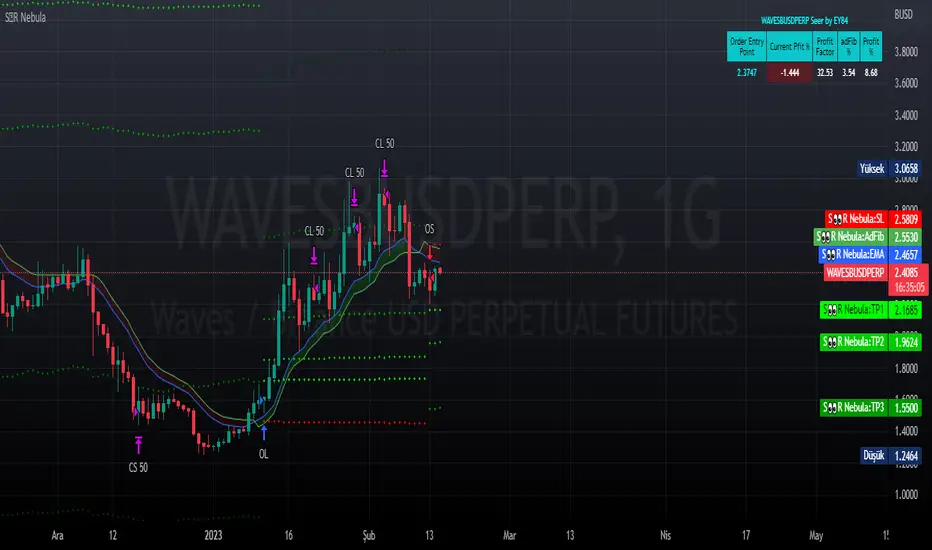
Seer by EY84This is a strategy based on Exponential Moving Averages or Volume Weighted Moving Averages against Adaptive fib resistance / support level and profit percentage which can be definetly defined by user and targeting small profits(profits will be raised by leverages).
In this strategy, there are predefined values which are collected one by one with statistical background and backtests. This gives an advantage to see which ratios are working better for each symbol.
Also this statistics are re-evaluated monthly and if there is a need they are goging to be changed with the help of libraries. Also IT IS RECOMMENDED TO USE IN HOURLY INTERVAL GRAPHICS!!!!
When we deep dive to strategy, it is based on profit percentages. it is similar to the MOST system. MOST only changes the way with default value of %2. But this hardcoded strategy is not working well with each Symbol.
So this is the point where Statistics are involved.
For Ex. while BTC is suits well with %2, it does not do wonders for RSR or RUNE which is 4-5% for each.
Library stores these values as a predefined options. Also it is allowed to change these predefined values within the settings of this strategy.
what is next ? Lets see how are we closing the positions.
Script checks cross of EMA / VWMA and adFib to decide open a position. In reversal / crosses, adFib line had been set to defined Fib. Percentage level. This sets the Full Position close / SL value for current order.
OK! we got the SL but how we get the profit ?
Now this is the place where Profit Percentage (PP) parameter involved. After the position opened it is waiting for PP to be reached. After PP had been reached, close signal had been raised for the HALF of the OPEN ORDER (with the BAR CLOSURE!!).
so tricky part has come here. Remaining position is still open and when "total available profit with remaining amount" had been reached to PP it wil raise the Close Half signal will be raised.
what happens to the SL position ? TWO possible scenarios will be raised here.
Case 1. Reversal on the adFib (short-to-long or long-to-short) will trigger full close signal.
Case 2. If the level drops the previous signal system will generate full close signal again.
Example 1:
Long Order Open : 100$
Half Close Signal : 110$
Case 1: adFib Reversal occurs : 105$ ==> Triggers Full Close Signal with Short Order.
Case 2: Price falls : 100$ ==> Only Triggers Full Close Signal.
Example 2:
Long Order Open : 100$
Half Close Signal : 110$
2. Half Close Signal : 121$
Case 1: adFib Reversal occurs : 115$ ==> Triggers Full Close Signal with Short Order.
Case 2: Price falls : 110$ ==> Only Triggers Full Close Signal.
Beside of these, strategy is also includes editable 4 EMA, 1 WMA, 1 AVWAP and Bollinger Bands Plotting (2.5x Multiplier) who wants to use them as a supportive statistics.
All feedbacks are welcome.
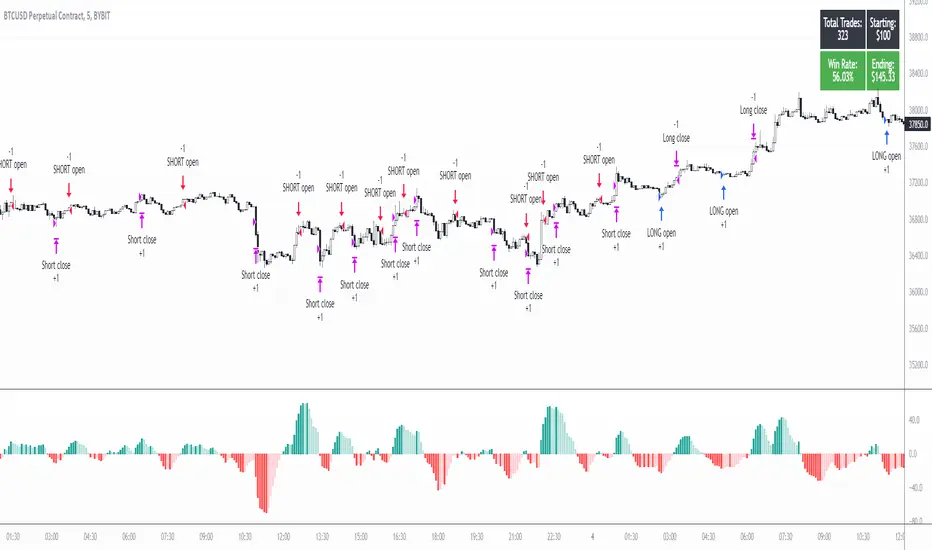
5min MACD scalp by JoelThis strategy is inspired by a youtuber called Joel on Crypto. He trades this using Ema, MACD indicators and his own experience. For more information, check out his Best Crypto Scalping Strategy for the 5 Min Time Frame video. I have tried to automate this a little.
Long or Short trades are determined with a crossing of the fast Ema over the slow Ema for Long and the opposite for Short. Trades should only happen close to the crossovers. Then for Long we use the MACD indicator with a 1min TF (I had better results using the 5min) where we look for high peaks in negative values for Long and vice versa for Shorts. These should be significantly higher than other peaks (or if you will lower peaks for a Long).
Hence, the key is to detect high peaks on the histogram, which I try to achieve by checking if the last 2 values were higher than X bars back. If you want to make it even more specific, then you can turn on the additional checkbox which compares the current value to the average value of X bars back, and if it is greater than, say, 50% the value of the average (= 1.5x the average), then it's ok for the trade.
I also noticed that the strategy often bought at the top or bottom, so I added a check that compares whether the last evaluated bar is the first rising bar (for Long) or falling bar (for Short). This can be turned on or off.
Target profit 0,5% and stop loss 0,4% are based on his recommendation. The strategy is set to take only 1 trade at a time , and you can have a back tester table on.
I'm still a pine script beginner, so the strategy is certainly not perfect and could be improved. If you have any tips on how to improve it further, please let me know. I will try to update it when I have time.
I would also like to thank Joel on Crypto for sharing the strategy and @ZenAndTheArtOfTrading for his great library and code (thanks to him we have a back tester table in here), but especially his educational videos on youtube, which taught me a lot about pine script.
Keltner Channel + DMI + EMA Strategy @DaviddTechThis strategy is a long only strategy that evolves 3 main indicators.
It is optimised for ETH USDT and LONG ONLY
Long positions :
* EMA 50 is above the EMA 400 to define our trend direction.
* Price breaks above the upper band of the the Keltner Channel.
* Confirmation is found with the DMI + being over the DMI -
Other indicators :
ADX set to above 20
The TP I put at 20% and I use Multiple TP levels.
If the price crosses and closes below the Keltner Channel lower band I close the trade.
WARNING:
- For purpose educate only - My mission is to debunk fake strategies with code to find THE ONE.
- Plots EMAs and other values on chart.
- This script to change bars colours.

TradePro's Trading Idea Cipher Divergence EMA Pb StrategyHere I present you on of Trade Pro's Trading Idea: Cipher B+ Divergence EMA Pullback Strategy.
Optimized the crypto pairBTC/USDT in the 30 minute chart.
There is the possibility to switch between short and long positions.
You can choose between 2 different take profit/stop loss types: The Lowest Low/ Highest High Stop Loss/ Take Profit and the ATR Take Profit/ Stop Loss.
-----------------------------------------------------------------------------------
How does the strategy work?
ENTRY
Long
The price must be above the 200 EMA .
The price needs to make a pullback into the 50 EMA .
Right after that, the Cipher B indicator must give a buy signal, it must be below the zero line and the Money Flow cloud must be green.
Short
Contrary to the premise of long positions.
EXIT
Lowest Low/ Highest High Exit
The Lowest Low (long) / highest high (short) serves as the stop loss. The TP is formed on the basis of a factor.
(Long for example: *Lowest Low* multiplied by *Profitfactor* = TP).
ATR Exit
The value of ATR at the time of buying is multiplied by the value entered in "Profit factor ATR" and "Stop factor ATR". As soon as the price reaches this value, it is closed.
Important
The script must be optimized for each coin or currency pair. However, only the values for the profit factor, the stop loss and Lowest Low / Highest High are relevant.
Also, by changing the Chanel Length and the Chanel Average, you can create strong profit changes.
The results of the strategy are without commissions and leverage.
If you have any questions or feedback, please let me know in the comments.
If you need more information about the strategy and want to know exactly how to apply it, check out my profile. There I have created a tutorial for the function of the script.

Excitement - Crypto Surfer v1For those of us who need more excitement in our crypto journey besides just HODL, here’s a simple crypto robot that trades on the hourly (1H) candles. I call it the Crypto Surfer because it uses the 20 and 40 EMAs (Exponential Moving Averages) to decide when to enter and exit; price tends to “surf” above these EMAs when it is bullish, and “sink” below these EMAs when it is bearish. An additional 160 SMA (Simple Moving Average) with slope-angle detection, was added as a bull / bear filter to reduce the sting of drawdowns, by filtering-out long trades in a prolonged bear market.
USER NOTES:
- This script will buy $10,000 USD worth of crypto-currency per trade.
- It will only open one trade at a time.
- It has been backtested on all the high market cap coins such as Bitcoin, Ethereum, Binance Coin, Polkadot, Cardano.
- It should be run on the Hourly (H1) chart.
- In general, this moving average strategy *should be* profitable for 80% to 90% of the coins out there
- The 160 SMA filter with slope angle detection is designed to stop you from going long in a bear market.
- It is recommended you copy this script and modify it to suit your preferred coin during backtesting, before running live.
- Trading is inherently risky (exciting), and I shall not be liable for any losses you incur, even if these losses are due to sampling bias.

BTC and ETH Long strategy - version 2I wrote my first article in May 2020. See below
BTC and ETH Long strategy - version1
After 6 months, it is now time to check the result of my script for the last 6 months.
XBTUSD (4H): 14/05/2020 --> 22/11/2020 = +78% in 4 trades
ETHXBT (4H): 14/05/2020 --> 22/11/2020 = +21% in 9 trades
ETHUSD (4H): 14/05/2020 --> 22/11/2020 = +90% in 6 trades
Using the signals from this strategy to trade manually has shown that this was a bit frustrating because of the low rate of winning trades.
If you have to enter 100 trades and see 75% of them failing and 25% winning, this is frustrating. For sure the strategy makes good money but it is difficult to hold this mentality.
So, I have reviewed and modified it to get a higher winning rate.
After few days of work, tests and validation, I managed to get a wining rate close to 60%.
The key element was also to decrease the number of trades by using a higher time frame. (4H candles instead of 2H candles).
- Entry in position is based on
MACD, EMA (20), SMA (100), SMA (200) moving up
AND EMA (20) > SMA (100)
AND SMA (100) > SMA (200)
- Exit the position if: Stoploss is reached OR EMA (20) crossUnder SMA (100)
The goal of this new script is to be able to follow the signals manually and only make few trades per years.
I have also validated it against some other altcoins where some are giving very good results.
Here are some results for 2020 (from 01/01/2020 until now (22/11/2020). Those results are the one I get when using 4H candles.
ETH/USD: +144% in 8 trades.
BTC/USD: +120% in 7 trades.
ETH/BTC: +33% in 9 trades.
ICX/USD: +123% in 10 trades.
LINK/USD: +155% in 11 trades.
MLN/USD: +388% in 8 trades.
ADA/USD: +180% in 7 trades.
LINK/BTC: +97% in 10 trades.
The best is that above results are without considering compound effect. If you re-invest all gains done in each new trade, this will give you the below results :)
ETH/USD: +189% in 8 trades.
BTC/USD: +260% in 7 trades.
ETH/BTC: +29% in 9 trades.
ICX/USD: +112% in 10 trades.
LINK/USD: +222% in 11 trades.
MLN/USD: +793% in 8 trades.
ADA/USD: +319% in 7 trades.
LINK/BTC: +103% in 10 trades.
As you can see, the results are good and the number of trades for 11 months is not big, which allows the trader to place orders manually.
But still, I'm lazy :), so, I have also coded this strategy in HaasScript language which allows you to automate this strategy using the HaasOnline software specialized in automated crypto trading.
I hope that this strategy will give you ideas or will be the starting point for your own strategy.
Let me know if you need more details.

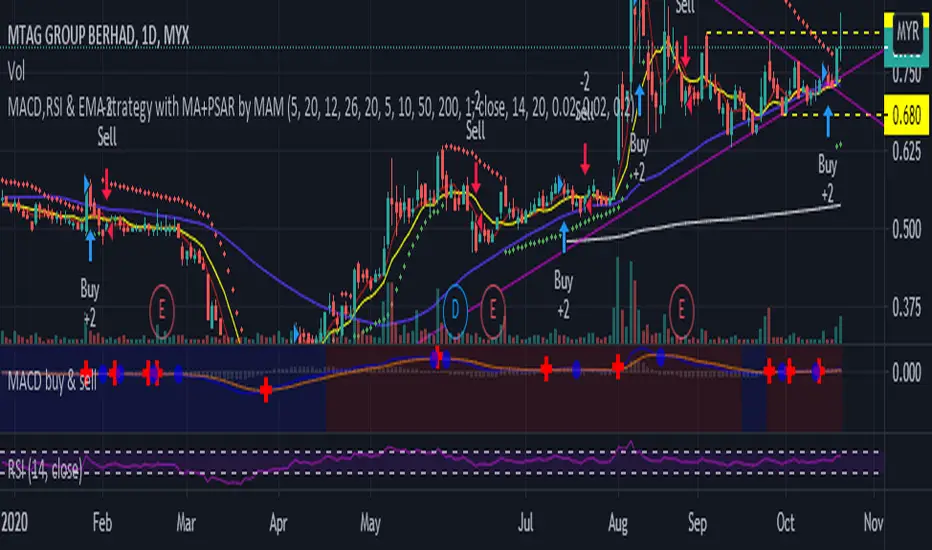
MACD,RSI & EMA strategy with MA+PSAR by MAMMACD,RSI & EMA strategy with MA+PSAR
Buy strategy
- MACD above signal
- RSI above RSI signal
- Close price above EMA
Sell Strategy
- MACD below signal
- RSI below RSI signal
- Close price below EMA
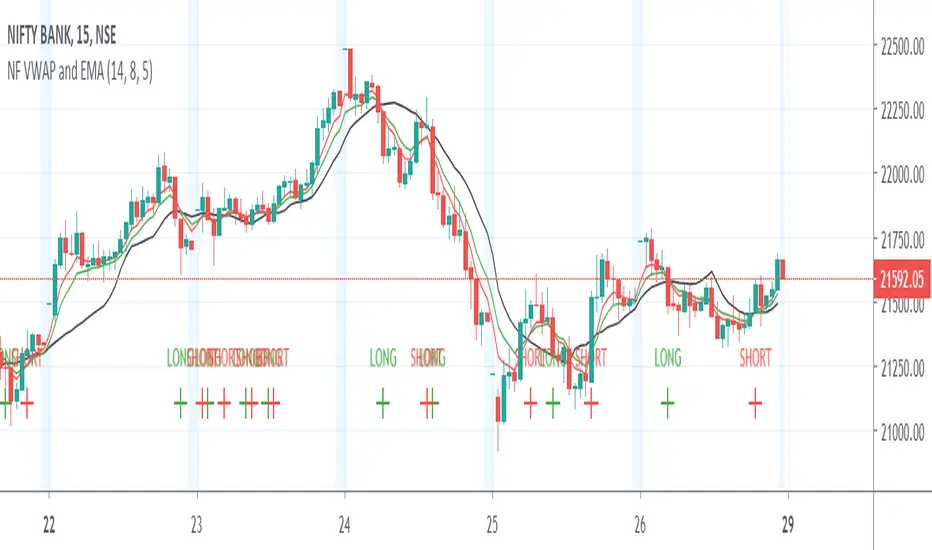
Nifty Volume profile + VWAP + EMA The script picks up nifty stocks with their current respective weights and plots a Volume Weighted Average Price line along with 2 EMAs and an alert when the EMAs cross over.
You can customize the script for EMA lengths and to remove alert. Basic utility of the script is to analyse volumes driving the Nifty 50 index.
Credits to @daytraderph and his script (Custom Volume) who's code I used to build this script. Also thanks to my friend @Varun who helped me code it.
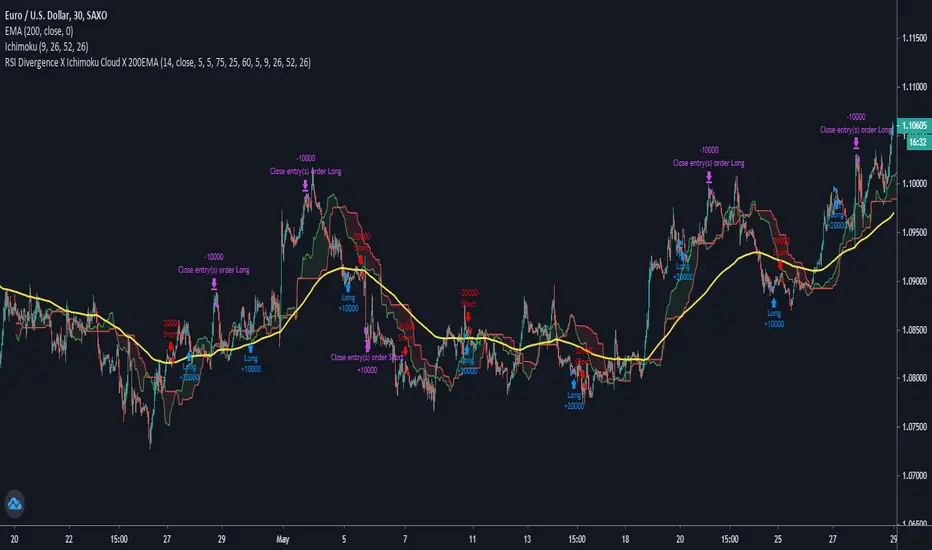
RSI Divergence X Ichimoku Cloud X 200EMAHi all,
This script is a combination of the RSI Divergence Strategy combined with Ichimoku Cloud and 200 EMA .
A long position is entered only when the RSI identifies a bullish divergence (either regular or hidden), and that the Ichimoku Cloud is above the 200 EMA . This is to ensure that there is a confirmation of a bullish trend before an entry.
Similarly, a short position is entered only when the RSI identified a bearish divergence (either regular or hidden), and that the Ichimoku Cloud is below the 200 EMA . This is to ensure that there is a confirmation of a bearish trend before an entry.
I find that this script works best on Intraday charts.
This is just a simple script I built on my third attempt of backtesting strategies on TradingView. Do give it a go and let me know if you guys have any feedback or comments about it. Happy trading!
MACD Bull Crossover and RSI Oversold 5 Candles Ago-Long StrategyHello everyone, I've been having a great time perfecting this strategy for a few weeks now. I finally feel like it's time to release it to the public and share what I have been working on.
This strategy only enters a long trade when the MACD crosses over the signal line and the RSI was oversold looking back 5 candles ago. The logic behind this is to wait for RSI to enter the oversold territory, and then when the market starts to recovery the MACD will crossover telling us the sell off is over.
This strategy will close once these 2 conditions are met.
1. MACD Histogram is above 0 and MACD crosses under the signal line.
2. RSI was overbought 5 previous candles ago.
In the strategies settings, you'll be able to enable visual stop-loss and profit levels and change those levels to what you like, enable up to 5 EMA'S,
ADDONS That Affect Strategy:
* Enable visual stop-loss and profit levels as soon as a buy signal is triggered.
* Modify stop-loss and profit levels.
* Modify RSI oversold and RSI overbought levels.
* Modify MACD Fast and Slow moving average.
ADDONS That Do Not Affect Strategy:
* Enable up to 5 EMA's. (This will not affect strategy, and is the only purpose is for people who like following EMA's.)
Thank you for taking the time to try my strategy. I hope you have the best success. I will be making a short strategy, and alerts for this strategy soon. Follow me for updates!

4-9-18 EMA CrossBasically the following rules follow:
Long when
4 and 9 EMA cross up over the 18 EMA
Exit when 4 day crosses down over the 9 day EMA
Short when 4 and 9 cross down over the 18
Exit when 4 crosses up back across 9
New Entry signal when both the 4 and 9 are on the same side of the 18
*****Best used on a 4HR TF

