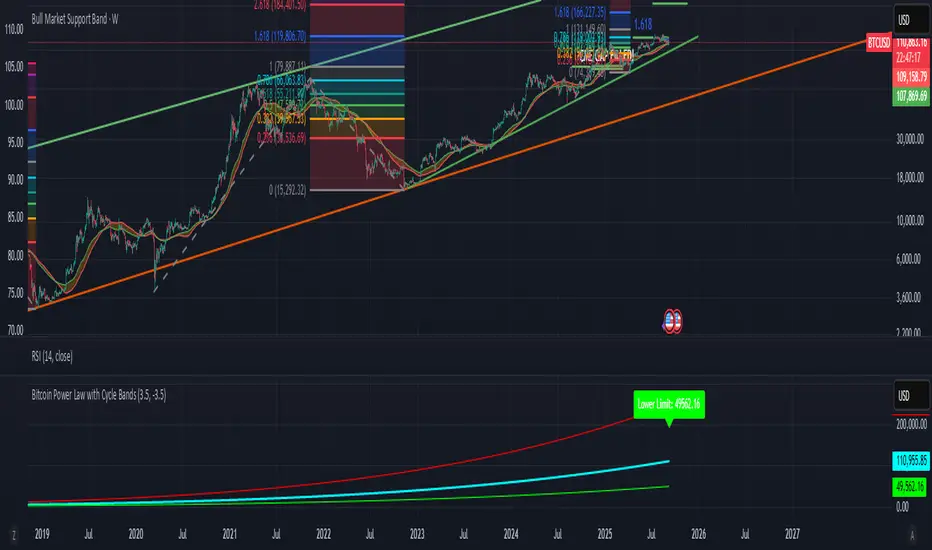
Bitcoin Power Law with Cycle BandsBitcoin Power Law with Cycle Bands DescriptionUnlock the power of Bitcoin’s long-term trends with the Bitcoin Power Law with Cycle Bands script, exclusively available through Bitcoin Wealth Edge! This custom TradingView indicator, built for Pine Script v6, models Bitcoin’s price behavior using a 96% R² power law trendline, derived from days since its genesis (January 3, 2009). Designed to predict cycle tops and bottoms, it features:Power Law Trendline: A cyan line representing fair value (e.g., ~$111,000 as of September 2025), based on a logarithmic regression with adjustable coefficients (a = -17.02, b = 5.83).
Cycle Bands: Adjustable red (upper) and green (lower) bands, defaulting to 3.5x and -3.5x multipliers, aligning with historical peaks (e.g., $69K in 2021) and troughs (e.g., $16K in 2022).
Dynamic Labels: Real-time labels displaying fair value, upper limit ($180K), and lower limit ($40K), updated on the last bar for quick insights.
Follow @HodlerRanch
for updates!
In den Scripts nach "bitcoin" suchen
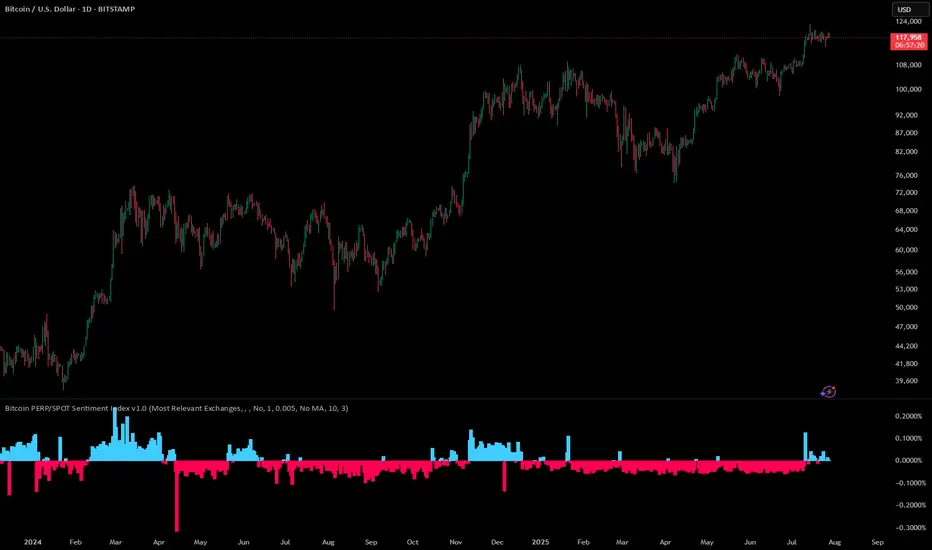
Bitcoin PERP/SPOT Sentiment Index# Bitcoin PERP/SPOT Sentiment Index
A comprehensive Pine Script indicator that measures market sentiment by analyzing the premium/discount between Bitcoin perpetual futures and spot prices across multiple cryptocurrency exchanges.
## 📊 Overview
The Bitcoin PERP/SPOT Sentiment Index provides traders with deep insights into market psychology and risk appetite in the cryptocurrency ecosystem. By calculating the price difference (premium/discount) between perpetual futures contracts and spot prices, it reveals how traders are positioned and their sentiment toward Bitcoin's price direction.
**Key Insight**: The premium between PERP and SPOT prices is a powerful sentiment indicator that reflects trader positioning, risk appetite, and market psychology - data that influences but is separate from actual exchange funding rates.
## 🎯 Core Functionality
### Premium Calculation Methodology
The indicator calculates market sentiment using the following approach:
1. **Multi-Exchange Data Collection**: Fetches real-time prices from major exchanges for both perpetual futures (PERP) and spot markets
2. **TWAP Calculation**: Computes time-weighted average prices for both market types to reduce noise
3. **Premium Analysis**: Calculates the percentage difference between PERP and SPOT prices
4. **Sentiment Smoothing**: Applies time-weighted smoothing for stable sentiment readings
**Formula**: `Premium = (PERP_TWAP / SPOT_TWAP - 1) × 100`
### Market Sentiment Insights
**Positive Premium (PERP > SPOT) = Risk-On Sentiment**
- Traders prefer leveraged long positions via perpetuals
- High risk appetite and bullish expectations
- Willingness to pay premium for leverage access
- Often coincides with FOMO and greed phases
**Negative Premium (PERP < SPOT) = Risk-Off Sentiment**
- Traders prefer spot holdings or short perpetuals
- Fear-driven behavior and bearish expectations
- Spot premium indicates institutional accumulation
- Often coincides with capitulation and fear phases
### Exchange Coverage
**Perpetual Futures (17 markets)**:
- Bitmex (USD, USDT)
- Binance (USDT, USD)
- Bitget (USD, USDT, USDC)
- Bybit (USDT, USD)
- Phemex (USD, USDT)
- Huobi, Kraken, OKX (USD, USDT)
- Deribit, BingX
**Spot Markets (12 markets)**:
- Bitstamp, Binance, Coinbase
- Phemex, Huobi, Kraken, OKX
- Kucoin (USDT, USDC)
- Bitget (USDT, USDC)
- BTC Index
## 🎛️ Exchange Selection Modes
### 1. "Most Relevant Exchanges" (Default) ⭐
**Why this selection provides the best sentiment analysis:**
This preset focuses on exchanges that most accurately reflect true market sentiment by prioritizing:
#### **Institutional & Retail Balance**
- **Diverse User Base**: Includes exchanges serving both institutional (Coinbase, Kraken) and retail (Binance, Bybit) traders
- **Geographic Diversity**: Balances Western and Asian markets for global sentiment representation
- **Regulatory Clarity**: Focuses on exchanges with clear regulatory standing
#### **High-Quality Sentiment Data**
- **Deep Liquidity**: Ensures price movements reflect genuine sentiment, not thin book effects
- **Price Discovery Leaders**: These exchanges set market direction and sentiment trends
- **Reduced Manipulation**: Larger exchanges are less susceptible to artificial price manipulation
#### **Trading Behavior Insights**
- **Leverage Preferences**: Captures where traders actually choose to take leveraged positions
- **Risk Appetite Signals**: Reflects real money sentiment from major market participants
- **Arbitrage Efficiency**: Premium differences here represent actionable sentiment signals
**Included Exchanges**:
- **PERP**: Bitmex (USD/USDT), Binance (USDT/USD), Bybit (USDT/USD)
- **SPOT**: Bitstamp, Binance, Coinbase, Kraken, Kucoin, Bitget (USDT/USDC)
### 2. "All Exchange Data"
- Maximum market coverage for comprehensive sentiment analysis
- Includes smaller exchanges that may reflect niche trading behaviors
- Best for research and identifying sentiment divergences across market segments
### 3. "Excl. OKX and Huobi"
- Focuses on Western and international exchanges
- Useful for analyzing sentiment outside specific jurisdictions
- Maintains broad coverage while addressing regional concerns
### 4. "Individual: Select Below"
- Custom sentiment analysis for specific exchange combinations
- Perfect for testing regional sentiment differences
- Allows focus on specific trader demographics or market segments
## ⚙️ Configuration Options
### Core Settings
- **TWAP Interval**: Time period for price averaging
- **Premium Calculation Interval**: Data fetching frequency for sentiment updates
- **Percentage Rate Timeframe**: Multiplier for annualizing premium rates (e.g., 365 for annual rate)
### Sentiment Analysis Controls
- **Cut High Values**: Filters extreme sentiment spikes (>0.1%, >0.2%, >0.5%, >1.2%)
- **Enable Data Validation**: Automatically filters invalid price data for accurate sentiment
- **Minimum Exchanges Required**: Ensures reliable sentiment calculation (default: 3)
### Advanced Features
- **Sentiment Boost**: Adds realistic trading costs to better reflect actual sentiment impact
- **Moving Average Options**: SMA, WMA, EMA, RMA smoothing for trend analysis
- **Real-time Validation**: Prevents calculation with insufficient data
## 📈 Sentiment Interpretation Guide
### Positive Premium (Blue Bars) - Risk-On Sentiment
- **0-0.1%**: Neutral to slightly bullish sentiment
- **0.1-0.3%**: Moderate bullish sentiment, increasing risk appetite
- **0.3-0.5%**: Strong bullish sentiment, high leverage demand
- **>0.5%**: Extreme greed, potential contrarian signal
**Trading Psychology**: Traders are eager to pay premium for leveraged long exposure, indicating confidence and risk-taking behavior.
### Negative Premium (Red Bars) - Risk-Off Sentiment
- **0 to -0.1%**: Neutral to slightly bearish sentiment
- **-0.1% to -0.3%**: Moderate bearish sentiment, risk reduction
- **-0.3% to -0.5%**: Strong bearish sentiment, fear-driven behavior
- **<-0.5%**: Extreme fear, potential capitulation, contrarian opportunity
**Trading Psychology**: Traders prefer spot holdings or short positions, indicating caution and defensive positioning.
## 🧠 Sentiment Analysis Applications
### 1. **Market Psychology Assessment**
- Gauge overall trader confidence and risk appetite
- Identify shifts from greed to fear (and vice versa)
- Spot emotional extremes that often precede reversals
### 2. **Contrarian Trading Signals**
- Extreme positive premium (>0.5%) = potential sell signal (overconfidence)
- Extreme negative premium (<-0.5%) = potential buy signal (oversold sentiment)
- Divergences between price and sentiment for early reversal detection
### 3. **Risk Management**
- High premium = reduce position size (crowded long trades)
- Low/negative premium = potential opportunity for contrarian positions
- Sentiment trend analysis for position timing
### 4. **Market Timing**
- Premium expansion = momentum continuation likely
- Premium contraction = potential trend exhaustion
- Zero-line crosses = sentiment regime changes
### 5. **Institutional vs Retail Behavior**
- Sustained negative premium often indicates institutional accumulation
- Extreme positive premium suggests retail FOMO and leverage excess
## 🔧 Technical Implementation
### Anti-Repainting Protection
```pine
securemodule(data, intervall, source) =>
request.security(data, intervall, source , lookahead=barmerge.lookahead_on)
```
### Data Quality & Sentiment Accuracy
- Price bounds checking (1,000 - 200,000 USD) for realistic data
- Invalid data filtering to prevent sentiment distortion
- Minimum exchange count requirements for reliable sentiment readings
- Outlier detection to filter manipulation attempts
### Performance Optimizations
- Array-based exchange management for efficiency
- Efficient TWAP calculations for real-time sentiment updates
- Modular configuration system for easy customization
- Reduced redundant calculations for faster processing
## 🚀 Key Features (v1.0)
- **Bitcoin PERP/SPOT Sentiment Index**: First public release focused on sentiment analysis
- **Multi-Exchange Aggregation**: Combines data from 17 PERP and 12 SPOT markets
- **Advanced Data Validation**: Robust outlier filtering and data quality controls
- **Configurable Exchange Presets**: Optimized selections for different analysis needs
- **Real-Time Sentiment Analysis**: Live premium calculations with anti-repainting protection
## ⚠️ Important Distinctions
**What This Indicator Measures:**
- ✅ PERP/SPOT price premium (sentiment indicator)
- ✅ Market psychology and risk appetite
- ✅ Trader positioning preferences
- ✅ Leverage demand vs spot preference
**What This Indicator Does NOT Measure:**
- ❌ Actual exchange funding rates (these come from exchange APIs)
- ❌ Real funding costs paid by traders
- ❌ Exact arbitrage profitability
- ❌ Future price direction (sentiment can be wrong)
**Relationship to Funding Rates:**
The premium calculated by this indicator influences actual funding rates, but funding rates also include exchange-specific factors like funding intervals, rate caps, and internal calculations. This premium serves as a leading sentiment indicator that helps predict funding rate direction.
## 💡 Advanced Sentiment Strategies
1. **Sentiment Divergence**: Watch for premium direction differing from price movement
2. **Regime Change Detection**: Monitor sustained shifts in premium sign (+ to - or vice versa)
3. **Volatility Prediction**: Extreme premiums often precede high volatility periods
4. **Correlation Analysis**: Compare with VIX, Fear & Greed Index, and on-chain metrics
5. **Multi-Timeframe Sentiment**: Use different timeframes to identify sentiment trends vs noise
Bitcoin Spot ETF Combined Volume (with MA)Bitcoin Spot ETF Combined Volume Indicator
This TradingView script tracks and combines the daily trading volumes of major Bitcoin Spot ETFs, including:
• IBIT (BlackRock)
• FBTC (Fidelity)
• ARKB (ARK Invest)
• BITB (Bitwise)
• HODL (Valkyrie)
• GBTC (Grayscale)
It plots:
• The total combined volume
• A moving average of combined volume
• Dynamic color changes (green = strong volume, red = weak volume)
• Optional alerts when volume crosses above or below the moving average
Why it matters:
Rising ETF volume often signals increased institutional interest, potential accumulation, or distribution.
Watching volume trends helps spot shifts in Bitcoin’s broader market sentiment.
⸻
Disclaimer:
This tool is for informational and educational purposes only.
It does not constitute financial advice.
Always do your own research (DYOR) and consult a professional before making investment decisions.
Use at your own risk.

Bitcoin Halving DatesBitcoin Halving Dates Indicator
This custom indicator automatically marks Bitcoin's key halving events by drawing vertical lines on your chart. It highlights the historical halving dates (2012, 2016, 2020) and includes an estimated date for the upcoming halving in 2024, making it easy to visualize significant supply events that can influence market trends.
Features:
Automated Markings: Displays vertical lines on the first bar of each halving day.
Customizable: Easily adjust halving dates and styling options to suit your analysis.
Built for Traders: Enhance your technical analysis by keeping track of pivotal market events.
Use this indicator to gain a visual edge by integrating critical Bitcoin halving events into your trading strategy. Happy Trading!

Bitcoin Market Dominance with Moving AveragesBitcoin Market Dominance with Moving Averages
This Pine Script indicator tracks Bitcoin market dominance by calculating the percentage of Bitcoin's market capitalization relative to the total cryptocurrency market cap.
Features:
✅ Real-time BTC Dominance Calculation: Displays the percentage of Bitcoin’s market share.
✅ Moving Averages: Includes two customizable moving averages for trend analysis.
✅ Visual Alerts: Background colors indicate different dominance levels:
Green: BTC dominance is above 50% (strong BTC market control).
Red: BTC dominance is below 40% (altcoins gaining strength).
Orange: BTC dominance is between 40%-50% (neutral zone).
This tool helps traders analyze Bitcoin’s influence on the crypto market and identify key dominance trends.
[ADDYad] Google Search Trends - Bitcoin (2012 Jan - 2025 Jan)This Pine Script shows the Google Search Trends as an indicator for Bitcoin from January 2012 to January 2025, based on monthly data retrieved from Google Trends. It calculates and displays the relative search interest for Bitcoin over time, offering a historical perspective on its popularity mainly built for BITSTAMP:BTCUSD .
Important note: This is not a live indicator. It visualizes historical search trends based on Google Trends data.
Key Features:
Data Source : Google Trends (Last retrieved in January 10 2025).
Timeframe : The script is designed to be used on a monthly chart, with the data reflecting monthly search trends from January 2012 to January 2025. For other timeframes, the data is linearly interpolated to estimate the trends at finer resolutions.
Purpose : This indicator helps visualize Bitcoin's search interest over the years, offering insights into public interest and sentiment during specific periods (e.g., major price movements or news events).
Data Handling : The data is interpolated for use on non-monthly timeframes, allowing you to view search trends on any chart timeframe. This makes it versatile for use in longer-term analysis or shorter timeframes, despite the raw data being available only on a monthly basis. However, it is most relevant for Monthly, Weekly, and Daily timeframes.
How It Works:
The script calculates the number of months elapsed since January 1, 2012, and uses this to interpolate Google Trends data values for any given point in time on the chart.
The linear interpolation function adjusts the monthly data to provide an approximate trend for intermediate months.
Why It's Useful:
Track Bitcoin's historic search trends to understand how interest in Bitcoin evolved over time, potentially correlating with price movements.
Correlate search trends with price action and other market indicators to analyze the effects of public sentiment and sentiment-driven market momentum.
Final Notes:
This script is unique because it shows real-world, non-financial dataset (Google Trends) to understand price action of Bitcoin correlating with public interest. Hopefully is a valuable addition to the TradingView community.
ADDYad

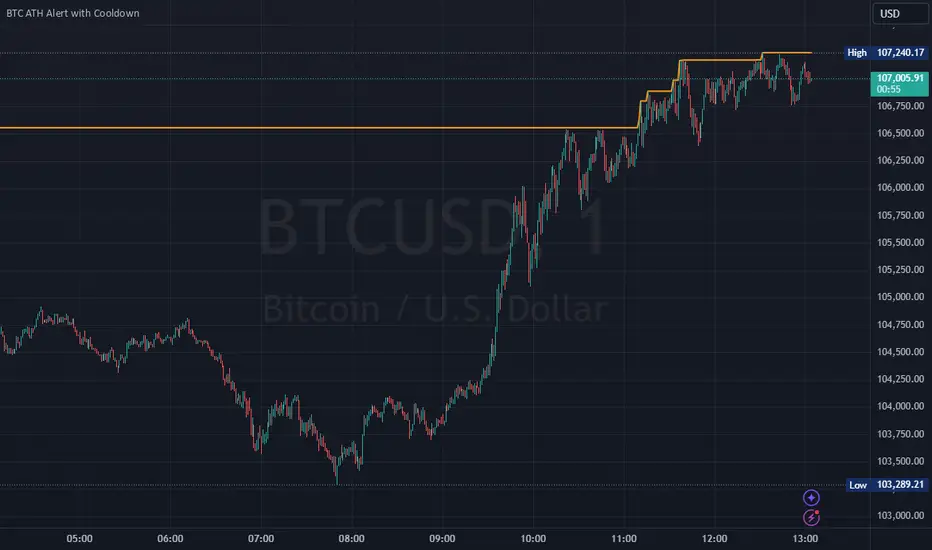
Bitcoin All-Time High (ATH) Alert with Cooldown₿ Bitcoin All-Time High (ATH) Alert with Cooldown 🚀👩🚀
🔍 What it does:
This indicator tracks new all-time highs (ATHs) and alerts you when Bitcoin (or any asset) reaches a fresh ATH, while avoiding alert spam with a customizable cooldown period.
✨ Key Features
✅ Alerts for New ATHs: Never miss when Bitcoin makes history!
✅ Cooldown Period: Prevents multiple alerts within a short timeframe (customizable in settings).
✅ ATH Line on Chart: A clear, visual line marking the all-time high price.
✅ Manual Reset Option: Reset the ATH for testing or specific chart conditions.
⚙️ How to Use
Add the Indicator: Apply it to your chart like any other indicator. Ideally on a small time frame, the cooldown is 20 bars by default (adjustable) which gives 20 minutes on the 1 min chart.
Customize Settings:
- Cooldown Period (bars): Set the number of bars to wait before triggering another alert (e.g., 20 bars).
- Show All-Time High Line: Toggle to display or hide the ATH line visually.
- Reset All-Time High: Use this to manually reset the ATH to the current bar's high.
Create an Alert:
Open the "Alerts" menu.
Select the condition: "New All-Time High" .
Choose a trigger type:
Once Per Bar: For immediate alerts when a new ATH occurs.
Once Per Bar Close: To confirm the ATH at the end of each bar.
🛠️ Who is it for?
Traders and HODLers who want to stay on top of price action.
Anyone looking for clean and efficient ATH tracking with no redundant alerts
🚀 Never miss a new ATH again. Stay ahead of the market!
Bitcoin 100 Pips Indicator 5Bitcoin 100 Pips Indicator
Description: The Bitcoin 100 Pips Indicator is a powerful tool designed for traders who seek to capitalize on rapid price movements in the Bitcoin market. This indicator provides clear entry and exit signals based on a combination of price action analysis and pre-defined profit targets.
Key Features:
Quick Entry and Exit Signals: The indicator generates buy and sell signals in real-time, allowing traders to enter and exit positions quickly and effectively.
Targeting 100 Pips: Specifically designed to target 100 pips of profit for each trade, this indicator sets clear take profit and stop loss levels, helping traders manage their risk and reward effectively.
User-Friendly Interface: With easily visible signals and annotations directly on the chart, the indicator enhances your trading experience without cluttering your view.
Adjustable Settings: Traders can customize the pip target and stop loss levels according to their individual strategies, providing flexibility to accommodate different trading styles.
Ideal for Short-Term Trading: Whether you are a scalper or a day trader, this indicator is optimized for M5 and M15 timeframes, making it ideal for capturing quick price movements in the volatile Bitcoin market.
How to Use:
Apply the Bitcoin 100 Pips Indicator to your chart and select your preferred trading timeframe (M5 or M15).
Look for buy signals indicated by green labels when market conditions favor upward movement.
Conversely, watch for sell signals marked by red labels during downward trends.
Use the provided take profit and stop loss levels to manage your trades effectively.
Disclaimer: This indicator is for informational purposes only and does not guarantee profits. Always practice proper risk management and conduct your own analysis before trading.

Combined Bitcoin CME Gaps and Weekend DaysScript Description: Combined Bitcoin CME Gaps and Weekend Days
Author: NeoButane (Bitcoin CME Gaps), JohnIsTrading (Day of Week),
Contributor : MikeTheRuleTA (Combined and optimizations)
This Pine Script indicator provides a combined view of Bitcoin CME gaps and customizable weekend day backgrounds on your chart. It’s designed to help traders visualize CME gaps along with customizable weekend day highlights.
Features:
CME Gaps Visualization:
Enable CME Gaps: Toggle the display of CME gaps on your chart.
Show Real vs. CME Price: Choose whether to display chart prices or CME prices for gap analysis.
Weekend Gaps Only: Filter to show only weekend gaps for a cleaner view (note: this may miss holidays).
CME Gaps Styling:
Weekend Background Highlighting:
Enable Weekend Background: Toggle the weekend day background highlight on or off.
Timezone Selection: Choose the relevant timezone for accurate weekend highlighting.
Customizable Weekend Colors: Define colors for Saturday and Sunday backgrounds.
How It Works:
CME Gaps: The script identifies gaps between CME and chart prices when the CME session is closed. It plots these gaps with customizable colors and line widths.
You can choose to see gaps based on CME prices or chart prices and decide whether to include only weekends.
Weekend Backgrounds: The script allows for background highlighting of weekends (Saturday and Sunday) on your chart. This can be enabled or disabled and customized with specific colors.
The timezone setting ensures that the background highlights match your local time settings.
Inputs:
CME Gaps Settings:
Enable CME Gaps
Show Real vs. CME Price
Only Show Weekend Gaps
CME Gaps Style:
Gap Fill Color Up
Gap Fill Color Down
Gap Fill Transparency
Weekend Settings:
Enable Weekend Background
Timezone
Enable Saturday
Saturday Color
Enable Sunday
Sunday Color
Usage:
Add this script to your TradingView chart to overlay CME gaps and weekend highlights.
Adjust the settings according to your preferences for a clearer view of gaps and customized weekend backgrounds.
This indicator provides a comprehensive tool for tracking CME gaps and understanding weekend market behaviors through visual enhancements on your trading charts.
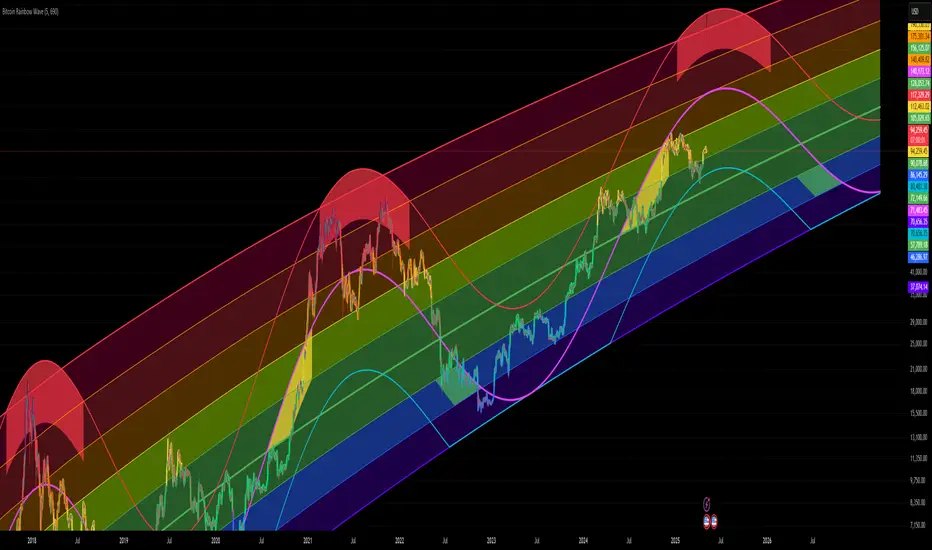
Bitcoin Rainbow WaveBitcoin ultimate price model:
1. Power Law + 2. Rainbow Narrowing Bands + 3. Halving Cycle Harmonic Wave + 3. Wave bands
This powerful tool is designed to help traders of all levels understand and navigate the Bitcoin market. It works exclusively with BTC on any timeframe, but looks best on weekly or daily charts. The indicator provides valuable insights into historical price behavior and offers forecasts for the next decade, making it essential for both mid-term and long-term strategies.
How the Model Works
Power Law (Logarithmic Trend) : The green line represents the expected long-term price trajectory of Bitcoin based on a logarithmic regression model (power law). This suggests that Bitcoin's price generally increases as a power of 5.44 over time passed.
Rainbow Chart : Colored bands around the power law trend line illustrate a range of potential price fluctuations. The bands narrow esponentially over time, indicating increasing model accuracy as Bitcoin matures. This chart visually identifies overbought and oversold zones, as well as fair value zones.
Blue Zone : Below the power law trend, indicating an undervalued condition and a potential buying zone.
Green Zone : Around the power law trend, suggesting fair value.
Yellow Zone : Above the power law trend, but within the rainbow bands. Exercise caution, as the price may be overextended.
Red Zone : Far above the power law trend, indicating strong overbought conditions. Consider taking profits or reducing exposure.
Halving Cycle Wave : The fuchsia line represents the cyclical wave component of the model, tied to Bitcoin's halving events (approximately every four years). This wave accounts for the price fluctuations that typically occur around halvings, with price tending to increase leading up to a halving and correct afterwards. The amplitude of the wave decreases over time as the impact of halvings potentially lessens. Additional bands around the wave show the expected range of price fluctuations, aiding traders in making informed decisions.
Customizing Parameters
You can fine-tune the model's appearance by adjusting these input parameters:
show Power Law (true/false): Toggle visibility of the power law trend line.
show Wave (true/false): Toggle visibility of the halving cycle wave.
show Rainbow Chart (true/false): Toggle visibility of the rainbow bands.
show Block Marks (true/false): Toggle visibility of the 70,000 block interval markers.
Using the Model in Your Trading Strategy
Combine this indicator with technical analysis, fundamental analysis, and risk management techniques to develop a comprehensive Bitcoin trading strategy. The model can help you identify potential entry and exit points, assess market sentiment, and manage risk based on Bitcoin's position relative to the power law trend, halving cycle wave, and rainbow chart zones.
True Bitcoin Value USD - Mario MThe average mining costs of one bitcoin equals to the true intrinsic value
Globally, the Bitcoin network uses around 0.5% of the world’s electrical power supply.
The sheer amount of electrical power and complex hardware required to operate a mining farm has intrinsic value.
This gives bitcoin a fundamental cost to create, and thus intrinsic value.
Everything Bitcoin [Kioseff Trading]Hello!
This script retrieves most of the available Bitcoin data published by Quandl; the script utilizes the new request.security_lower_tf() function.
Included statistics,
True price
Volume
Difficulty
My Wallet # Of Users
Average Block Size
api.blockchain size
Median Transaction Confirmation Time
Miners' Revenue
Hash Rate
Cost Per Transaction
Cost % of Transaction Volume
Estimated Transaction Volume USD
Total Output Volume
Number Of Transactions Per Block
# of Unique BTC Addresses
# of BTC Transactions Excluding Popular Addresses
Total Number of Transactions
Daily # of Transactions
Total Transaction Fees USD
Market Cap
Total BTC
Retrieved data can be plotted as line graphs; however, the data is initially split between two tables.
The image above shows how the requested Bitcoin data is displayed.
However, in the user inputs tab, you can modify how the data is displayed.
For instance, you can append the data displayed in the floating statistics box to the stagnant statistics box.
The image above exemplifies the instance.
You can hide any and all data via the user inputs tab.
In addition to data publishing, the script retrieves lower timeframe price/volume/indicator data, to which the values of the requested data are appended to center-right table.
The image above shows the script retrieving one-minute bar data.
Up arrows reflect an increase in the more recent value, relative to the immediately preceding value.
Down arrows reflect a decrease in the more recent value relative to the immediately preceding value.
The ascending minute column reflects the number of minutes/hours (ago) the displayed value occurred.
For instance, 15 minutes means the displayed value occurred 15 minutes prior to the current time (value).
Volume, price, and indicator data can be retrieved on lower timeframe charts ranging from 1 minute to 1440 minutes.
The image above shows retrieved 5-minute volume data.
Several built-in indicators are included, to which lower timeframe values can be retrieved.
The image above shows LTF VWAP data. Also distinguished are increases/decreases for sequential values.
The image above shows a dynamic regression channel. The channel terminates and resets each fiscal quarter. Previous channels remain on the chart.
Lastly, you can plot any of the requested data.
The new request.security_lower_tf() function is immensely advantageous - be sure to try it in your scripts!

FieryTrading Long-Term Bitcoin Investor ToolDear community,
Today I want to present you one of my favorite scripts for long-term Bitcoin trading. I'm publishing this script because I think it will help traders to become more profitable in the long-term. Consequently, this script is targeted at long-term investors only, since it can take years before the price goes from the green area to the red area.
To use this script correctly you will need to use the BTCUSD index from Tradingview. Search "Bitcoin Index" in your symbol search bar, top result. Use daily candles on a logarithmic scale.
This scripts consists of two price bands, green and red. The green band has historically been a great area for the accumulation of BTC, whilst the red area has historically been a great area for exiting BTC. You could say that if the price is in (or below) the green bands BTC is undervalued, with the opposite being true for the red bands.
If you wish to add alerts to this script, simply click on the alert button > condition=Fierytrading BTC Tool. You can add alerts when the price enters the green area (Buy Area Cross) or red area (Sell Area Cross).
This simple script has historically proven to be very efficient at identifying bottoms (accumulation) and tops (distribution). Be aware that the usability of this script is not guaranteed in the future.

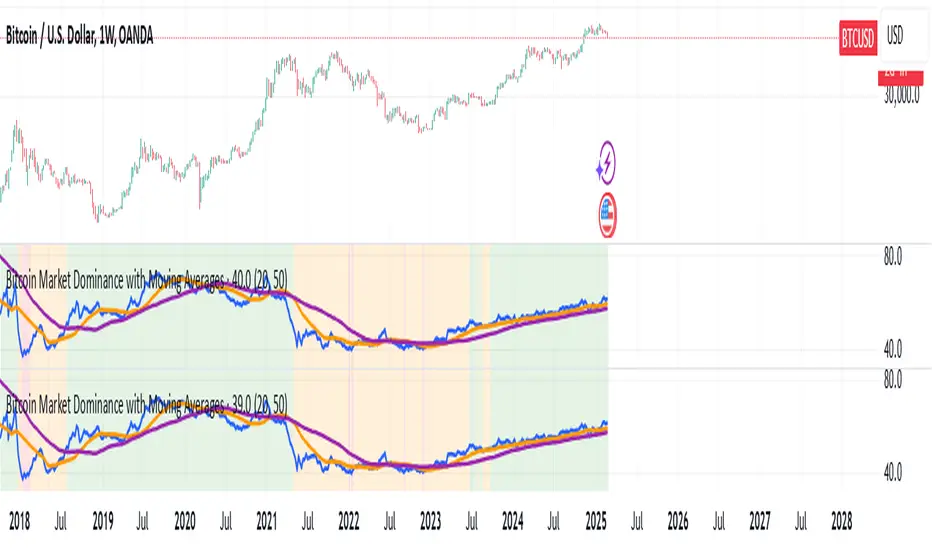
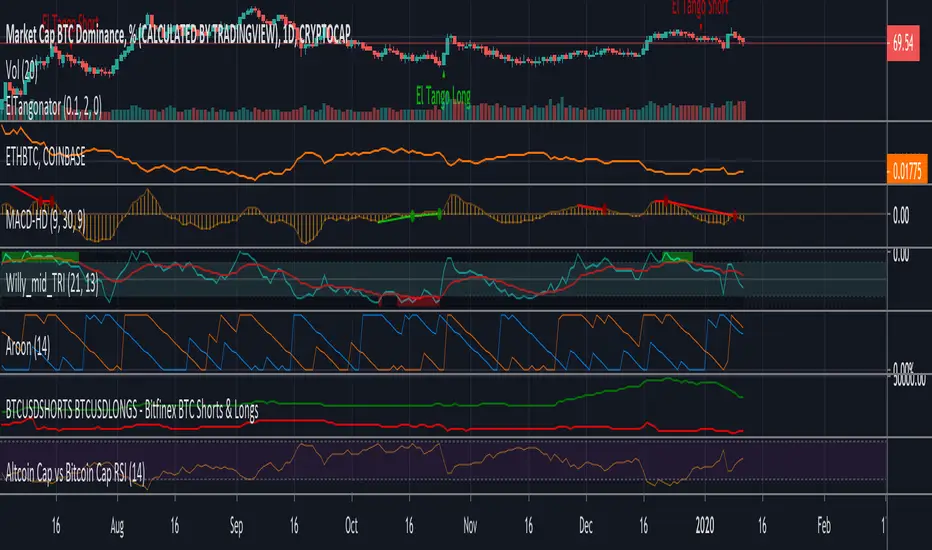
Dominion - Bitcoin Altcoin Dominance [mutantdog]A simple and easy reference tool displaying a plot of the market cap dominance values for several significant cryptocurrencies.
The most widely used of these is bitcoin dominance (the top indicator shown above) which calculates the total market cap of bitcoin in relation to the total cryptocurrency market cap, displayed as a percentage. This is commonly used by traders to assess the strength of bitcoin in relation to the broader crypto market; increasing values being indicative of larger bitcoin moves and decreasing values often indicative of potential altcoin cycles. Likewise, ethereum dominance (the bottom indicator shown above) is frequently used as a means to indicate the strength of ethereum in relation to the broader crypto market.
Included options for marketcap dominance values are:
Bitcoin : CRYPTOCAP:BTC.D
Ethereum : CRYPTOCAP:ETH.D
Total DeFi (a composite of multiple top defi tokens): CRYPTOCAP:TOTALDEFI.D
Stablecoins (shows the combined dominance values for usdt and usdc): CRYPTOCAP:USDT.D + CRYPTOCAP:USDC.D
Flippening (shows the difference between bitcoin and ethereum dominance values): CRYPTOCAP:BTC.D - CRYPTOCAP:ETH.D
When used in combination with each other, these can provide a good overview of the general flow of capital within the crypto market.
Additional functionality:
up to three optional moving averages with a choice of SMA, EMA, WMA and RMA for each.
multi timeframe selector
alert condition presets for various moving average crosses.
Please be aware that, while useful as reference, dominance calculations are known to repaint frequently. As such the use of this indicator and its alerts should require caution.

{Gunzo} Stock to Flow (Gold, Silver, Dollar, Bitcoin)This indicator displays the Stock to Flow (S2F) ratio for popular commodities (Gold, Silver, Dollar, Euro, Bitcoin, Ethereum) in order to
compare them and determine which ones could be a good Store of Value (SoV).
OVERVIEW :
Stock to Flow is a popular indicator used to predict commodities scarcity. It evaluates the total stock of a commodity against the total amount that can be produced during a year. This model supposes that if scarcity is increasing, the price is going to increase.
This model has been used over the last years on Bitcoin to determine if the asset was undervalued or overvalued, and even make prediction models on the future price.
This script is going to focus on the Stock to Flow ratio (total stock/amount produced) to compare the following assets over time :
Mining resources (mined) for Gold and Silver
Cryptos assets (mined) for Bitcoin and Ethereum
FIAT currencies (banknotes printed) for Dollar and Euro
CALCULATION :
The calculation of the Stock to Flow ratio evaluates the total stock of a commodity produced against the production made for a specific year. The data is calculated on a yearly basis, then interpolated to get monthly or daily values.
DATA ORIGIN :
The main information needed to calculate the Stock to Flow ratio is the "yearly production" of a commodity. I tried to retrieve that information from the most reliable sources :
for Gold from research on www.gold.org
for Silver from research on www.silverinstitute.org
for Ethereum from research on etherscan.io
for Bitcoin from data source "QUANDL:BCHAIN/TOTBC" from www.quandl.com
for Dollar from research on www.federalreserve.gov
for Euro from research on www.ecb.europa.eu
SETTINGS :
Smoothing for interpolated data : Smoothing factor for assets that are calculated yearly and then interpolated (Gold, Silver, Dollar, Euro, and Ethereum)
Smoothing for non interpolated data : Smoothing factor for assets that are calculated daily and not interpolated (Bitcoin)
Display asset names : Display assets names in a colored rectangle on the right side of the chart
Display asset values : Display assets Stock to Flow ratio in a colored rectangle on the right side of the chart
Display key events for assets : Display important events for the assets at the bottom of the chart using the same color as the assets lines (for example Orange diamond is a Bitcoin halving). Please refer to the script code for the details of all events.
USAGE :
This script can be used on any asset available on TradingView as the data used is either static or external.
However I recommend using it the Gold asset from currency.com as the depth of the chart will be bigger (since 1980s).
It is recommended to used this script on the monthly timeframe as the chart data is calculated yearly and then interpolated.

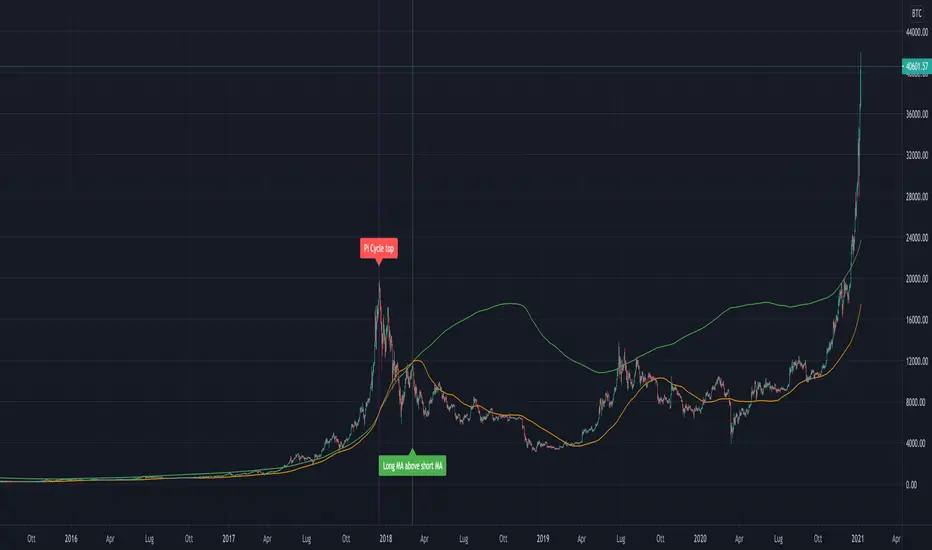
Pi Cycle Bitcoin Top IndicatorThe script implements the Pi Cycle Top indicator
This indicator identifies tops in the bitcoin market cycle. Historically, the Pi Cycle Top indicator has called out tops in the price of bitcoin within three days.
The script is very easy to use and it is possible to change the following parameters:
the time interval (default value is day);
the days of long moving average (default value is 365)
the days of short moving average (default value is 111)
show the moving average plots
show the Pi Cycle Top label highlighting the cross-point
[5F] Total circulating Bitcoin-═════════════════════════-
📋 Description :
This script displays several informations about Bitcoin :
the maximum number of Bitcoin
number of mined BTC
number of unmined BTC
calcul them in %
shows the previous halving date
📆 Note : need to be in dayli resolution or higher
Thanks to all Pinecoders who share their work with the community.
-═════════════════════════-

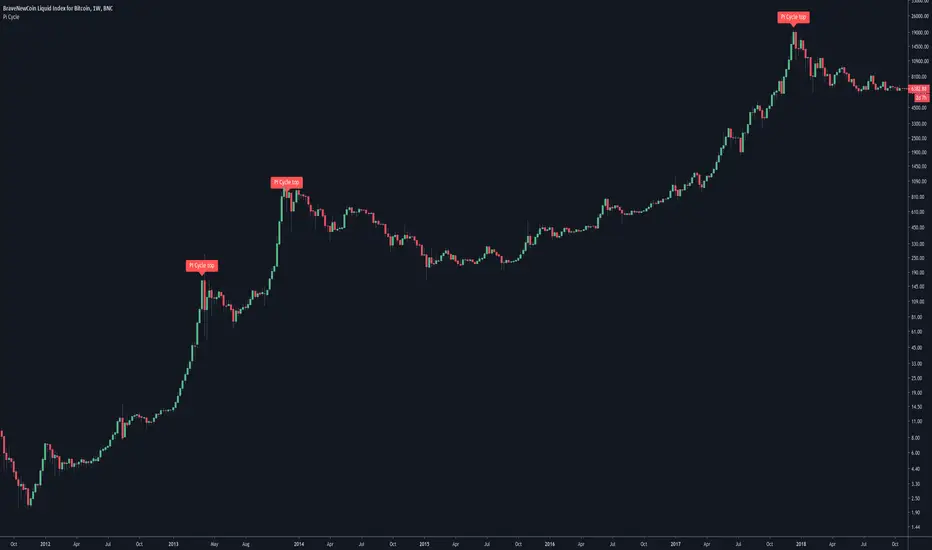
Pi Cycle Bitcoin top indicatorThe Pi Cycle Top Indicator has historically been effective in picking out the timing of market cycle highs to within 3 days.
It uses the 111 day moving average (111DMA) and a newly created multiple of the 350 day moving average, the 350DMA x 2.
Note: The multiple is of the price values of the 350DMA not the number of days.
For the past three market cycles, when the 111DMA moves up and crosses the 350DMA x 2 we see that it coincides with the price of Bitcoin peaking.
It is also interesting to note that 350 / 111 is 3.153, which is very close to Pi = 3.142. In fact, it is the closest we can get to Pi when dividing 350 by another whole number.
It once again demonstrates the cyclical nature of Bitcoin price action over long time frames. Though in this instance it does so with a high degree of accuracy over the past 7 years.
Full Credit to PositiveCrypto
Altcoin Cap vs Bitcoin Cap RSIFollowing Willy Woo study of Altcoin Cap vs Bitcoin Cap RSI
charts.woobull.com
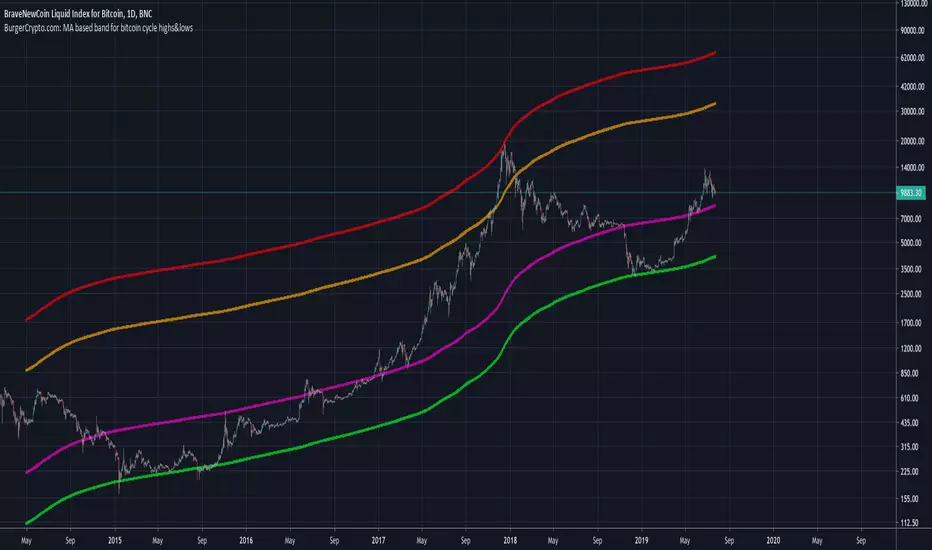
BurgerCrypto.com: MA based band for bitcoin cycle highs&lowsWarning: This script works only on a daily chart and only works for bitcoin charts with a long history. Best to be used on the BLX chart as it goes back to July 2010.
This script shows you the Moving Average with the length of a full bitcoin cycle, in which a cycle is defined as a period between two reward halvings; i.e. 210.000 blocks.
After data analysis in Python, I found that the average inter arrival time is a bit lower than the often communicated 10minutes; it's 9.46minutes, which makes the 210.000 block interval equal to 1379days.
The 1379d Moving Average seems to serve well as a support for the price of bitcoin over time and it's 4th 2^n multiple did a good job in catching the cycle tops.
If you like this indicator, please leave some claps for the Medium article in which I introduced this indicator:
medium.com
CL Daily Bitcoin Volume (All exchange included, even Mt.GOX)This daily volume data contains collective total from
____________________________________________________
Historical:
BTC-e BTC/USD (From Q3 2011 to Q3 2016)
BTCChina BTC/CNY (From Q3 2011 to Q2 2017)
Coinsetter BTC/USD (From Q3 2014 to Q1 2016)
MtGox BTC/USD (From July 2010 - 2014 only))
OKcoin International BTC/USD (From Q3 2014 to Q2 2017)
____________________________________________________
Institutions:
CME Bitcoin Futures
Grayscale Bitcoin Trust OTC
____________________________________________________
Spot exchanges:
Bitfinex BTC/USD
Bitstamp BTC/USD
Coinbase BTC/USD
Coinbase BTC/EUR
Binance BTC/USDT
Binance BTC/USDC
Binance BTC/PAX
Gemini BTC/USD
itBit BTC/USD
Kraken BTC/EUR
Kraken BTC/USD
Huobi BTC/USDT
Korbit BTC/KRW
Bitflyer BTC/JPY
____________________________________________________
Others:
Bitmex

Pivot Point Daily prediction bitcoin - by Simon-RoseThis is an additional Script to my recent Pivot Point indicator scripts which will show you the next days pivot points based on the actual price range.
This is useful if you are trading right before a new day and want to know how the next bdays pivot points may be placed.
If you have any questions or suggestions pls write me :)
Happy trading
Cheers
Daily Pivots:
Weekly Version:
Monthly Version:

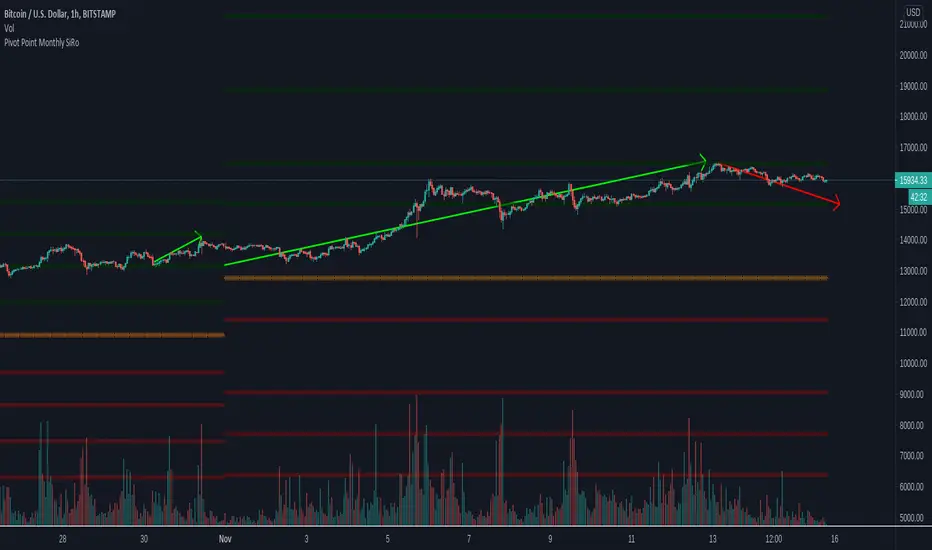
Pivot Point Monthly - bitcoin by Simon-RoseMonthly Version:
I have written 3 Indicators because i couldn't find what i was looking for in the library, so you can turn each one on and off individually for better visibility.
This are Daily, Weekly and Monthly Pivot Points with their Resistance and Support Points
and also on the Daily with the range between them.
I will also publish some Ideas to show you how to use them if you are not familiar with the traditional pivot points strategy already.
Unlike the usually 3 support & resistances i added 4 of them, specifically for trading bitcoin (on traditional markets this level of volatility usually never gets touched)
Here you can see which lines are what for reference, as the Feature to label lines is missing in Pinescript (if you have a workaround pls tell me ;) )
This is the basic calculation used :
PP = (xHigh+xLow+xClose) / 3
R1 = vPP+(vPP-Low)
R2 = vPP + (High - Low)
R3 = xHigh + 2 * (vPP - Low)
R4 = xHigh + 3 * (vPP - Low)
S1 = vPP-(High - vPP)
S2 = vPP - (High - Low)
S3 = xLow - 2 * (High - PP)
S4 = xLow - 3 * (High - PP)
If you have any questions or suggestions pls write me :)
Happy trading
Cheers
Daily Version:
Weekly Version: