Flux Charts SFX Algo (Premium)Flux Charts SFX Algo indicator is a comprehensive and sophisticated all-in-one toolkit designed to cater to all the technical analysis needs of traders. Developed and designed by Russell W., head developer at Flux Charts.
The Flux Charts SFX Algo indicator stands apart with its unique ability to seamlessly integrate with various forms of technical analysis, while also offering the option to function as a standalone toolkit adaptable to any trading style. The indicator has been designed to take into account the dynamic nature of market conditions, ensuring that every feature included remains relevant, reliable, and effective.
Traders have countless possibilities when utilizing this indicator, allowing for the exploration and analysis of an array of cutting-edge features over time. This enables traders to selectively employ the features that align best with their individual trading styles and build a personal trading strategy.
The Flux Charts SFX Algo indicator is set to revolutionize the way traders approach technical analysis, providing them with the tools and insights needed to navigate complex financial markets with confidence and precision.
Flux Charts SFX Algo works in all markets (stocks, crypto, forex, futures, bonds, options, etc) and has many features including:
Buy signals (Not to be followed blindly)
Sell signals (Not to be followed blindly)
Buy & Sell Signal Ratings (Higher rating doesn't necessarily mean a "better" signal)
Algorithm Weighting Customization
Algorithm Sensitivity Customization
Algorithm Signal Strength Filter
Take Profit signals
Take Profit Retest signals
Take Profit Level Optimization
Trend Candle Coloring
Volatility Bands
+ more
What it does
The indicator uses an Adjusted Weighted majority algorithm to generate "buy" and "sell" signals. The algorithm takes into account several market metrics and weights them based on their recent performance. How far back the algorithm checks is based on the “Time Weighting” setting. This allows users to choose between having more data points or having more recency bias within the algorithm, but less data to decipher.
How it works and what differentiates it
There are many popular strategies in the market all of which go in and out of successful periods. The SFX algorithm effectively uses popular indicators or "experts" and weights them using a period decided through the "Time Weighting" Setting. The "experts" include popular indicators that cover Momenutmn, ATR trends, and EMA trends. Adjusted Weighted Majority typically weighs only through binary events however the SFX also uses a dynamic system to punish larger losses. The total weighting is then used to confirm a signal is agreeing with the most successful "experts" or indicators within the time period. This effectively will filter poor signals during periods of underperformance compared to other indicators and the converse during performant periods.
This weighting algorithm was inspired by the Princeton University lecture "Multiplicative Weight Algorithm" by Sanjeev Arora!
Usage
CME_MINI:ES1! 3 minute timeframe, July 7 2023.
Indicator Settings: (Sensitivity: 70, Signal Strength: 40, Time Weighting: Recent Trends)
The star-rated signals show the strength of the signals based on our weighting system
The colored candles (green & red) simplify the market into basic uptrends/downtrends
The volatility bands show areas of potential reversals
The volatility bands also show potential breakouts (Tight bands = consolidation, which could lead to an impulsive move)
The take profit signals suggest areas where profits should be taken in a trade
Settings and their Usage
Algorithm Settings Explained
Sensitivity determines how frequently signals appear. A higher sensitivity would lead to more frequent signals (Buy & Sell) appearing on your chart
Signal Strength helps filter out low-rated signals based on our Stochastic Weighting Algorithm. A higher signal strength will lead to fewer signals on your chart. A higher-rated signal doesn't necessarily make it a better signal than a lower-rated signal.
Time Weighting allows you to choose how much historic data you want the indicator to use when interpreting data for the signals. There are three options to choose from including:
- Recent Trends
- Mixed Trends
- Longterm Trends
Using the "Recent Trends" option will only use recent market data when looking at the market metrics our algorithm uses for generating "Buy" and "Sell" signals. Thus, there will be a recency bias which means the metrics the algorithm is weighing more heavily have recently performed well.
Using the "Longterm Trends" option will use more historic market data when looking at the market metrics our algorithm uses. This will give more data points for the algorithm to use, but it won't count for recent performances, but rather an overall performance in the past. Thus, if one metric has been doing poorly recently, it will still receive the same weight, even though it was performing well at the start of our lookback period for data.
Using the "Mixed Trends" option will give you a choice that is in between these two options. This will give you a good balance between having enough data points for market metrics, while also sustaining a good bit of market recency bias.
In den Scripts nach "binary" suchen

Liquidation Ranges + Volume/OI Dots [Kioseff Trading]Hello!
Introducing a multi-faceted indicator "Liquidation Ranges + Volume Dots" - this indicator replicates the volume dot tools found on various charting platforms and populates a liquidation range on crypto assets!
Features
Volume/OI dots populated according to user settings
Size of volume/OI dots corresponds to degree of abnormality
Naked level volume dots
Fixed range capabilities for volume/OI dots
Visible time range capabilities for volume/OI dots
Lower timeframe data used to discover iceberg orders (estimated using 1-minute data)
S/R lines drawn at high volume/OI areas
Liquidation ranges for crypto assets (10x - 100x)
Liquidation ranges are calculated using a popular crypto exchange's method
# of violations of liquidation ranges are recorded and presented in table
Pertinent high volume/OI price areas are recorded and presented in table
Personalized coloring for volume/OI dots
Net shorts / net long for the price range recorded
Lines shows reflecting net short & net long increases/decreases
Configurable volume/OI heatmap (displayed between liquidation ranges)
And some more (:
Liquidation Range
The liquidation range component of the indicator uses a popular crypto exchange's calculation (for liquidation ranges) to populate the chart for where 10x - 100x leverage orders are stopped out.
The image above depicts features corresponding to net shorts and net longs.
The image above shows features corresponding to liquidation zones for the underlying coin.
The image above shows the option to display volume/oi delta at the time the corresponding grid was traded at.
The image above shows an instance of using the "fixed range" feature for the script.
*The average price of the range is calculated to project liquidation zones.
*Heatmap is calculated using OI (or volume) delta.
Huge thank you to Pine Wizard @DonovanWall for his range filter code!
Price ranges are automatically detected using his calculation (:
Volume / OI Dots
Similar to other charting platforms, the volume/OI dots component of the indicator distinguishes "abnormal" changes in volume/OI; the detected price area is subsequently identified on the chart.
The detection method uses percent rank and calculates on the last bar of the chart. The "agelessness" of detection is contingent on user settings.
The image above shows volume dots in action; the size of each volume dot corresponds to the amount of volume at the price area.
Smaller dots = lower volume
Larger dots = higher volume
The image above exemplifies the highest aggression setting for volume/OI dot detection.
The table oriented top-right shows the highest volume areas (discovered on the 1-minute chart) for the calculated period.
The open interest change and corresponding price level are also shown. Results are listed in descending order but can also be listed in order of occurrence (most relevant).
Additionally, you can use the visible time range feature to detect volume dots.
The feature shows and explains how the visible range feature works. You select how many levels you want to detect and the script will detect the selected number of levels.
For instance, if I select to show 20 levels, the script will find the 20 highest volume/OI change price areas and distinguish them.
The image above shows a narrower price range.
The image above shows the same price range; however, the script is detecting the highest OI change price areas instead of volume.
* You can also set a fixed range with this feature
* Naked levels can be used
Additionally, you can select for the script to show only the highest volume/ OI change price area for each bar. When active, the script will successively identify the highest volume / OI change price area for the most recent bars.
Naked Levels
The image above shows and explains how naked levels can be detected when using the script.
And that's pretty much it!
Of course, there're a few more features you can check out when you use the script that haven't been explained here (:
Thank you again to @DonovanWall
Thank you to @Trendoscope for his binary insertion sort library (:
Thank you to @PineCoders for their time library
Thank you for checking this out!

DarkWaveColorThemesLibrary "DarkWaveColorThemes"
Description:
A simple, binary color-theming library that provides you with easy-access 'bullish and bearish' colors which you can use to make your indicators more aesthetically pleasing. These color themes were developed to help the community make indicators look excellent with ease.
Functions:
1. getThemeColor(themeName, colorType)
Description:
This function returns a color (either a 'Bullish' or 'Bearish' color, depending on your 'colorType' parameter input) according to the theme you have supplied as the 'themeName' parameter.
Parameters:
themeName (string) : Specify the theme you want to reference. Options include: 'DarkWave', 'Synthwave', 'DarkWave Crypto', 'Crystal Pool', 'Aquafarer', 'Mystic Armor', 'Futurist', 'Electric Zest', 'Stealth Ride', 'Long Trader', 'Short Trader', 'Emerald Glow', 'Gold Heist', 'Floral', 'Cobalt Twilight', and 'Sunrise'.
colorType (string) : Specify which color you want to reference from the theme. Options include: 'Bullish' and 'Bearish'.
Returns:
Your specified color type according to your specified theme.

Arbitrary Price Point Probability (APPP)The "Arbitrary Price Point Probability" indicator is designed to calculate the probability of a given price point occurring within a certain range of prices. The indicator uses statistical analysis to determine the likelihood of a specific price point appearing based on the market data.
The indicator works by taking the input price, which is the price point for which the probability is being calculated. The indicator then calculates the mean and standard deviation of the prices over a certain period specified by the user. The length of the period for calculating the mean and standard deviation is also specified by the user.
Once the mean and standard deviation have been calculated, the indicator uses them to calculate the probability of the input price point occurring within the range of prices over the specified period. The indicator does this by calculating the z-score, which is the number of standard deviations between the input price point and the mean price. The z-score is then used to calculate the probability using a t-distribution probability density function.
The t-distribution probability density function used by the indicator is a mathematical function that describes the likelihood of obtaining a particular value from a t-distribution. A t-distribution is a statistical distribution used when the sample size is small, and the population standard deviation is unknown.
The indicator also uses a binary search algorithm to find the t-value for a given confidence level. The t-value is the number of standard deviations from the mean at which the confidence interval is set. The confidence level is set by the user, and the default value is 99%.
Overall, the "Arbitrary Price Point Probability" indicator is a useful tool for traders who want to determine the probability of a particular price point occurring within a certain range of prices. The indicator can be used in conjunction with other technical analysis tools to make more informed trading decisions.

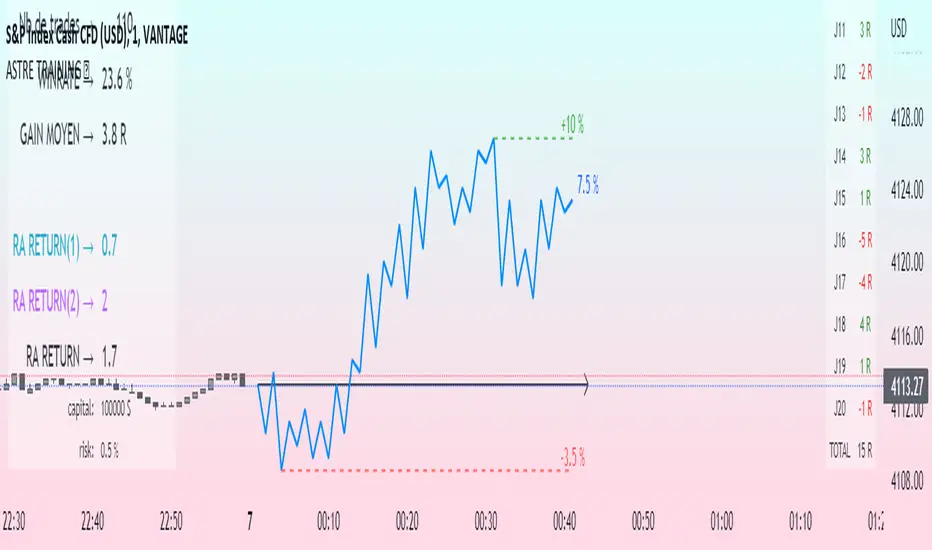
Challenge training (journal)Dynamic trading journal with equity curve display. Detailed results with prop firm objectives, editable, $/month estimation, possibility to compare two strategies.
one line in parameter = one trading day. 20 days max.
For each trading day, specify : The number of trades, the number of SL, the number of total winning RR.
A table at the bottom right summarizes the days and performances during the backtest in order to have an idea of the current performance.
The bottom left table summarizes the overall performance with some key information.
Depending on the number of days traded, a monthly "salary" is deducted, taking into account the prop firm commission.
there is the possibility to define a "Type" for each trading day, 1 or 2. It allows to compare in a binary way, example for type 1: when the high time frame structure is doing well and I am confident for scalping, otherwise type 2.
Again: type 1: SL shorter by 50%, type 2: normal SL etc..
the button "separate 1 and 2" allows to display two additional equity curves : type 1 and type 2. It allows to have a quick visual comparison on the impact of our parameter studied in our backtest on our performance. at the scale of the main equity curve
All the conditions to succeed in the challenge are adjustable in the parameters. The drawdown calculation has been simplified - in order not to have to put 80 trades in the parameters window, I have gathered them by "day", and pessimistically, we consider first the stoplosses and then the take profits, simplifying the performances of the day into "one losing trade" and "one winning trade" (graphically). It is a good compromise between quantity and quality.
Use "A random day trading" indicator to spice up your training.
I hope this will be useful for you to track your performance !
MACD Optimizer Pro [Kioseff Trading]Massive update! This script now includes 12 different moving averages and 30+ built-in technical indicators to enhance your trading strategy optimization! (:
This script (MACD Optimizer Pro) allows the user to optimize and test hundreds of MACD strategies, simultaneously, in under 40 seconds. Of course, theoretically, an unlimited number of trading strategies can be tested with the MACD Optimizer Pro. After the optimization period - the MACD Optimizer Pro will show the most profitable MACD strategy or, should you choose, the highest win-rate MACD strategy or the most-efficient MACD strategy!
Optimization results can be backtested and verified using the native TradingView backtester - which is included in the MACD Optimizer Pro - and made easy to use! This feature makes settings alerts a simple practice!
Features
Test hundreds of MACD strategies, simultaneously, in under 40 seconds.
Optimize long MACD strategies and short MACD strategies.
12 different built-in moving averages included to improve your MACD strategy.
30+ built-in technical indicators to improve your MACD strategy.
Runs as a strategy script - profit factor, PnL , win-rate, number of trades, max drawdown, equity curve and other pertinent statistics shown.
Alerts
Optimize any MACD setting
Profit targets, trailing stops, fixed stop losses, and a binary MACD strategy can all be tested.
Strategies can be optimized for highest win rate, highest net profit, most efficient profit.
Limit orders can be simulated.
External indicators can be used for optimization i.e. your own, custom-built indicator, an indicator from your favorite author, or almost any publicly available
TradingView indicator.
Date range for optimization and backtesting are configurable.
Explanation
The image above shows a list of configurations for the optimizer. You can
You can test hundreds of different MACD settings in under 40 seconds on any timeframe, asset, etc.
The image above shows additional settings to filter the outcome of your optimization testing. Additionally, you can test an unlimited number of profit targets and stop losses!
You can add one of several built-in TradingView indicators to filter trade entries.
The image above shows all built-in moving averages and TradingView indicators that can be incorporated into your MACD strategy.
Additionally, you can add your own, custom indicator to the optimization test, your favorite indicator by your favorite author or almost any publicly available indicator on TradingView.
The image above shows the settings section in which you can implement this feature.
The image above shows an example of the custom indicator feature! In this instance, I am using the public indicator titled "Self-Optimizing" RSI and requiring it to measure below a level prior to entry! Almost any custom indicator, your favorite indicator, etc. is compatible with this feature!
The MACD Optimizer has improved user friendliness over previous versions. The optimizer can be as simple or complex as you'd like - capable of handling both "easy" and "difficult" tasks at your discretion.
Additionally, you can configure the optimizer to prioritize MACD strategies that earn profit most efficiently!
The image above shows this feature in action.
You can also configure the optimizer to prioritize MACD strategies that achieve the highest win rate!
The image above shows this feature in action.
Instructions
The instructions below show a rudimentary approach to using the optimizer.
1. Build your strategy in the settings.
You should also disable the "Run a Backtest" feature to improve load times during optimization.
The image above shows my custom strategy settings.
Now that you've got some data on your chart - you should try "Freezing" the "Smoothing" setting for MACD . When doing this, the optimizer will test hundreds of MACD settings with a fixed "Smoothing" setting. Try using the best "Smoothing" setting you were able to find for your initial testing.
2. Take the best "Smoothing" setting and test various MACD and Signal Lengths.
The image above shows me configuring the MACD Optimizer to test different MACD line lengths and Signal line lengths with a fixed "smoothing" setting.
From the results, we can see that there are better MACD settings than what was shown in our initial test!
With this information we can execute a TradingView backtest.
3. Execute a TradingView Backtest.
You must enable the "Run a Backtest" feature to perform a TradingView backtest. Additionally, it's advised to enable the "STOP OPTIMIZATION" feature when performing a TradingView backtest. Enabling this feature will improve load times for the backtest to only a few seconds (since the optimizer won't look for the best setting when this feature is enabled).
The image above shows completion of the process!
From here, you can perform further testing, set alerts, etc.
Backtest Settings Shown
Initial Capital: The initial capital used for the shown backtests is $3,500 USD. Set the initial capital to replicate your true starting capital (: PnL for the MACD strategies (listed in table) is calculated using a starting capital of $10,000 USD.
Slippage: The slippage settings for the displayed backtest was set to 2 ticks.
Commission: Commission was adjusted to 0.1%.
Verify Price for Limit Orders was set to 2 ticks.
Optimization
Trading system optimization is immensely advantageous when executed with prudence.
Technical-oriented, mechanical trading systems work when a valid correlation is methodical to the extent that an objective, precisely-defined ruleset can consistently exploit it. If no such correlation exists, or a technical-oriented system is erroneously designed to exploit an illusory correlation (absent predictive utility), the trading system will fail.
Evaluate results practically and test parameters rigorously after discovery. Simply mining the best-performing parameters and immediately trading them is unlikely a winning strategy. Put as much effort into testing strong-performing parameters and building an accompanying system as you would any other trading strategy. Automated optimization involves curve fitting - it's the responsibility of the trader to validate a replicable sequence or correlation and the trading system that exploits it.
Thanks for checking this out!
Bezahltes Script

Delta-Agnostic Correlation Coefficient (alt)Calculate a sort of correlation between two symbols based only on the sign of their changes, regardless of the amplitude of price change.
When positive, the two symbols tend to move together. When negative, the symbols move in opposite directions.
Since there is no significance calculation, and that the result is binary, keep in mind that correlation will always tend to go towards 1 or -1 even when there is no correlation. To reduce this issue, an EMA or SMA is applied to smooth out transitions: SMA smoothes over the selected length period but adds lag, whereas EMA smoothes amplitude without any additional lag. Hence, to know if the correlation is true or not, try to look at the amplitude and the number of consecutive days the correlation is maintained (both quantities are related), because when the correlation is spurious, it will tend to switch more or less alternatively between 1 and -1 and hence will hover around 0, whereas if the correlation is true, it will get further away from 0 and closer to 1 or -1.
In addition, since there is some time lag for the correlation to switch sign, the area is colored to know the current candle's correlation, regardless of past data's correlation: blue is a positive correlation (1), yellow is negative. The coloring can allow to know a trend reversal early on, but it's noisy.
Finally, symbols with closing days are better accounted for, with the correlation set to 0 on closed days (e.g., on week-ends), and the area is then colored in gray to signal that there is no new correlation data.
This is an improved fork over the original indicator by alexjvale, please show him some love if you like this work:

Candlestick Pattern Criteria and Analysis Indicator█ OVERVIEW
Define, then locate the presence of a candle that fits a specific criteria. Run a basic calculation on what happens after such a candle occurs.
Here, I’m not giving you an edge, but I’m giving you a clear way to find one.
IMPORTANT NOTE: PLEASE READ:
THE INDICATOR WILL ALWAYS INITIALLY LOAD WITH A RUNTIME ERROR. WHEN INITIALLY LOADED THERE NO CRITERIA SELECTED.
If you do not select a criteria or run a search for a criteria that doesn’t exist, you will get a runtime error. If you want to force the chart to load anyway, enable the debug panel at the bottom of the settings menu.
Who this is for:
- People who want to engage in TradingView for tedious and challenging data analysis related to candlestick measurement and occurrence rate and signal bar relationships with subsequent bars. People who don’t know but want to figure out what a strong bullish bar or a strong bearish bar is.
Who this is not for:
- People who want to be told by an indicator what is good or bad or buy or sell. Also, not for people that don’t have any clear idea on what they think is a strong bullish bar or a strong bearish bar and aren’t willing to put in the work.
Recommendation: Use on the candle resolution that accurately reflects your typical holding period. If you typically hold a trade for 3 weeks, use 3W candles. If you hold a trade for 3 minutes, use 3m candles.
Tldr; Read the tool tips and everything above this line. Let me know any issues that arise or questions you have.
█ CONCEPTS
Many trading styles indicate that a certain candle construct implies a bearish or bullish future for price. That said, it is also common to add to that idea that the context matters. Of course, this is how you end up with all manner of candlestick patterns accounting for thousands of pages of literature. No matter the context though, we can distill a discretionary trader's decision to take a trade based on one very basic premise: “A trader decides to take a trade on the basis of the rightmost candle's construction and what he/she believes that candle construct implies about the future price.” This indicator vets that trader’s theory in the most basic way possible. It finds the instances of any candle construction and takes a look at what happens on the next bar. This current bar is our “Signal Bar.”
█ GUIDE
I said that we vet the theory in the most basic way possible. But, in truth, this indicator is very complex as a result of there being thousands of ways to define a ‘strong’ candle. And you get to define things on a very granular level with this indicator.
Features:
1. Candle Highlighting
When the user’s criteria is met, the candle is highlighted on the chart.
The following candle is highlighted based on whether it breaks out, breaks down, or is an inside bar.
2. User-Defined Criteria
Criteria that you define include:
Candle Type: Bull bars, Bear bars, or both
Candle Attributes
Average Size based on Standard Deviation or Average of all potential bars in price history
Search within a specific price range
Search within a specific time range
Clarify time range using defined sessions and with or without weekends
3. Strike Lines on Candle
Often you want to know how price reacts when it gets back to a certain candle. Also it might be true that candle types cluster in a price region. This can be identified visually by adding lines that extend right on candles that fit the criteria.
4. User-Defined Context
Labeled “Alternative Criteria,” this facet of the script allows the user to take the context provided from another indicator and import it into the indicator to use as a overriding criteria. To account for the fact that the external indicator must be imported as a float value, true (criteria of external indicator is met) must be imported as 1 and false (criteria of external indicator is not met) as 0. Basically a binary Boolean. This can be used to create context, such as in the case of a traditional fractal, or can be used to pair with other signals.
If you know how to code in Pinescript, you can save a copy and simply add your own code to the section indicated in the code and set your bull and bear variables accordingly and the code should compile just fine with no further editing needed.
Included with the script to maximize out-of-the-box functionality, there is preloaded as alternative criteria a code snippet. The criteria is met on the bull side when the current candle close breaks out above the prior candle high. The bear criteria is met when the close breaks below the prior candle. When Alternate Criteria is run by itself, this is the only criteria set and bars are highlighted when it is true. You can qualify these candles by adding additional attributes that you think would fit well.
Using Alternative Criteria, you are essentially setting a filter for the rest of the criteria.
5. Extensive Read Out in the Data Window (right side bar pop out window).
As you can see in the thumbnail, there is pasted a copy of the Data Window Dialogue. I am doubtful I can get the thumbnail to load up perfectly aligned. Its hard to get all these data points in here. It may be better suited for a table at this point. Let me know what you think.
The primary, but not exclusive, purpose of what is in the Data Window is to talk about how often your criteria happens and what happens on the next bar. There are a lot of pieces to this.
Red = Values pertaining to the size of the current bar only
Blue = Values pertaining or related to the total number of signals
Green = Values pertaining to the signal bars themselves, including their measurements
Purple = Values pertaining to bullish bars that happen after the signal bar
Fuchsia = Values pertaining to bearish bars that happen after the signal bar
Lime = Last four rows which are your percentage occurrence vs total signals percentages
The best way I can explain how to understand parts you don’t understand otherwise in the data window is search the title of the row in the code using ‘ctrl+f’ and look at it and see if it makes more sense.
█ [b}Available Candle Attributes
Candle attributes can be used in any combination. They include:
[*}Bodies
[*}High/Low Range
[*}Upper Wick
[*}Lower Wick
[*}Average Size
[*}Alternative Criteria
Criteria will evaluate each attribute independently. If none is set for a particular attribute it is bypassed.
Criteria Quantity can be in Ticks, Points, or Percentage. For percentage keep in mind if using anything involving the candle range will not work well with percentage.
Criteria Operators are “Greater Than,” “Less Than,” and “Threshold.” Threshold means within a range of two numbers.
█ Problems with this methodology and opportunities for future development:
#1 This kind of work is hard.
If you know what you’re doing you might be able to find success changing out the inputs for loops and logging results in arrays or matrices, but to manually go through and test various criteria is a lot of work. However, it is rewarding. At the time of publication in early Oct 2022, you will quickly find that you get MUCH more follow through on bear bars than bull bars. That should be obvious because we’re in the middle of a bear market, but you can still work with the parameters and contextual inputs to determine what maximizes your probability. I’ve found configurations that yield 70% probability across the full series of bars. That’s an edge. That means that 70% of the time, when this criteria is met, the next bar puts you in profit.
#2 The script is VERY heavy.
Takes an eternity to load. But, give it a break, it’s doing a heck of a lot! There is 10 unique arrays in here and a loop that is a bit heavy but gives us the debug window.
#3 If you don’t have a clear idea its hard to know where to start.
There are a lot of levers to pull on in this script. Knowing which ones are useful and meaningful is very challenging. Combine that with long load times… its not great.
#4 Your brain is the only thing that can optimize your results because the criteria come from your mind.
Machine learning would be much more useful here, but for now, you are the machine. Learn.
#5 You can’t save your settings.
So, when you find a good combo, you’ll have to write it down elsewhere for future reference. It would be nice if we could save templates on custom indicators like we can on some of the built in drawing tools, but I’ve had no success in that. So, I recommend screenshotting your settings and saving them in Notion.so or some other solid record keeping database. Then you can go back and retrieve those settings.
#6 no way to export these results into conditions that can be copy/pasted into another script.
Copy/Paste of labels or tables would be the best feature ever at this point. Because you could take the criteria and put it in a label, copy it and drop it into another strategy script or something. But… men can dream.
█ Opportunities to PineCoders Learn:
1. In this script I’m importing libraries, showing some of my libraries functionality. Hopefully that gives you some ideas on how to use them too.
The price displacement library (which I love!)
Creative and conventional ways of using debug()
how to display arrays and matrices on charts
I didn’t call in the library that holds the backtesting function. But, also demonstrating, you can always pull the library up and just copy/paste the function out of there and into your script. That’s fine to do a lot of the time.
2. I am using REALLY complicated logic in this script (at least for me). I included extensive descriptions of this ? : logic in the text of the script. I also did my best to bracket () my logic groups to demonstrate how they fit together, both for you and my future self.
3. The breakout, built-in, “alternative criteria” is actually a small bit of genius built in there if you want to take the time to understand that block of code and think about some of the larger implications of the method deployed.
As always, a big thank you to TradingView and the Pinescript community, the Pinescript pros who have mentored me, and all of you who I am privileged to help in their Pinescripting journey.
"Those who stay will become champions" - Bo Schembechler

Probability Effort Scalper [PES]Probability Effort Scalper
Indicator is made of Two Basic Component
1. Probability Distribution Filter
2. Cumulative Effort Volumes
What is a Probability Distribution Filter ?
A filter which segregate the outcomes of any experiment into binary score of momentum based probabilities, so the filter is actually acting as a classifier to classify the probability of future occurrence of any event { in this case Stock prices going up / going down } { Long/ Short / Exit } by Binomial fitting method.
So the script uses Predictive Differential Filter, for filtering out the probability distribution, it actually uses differential calculations on binomial models.
Basic Assumptions:
That the Stock prices are in semi-strong efficiency
That the Stock prices follow up the Binomial Distribution
What is Cumulative Effort Volume
Effort Volume estimation is the process of predicting the most realistic amount of Volume Required to Push the Prices up or down, Its a group estimation model,
works on law of effort vs results and estimates the flow of the prices, (same as fluid dynamics), it's basically used to justify the harmony and Divergence occurrence in probability distribution.
How to use the Indicator
Simple Concept :
{ Signal candle = candle with a Triangle mark }
Long on the High of the Long Signal Candle,
Short on the Low of the Short Signal Candle
Exit on the Candle where "X" is present
For Long / Buy Signals {refer image below}
For Short / Sell Signals {refer image below}
Provisions for Alerts
Listed below are the Types of Alerts :
BUY SIGNAL
SELL SIGNAL
BOTH BUY/SELL SIGNAL
ALL STOP / EXIT SIGNALS
EXIT FROM LONG
EXIT FROM SHORT
What Securities will it work upon ?
The indicator works on every liquid security : stocks, futures, futures of indexes, forex, crypto : Having a Volume Informations provided by tradingview
Since the Indicator uses Volume Effort Estimation, The securities that you can apply the indicator on should be liquid
How to Get Access
Just Private Message me, would be happy to help you out !
Do not use comment box for asking for access, use it only for constructive feedbacks

HexLibrary "Hex"
Hex String Utility
intToHex(_n)
helper Binary half octet to hex character
Parameters:
_n : Digits to convert
fromDigits(_input, _buffer)
Digits to Hex String output
Parameters:
_input : Integer Input
_buffer : Number of 0's to pad Hex with
Returns: string output hex character value buffered to desired length (00-ff default)
FunctionKellyCriterionLibrary "FunctionKellyCriterion"
Kelly criterion methods.
the kelly criterion helps with the decision of how much one should invest in
a asset as long as you know the odds and expected return of said asset.
simplified(win_p, rr)
simplified version of the kelly criterion formula.
Parameters:
win_p : float, probability of winning.
rr : float, reward to risk rate.
Returns: float, optimal fraction to risk.
usage:
simplified(0.55, 1.0)
partial(win_p, loss_p, win_rr, loss_rr)
general form of the kelly criterion formula.
Parameters:
win_p : float, probability of the investment returns a positive outcome.
loss_p : float, probability of the investment returns a negative outcome.
win_rr : float, reward on a positive outcome.
loss_rr : float, reward on a negative outcome.
Returns: float, optimal fraction to risk.
usage:
partial(0.6, 0.4, 0.6, 0.1)
from_returns(returns)
Calculate the fraction to invest from a array of returns.
Parameters:
returns : array trade/asset/strategy returns.
Returns: float, optimal fraction to risk.
usage:
from_returns(array.from(0.1,0.2,0.1,-0.1,-0.05,0.05))
final_f(fraction, max_expected_loss)
Final fraction, eg. if fraction is 0.2 and expected max loss is 10%
then you should size your position as 0.2/0.1=2 (leverage, 200% position size).
Parameters:
fraction : float, aproximate percent fraction invested.
max_expected_loss : float, maximum expected percent on a loss (ex 10% = 0.1).
Returns: float, final fraction to invest.
usage:
final_f(0.2, 0.5)
hpr(fraction, trade, biggest_loss)
Holding Period Return function
Parameters:
fraction : float, aproximate percent fraction invested.
trade : float, profit or loss in a trade.
biggest_loss : float, value of the biggest loss on record.
Returns: float, multiplier of effect on equity so that a win of 5% is 1.05 and loss of 5% is 0.95.
usage:
hpr(fraction=0.05, trade=0.1, biggest_loss=-0.2)
twr(returns, rr, eps)
Terminal Wealth Relative, returns a multiplier that can be applied
to the initial capital that leadds to the final balance.
Parameters:
returns : array, list of trade returns.
rr : float , reward to risk rate.
eps : float , minimum resolution to void zero division.
Returns: float, optimal fraction to invest.
usage:
twr(returns=array.from(0.1,-0.2,0.3), rr=0.6)
ghpr(returns, rr, eps)
Geometric mean Holding Period Return, represents the average multiple made on the stake.
Parameters:
returns : array, list of trade returns.
rr : float , reward to risk rate.
eps : float , minimum resolution to void zero division.
Returns: float, multiplier of effect on equity so that a win of 5% is 1.05 and loss of 5% is 0.95.
usage:
ghpr(returns=array.from(0.1,-0.2,0.3), rr=0.6)
run_coin_simulation(fraction, initial_capital, n_series, n_periods)
run multiple coin flipping (binary outcome) simulations.
Parameters:
fraction : float, fraction of capital to bet.
initial_capital : float, capital at the start of simulation.
n_series : int , number of simulation series.
n_periods : int , number of periods in each simulation series.
Returns: matrix(n_series, n_periods), matrix with simulation results per row.
usage:
run_coin_simulation(fraction=0.1)
run_asset_simulation(returns, fraction, initial_capital)
run a simulation over provided returns.
Parameters:
returns : array, trade, asset or strategy percent returns.
fraction : float , fraction of capital to bet.
initial_capital : float , capital at the start of simulation.
Returns: array, array with simulation results.
usage:
run_asset_simulation(returns=array.from(0.1,-0.2,0.-3,0.4), fraction=0.1)
strategy_win_probability()
calculate strategy() current probability of positive outcome in a trade.
strategy_avg_won()
calculate strategy() current average won on a trade with positive outcome.
strategy_avg_loss()
calculate strategy() current average lost on a trade with negative outcome.

Overloaded Volume-Canddle v1This indicator will detect the candle has volume "too strong" base on "n" previous candle.
The Yellow Line is avg volume base n candle previous.
The Red line show over power volume of canlde.
Important : This indicator can use for forex, but i recommend it for binary options only.
Technimentals S&P Weighted FlowThis script runs a proprietary money flow algorithm three times with different user defined inputs on the subsectors of the S&P, weights their outputs directly according to their weighting in the S&P and then plots the cumulative total of the 33 outputs as a single line which overlays the chart.
The algorithm works by measuring relative volatility on each candlestick compared to the previous candlestick and compares that with it's smoothed recent volatility . This produces a binary (signum) output which is then weighted and accumulated.
The script is designed for use on shorter term timeframes. I do not recommend using this indicator on the daily timeframe or higher unless you lower the timeframe setting inside the script itself. The reason for this is that the signals it provides are often very slow and require zooming the chart out to get enough context to interpret the signals. For example, using this indicator on the one minute timeframe may produce signals several days out, or more!

Technimentals NDX Weighted FlowThis script runs a proprietary money flow algorithm three times with different user defined inputs on the top 20 components of the NDX, weights their outputs directly according to their weighting in the NDX and then plots the cumulative total of the 60 outputs as a single line which overlays the chart.
The algorithm works by measuring relative volatility on each candlestick compared to the previous candlestick and compares that with it's smoothed recent volatility . This produces a binary (signum) output which is then weighted and accumulated.
The script is designed for use on shorter term timeframes. I do not recommend using this indicator on the daily timeframe or higher unless you lower the timeframe setting inside the script itself. The reason for this is that the signals it provides are often very slow and require zooming the chart out to get enough context to interpret the signals. For example, using this indicator on the one minute timeframe may produce signals several days out.

Om Boy CandlesUsed by me to play binary option.
A little project to help my nephew decide which candle to refer to make SNR lines

pandas_taLibrary "pandas_ta"
Level: 3
Background
Today is the first day of 2022 and happy new year every tradingviewers! May health and wealth go along with you all the time. I use this chance to publish my 1st PINE v5 lib : pandas_ta
This is not a piece of cake like thing, which cost me a lot of time and efforts to build this lib. Beyond 300 versions of this script was iterated in draft.
Function
Library "pandas_ta"
PINE v5 Counterpart of Pandas TA - A Technical Analysis Library in Python 3 at github.com
The Original Pandas Technical Analysis (Pandas TA) is an easy to use library that leverages the Pandas package with more than 130 Indicators and Utility functions and more than 60 TA Lib Candlestick Patterns.
I realized most of indicators except Candlestick Patterns because tradingview built-in Candlestick Patterns are even more powerful!
I use this to verify pandas_ta python version indicators for myself, but I realize that maybe many may need similar lib for pine v5 as well.
Function Brief Descriptions (Pls find details in script comments)
bton --> Binary to number
wcp --> Weighted Closing Price (WCP)
counter --> Condition counter
xbt --> Between
ebsw --> Even Better SineWave (EBSW)
ao --> Awesome Oscillator (AO)
apo --> Absolute Price Oscillator (APO)
xrf --> Dynamic shifted values
bias --> Bias (BIAS)
bop --> Balance of Power (BOP)
brar --> BRAR (BRAR)
cci --> Commodity Channel Index (CCI)
cfo --> Chande Forcast Oscillator (CFO)
cg --> Center of Gravity (CG)
cmo --> Chande Momentum Oscillator (CMO)
coppock --> Coppock Curve (COPC)
cti --> Correlation Trend Indicator (CTI)
dmi --> Directional Movement Index(DMI)
er --> Efficiency Ratio (ER)
eri --> Elder Ray Index (ERI)
fisher --> Fisher Transform (FISHT)
inertia --> Inertia (INERTIA)
kdj --> KDJ (KDJ)
kst --> 'Know Sure Thing' (KST)
macd --> Moving Average Convergence Divergence (MACD)
mom --> Momentum (MOM)
pgo --> Pretty Good Oscillator (PGO)
ppo --> Percentage Price Oscillator (PPO)
psl --> Psychological Line (PSL)
pvo --> Percentage Volume Oscillator (PVO)
qqe --> Quantitative Qualitative Estimation (QQE)
roc --> Rate of Change (ROC)
rsi --> Relative Strength Index (RSI)
rsx --> Relative Strength Xtra (rsx)
rvgi --> Relative Vigor Index (RVGI)
slope --> Slope
smi --> SMI Ergodic Indicator (SMI)
sqz* --> Squeeze (SQZ) * NOTE: code sufferred from very strange error, code was commented.
sqz_pro --> Squeeze PRO(SQZPRO)
xfl --> Condition filter
stc --> Schaff Trend Cycle (STC)
stoch --> Stochastic (STOCH)
stochrsi --> Stochastic RSI (STOCH RSI)
trix --> Trix (TRIX)
tsi --> True Strength Index (TSI)
uo --> Ultimate Oscillator (UO)
willr --> William's Percent R (WILLR)
alma --> Arnaud Legoux Moving Average (ALMA)
xll --> Dynamic rolling lowest values
dema --> Double Exponential Moving Average (DEMA)
ema --> Exponential Moving Average (EMA)
fwma --> Fibonacci's Weighted Moving Average (FWMA)
hilo --> Gann HiLo Activator(HiLo)
hma --> Hull Moving Average (HMA)
hwma --> HWMA (Holt-Winter Moving Average)
ichimoku --> Ichimoku Kinkō Hyō (ichimoku)
jma --> Jurik Moving Average Average (JMA)
kama --> Kaufman's Adaptive Moving Average (KAMA)
linreg --> Linear Regression Moving Average (linreg)
mgcd --> McGinley Dynamic Indicator
rma --> wildeR's Moving Average (RMA)
sinwma --> Sine Weighted Moving Average (SWMA)
ssf --> Ehler's Super Smoother Filter (SSF) © 2013
supertrend --> Supertrend (supertrend)
xsa --> X simple moving average
swma --> Symmetric Weighted Moving Average (SWMA)
t3 --> Tim Tillson's T3 Moving Average (T3)
tema --> Triple Exponential Moving Average (TEMA)
trima --> Triangular Moving Average (TRIMA)
vidya --> Variable Index Dynamic Average (VIDYA)
vwap --> Volume Weighted Average Price (VWAP)
vwma --> Volume Weighted Moving Average (VWMA)
wma --> Weighted Moving Average (WMA)
zlma --> Zero Lag Moving Average (ZLMA)
entropy --> Entropy (ENTP)
kurtosis --> Rolling Kurtosis
skew --> Rolling Skew
xev --> Condition all
zscore --> Rolling Z Score
adx --> Average Directional Movement (ADX)
aroon --> Aroon & Aroon Oscillator (AROON)
chop --> Choppiness Index (CHOP)
xex --> Condition any
cksp --> Chande Kroll Stop (CKSP)
dpo --> Detrend Price Oscillator (DPO)
long_run --> Long Run
psar --> Parabolic Stop and Reverse (psar)
short_run --> Short Run
vhf --> Vertical Horizontal Filter (VHF)
vortex --> Vortex
accbands --> Acceleration Bands (ACCBANDS)
atr --> Average True Range (ATR)
bbands --> Bollinger Bands (BBANDS)
donchian --> Donchian Channels (DC)
kc --> Keltner Channels (KC)
massi --> Mass Index (MASSI)
natr --> Normalized Average True Range (NATR)
pdist --> Price Distance (PDIST)
rvi --> Relative Volatility Index (RVI)
thermo --> Elders Thermometer (THERMO)
ui --> Ulcer Index (UI)
ad --> Accumulation/Distribution (AD)
cmf --> Chaikin Money Flow (CMF)
efi --> Elder's Force Index (EFI)
ecm --> Ease of Movement (EOM)
kvo --> Klinger Volume Oscillator (KVO)
mfi --> Money Flow Index (MFI)
nvi --> Negative Volume Index (NVI)
obv --> On Balance Volume (OBV)
pvi --> Positive Volume Index (PVI)
dvdi --> Dual Volume Divergence Index (DVDI)
xhh --> Dynamic rolling highest values
pvt --> Price-Volume Trend (PVT)
Remarks
I also incorporated func descriptions and func test script in commented mode, you can test the functino with the embedded test script and modify them as you wish.
This is a Level 3 free and open source indicator library.
Feedbacks are appreciated.
This is not the end of pandas_ta lib publication, but it is start point with pine v5 lib function and I will add more and more funcs into this lib for my own indicators.
Function Name List:
bton()
wcp()
count()
xbt()
ebsw()
ao()
apo()
xrf()
bias()
bop()
brar()
cci()
cfo()
cg()
cmo()
coppock()
cti()
dmi()
er()
eri()
fisher()
inertia()
kdj()
kst()
macd()
mom()
pgo()
ppo()
psl()
pvo()
qqe()
roc()
rsi()
rsx()
rvgi()
slope()
smi()
sqz_pro()
xfl()
stc()
stoch()
stochrsi()
trix()
tsi()
uo()
willr()
alma()
wcx()
xll()
dema()
ema()
fwma()
hilo()
hma()
hwma()
ichimoku()
jma()
kama()
linreg()
mgcd()
rma()
sinwma()
ssf()
supertrend()
xsa()
swma()
t3()
tema()
trima()
vidya()
vwap()
vwma()
wma()
zlma()
entropy()
kurtosis()
skew()
xev()
zscore()
adx()
aroon()
chop()
xex()
cksp()
dpo()
long_run()
psar()
short_run()
vhf()
vortex()
accbands()
atr()
bbands()
donchian()
kc()
massi()
natr()
pdist()
rvi()
thermo()
ui()
ad()
cmf()
efi()
ecm()
kvo()
mfi()
nvi()
obv()
pvi()
dvdi()
xhh()
pvt()

Ranging Market Detector [AstrideUnicorn]Determining if the market is in a trend or a range regime is a very complex problem. And knowing the answer can be, in some situations, the real holy grail. If the trader knows when the market is in a range regime, they can avoid overtrading and make moving average crossover strategies more profitable. A regime switch from a trend to a range can be a signal to close open positions. It can also be helpful when trading such instruments as short-term binary options. When the market is ranging directional moves are not expected, and the trader should be careful as opening a position in such conditions is, by some degree, a random outcome game. Range breakouts trading is one more example when knowing the market regime is critical.
We have created an indicator that predicts the current market regime. It smooths the price using the Kalman filter and analyzes the curve's slope. If the absolute value of the slope is low, then the market is in range mode and vice versa. To distinguish between the two regimes, the algorithm compares the absolute value of the slope with its long-term average.
HOW TO USE
The indicator shows the difference between the absolute slope value and its long-term average as a histogram. When a bar of the histogram is higher than the threshold level presented by the red line, the market is in a trending regime. In this regime, the background of the indicator is blue. When the market is in a range regime, the indicator background turns red.
The threshold level helps to control the lag. The greater it is, the more lagging the indicator will be. By default, this value is set to a negative value. It means that the indicator switches from range to trend a little bit earlier than the slope gets higher than the average slope. You can use the value of zero or low negative values to find the optimal tradeoff between the strength of the signals and their lag.
SETTINGS
The indicator has one input parameter called Threshold. It sets the threshold level described above. Its value should be close to zero. The less the value is, the less is the indicator's lag, but at the same time, the less confirmed the regime-switching signals are.
The use cases can be very different. And as the code is open, you can also use the indicator as a building block for your custom trading strategies.
Let us know your thoughts and suggestions!
NEXT Stochastic 3xVW (Triple Volume Weighted)Overview:
This responsive version of the Stochastic oscillator modifies and extends the original to incorporate volume. It does so on 2 levels: by using Volume-Weighted Moving Average (VWMA) as input and applying a triple volume weighting filter within the internal algorithm, intelligently blending volume with what is otherwise pure momentum/distribution analysis. The result is more binary-like curve behavior (%K and %D oscillator lines), whose polarizing movement acts as both a signal and filter.
Below is a screenshot comparing NEXT Stochastic 3xVW with default settings to the original Stochastic oscillator on NQ M1 chart.
Application and Strategy Ideas:
NEXT Stochastic 3xVW is intended to be used like the original Stochastic oscillator within the context of technical analysis: identifying overvalued (above upper limit) and undervalued (below lower limit) price action, as well as establishing a bias baseline (bullish if over 50; bearish if under 50). Higher NEXT Stochastic 3xVW bottoms compared to lower price bottoms signify bullish divergence; lower NEXT Stochastic 3xVW tops compared to higher price tops signify bearish divergence. Trading %K/%D line crossing is also a popular strategy, with %K crossing over %D indicating bullish sentiment and %K crossing under %D indicating bearish sentiment.
Below is a screenshot showing NEXT Stochastic 3xVW overbought/oversold intraday strategy on SPY M1 chart. NEXT Stochastic 3xVW is set to 5,10,1,3 with long signal issued at lower limit of 30 and short at upper limit of 70.
Input Parameters:
VWMA Length - controls the averaging length of the volume-weighted moving average (based on close price and volume); used as Stochastic input
%K Length - volume-driven averaging length of the %K oscillator line - this is the faster of the two Stochastic lines
%K Smoothing - volume-driven smoothing factor of the %K line
%D Smoothing - volume-driven averaging length of the %D oscillator line (a %K derivative, post smoothing) - this is the slower of the two Stochastic lines
Upper Limit - the NEXT Stochastic 3xVW level above which market is considered overbought, default is 80
Base Bias - the NEXT Stochastic 3xVW level above which market bias is considered bullish, and below bearish
Lower Limit - the NEXT Stochastic 3xVW level below which market is considered oversold, default is 20
Signals and Alerts:
Discover and visualize NEXT Stochastic 3xVW strategies using the companion NEXT Strategy Visualizer indicator. While the %K/%D cross alerts can be set via NEXT Stochastic 3xVW indicator, the Strategy Visualizer will only plot long/short signals when %K or %D cross over or under overbought/oversold levels (as hown in the above SPY M1 screenshot). That being said, the next version of the Strategy Visualizer will also support %K/%D crosses.
Here is how to set NEXT Stochastic 3xVW %K/%D crossing alerts: open a chart, attach NEXT Stochastic 3xVW, and right-click on chart -> Add Alert. Condition: Next Stochastic >> %K >> Crossing >> Next Stochastic >> %D

MM DON v2The orginal MM Don was the best algo we created until the V2 Came about
Based on the nnfx trading style this algorithms has many different calculations to provide the best signal and confirmations
1. Up to 3 Baselines that can change between 15 different moving averages and filter out trades for you
2 Strict feature to all baselines and higher time frame signals
3. Strategy presets for easy and best optimal settings for the asset and timeframe
4. Updated support and resistance
5. Updated alerts that send full signals to your phone
6. Updated trading "modes" from Swing to Scalp
7. Added session with strict feature to only show trades during that selected session
8. selectable candle type for easier trend detection
9. Atr risk calculator optimized for Mobile app on trading view
Buy/Sell Alarms for all the moving averages
Breakeven Alarm after tp1 hits
Entry
3 TP
ATR x1.5 Stop Loss auto generated per signal.
Also be able to set tp alarms for both buy/sell entries. so you place your trade and be alerted when your take profits have been hit.
works on all timeframes for scalpers, intraday, or even swing.
effective on binary as well.
Directions are simple
combine simple Market Structure & as long as everything matches (Buy Signal & everything is Grey + baseline is grey) (Sell Signal & everything is Red + Baseline is Red) you can enter the signal generated, exit the trade when told to exit and Manage your trade.
this was made to make trading easy and create confidence with in the trader.
Link below or PM us for access to this indicator Happy Trading

3c.BotPlus-CrossRSIThe original Cross-RSI indicator computes buy/sell momentum based on two binary methods over multiple RSI price maps.
This indicator was initially created for stablecoins scalping but its use is not restricted to stablecoins.
It permits to catch the scalp opportunities when the price is moving quickly inside a range.
Good examples of stablecoins pairs are BUSD-VAI, AMP-USDT, DAI-UST.
The default Smooth Factor is 7. This is should be tuned to the fit the price movement for each pair. Each pair of stablecoins can perform better with a different Smooth Factor.
The Smooth Factor is used to reduce too much frequent signals in ranging periods. Increase the Smooth Factor till 14 to reduce the weaker signals and decrease to catch more signals.

Multi-TimeFrame SignalsI trade binary options on reversals. I use this as a confluence to prove that my analysis is correct. I use this on smaller time frames given the type of trading I do.
I do not use this as an entry trigger, so you should not blindly enter trades based on this solely . You were warned
This indicator (on default settings) will let you know when the 1 minute, 3 minute, and 5 minute timeframes RSI & Stochastics are all in an overbought or oversold state. It shows this by changing the background color on your chart to red (overbought) or green (oversold).
All of these settings are changeable. #winning
I left this as open-source as I figured out how to code this by using other open-source scripts as reference. I am a programmer that uses other languages.
I only published this script as a request from a close friend.

Financial Astrology Indexes ML Daily TrendDaily trend indicator based on financial astrology cycles detected with advanced machine learning techniques for some of the most important market indexes: DJI, UK100, SPX, IBC, IXIC, NI225, BANKNIFTY, NIFTY and GLD fund (not index) for Gold predictions. The daily price trend is forecasted through planets cycles (angular aspects, speed phases, declination zone), fast cycles are based on Moon, Mercury, Venus and Sun and Mid term cycles are based on Mars, Vesta and Ceres . The combination of all this cycles produce a daily price trend prediction that is encoded into a PineScript array using binary format "0 or 1" that represent sell and buy signals respectively. The indicator provides signals since 2021-01-01 to 2022-12-31, the past months signals purpose is to support backtesting of the indicator combined with other technical indicator entries like MAs, RSI or Stochastic . For future predictions besides 2022 a machine learning models re-train phase will be required.
When the signal moving average is increasing from 0 to 1 indicates an increase of buy force, when is decreasing from 1 to 0 indicates an increase in sell force, finally, when is sideways around the 0.4-0.6 area predicts a period of buy/sell forces equilibrium, traders indecision which result in a price congestion within a narrow price range.
We also have published same indicator for Crypto-Currencies research portfolio:
DISCLAIMER: This indicator is experimental and don’t provide financial or investment advice, the main purpose is to demonstrate the predictive power of financial astrology. Any allocation of funds following the documented machine learning model prediction is a high-risk endeavour and it’s the users responsibility to practice healthy risk management according to your situation.

Quantum Cryptocurrency Strength Indicator (CCSI)Exciting new markets require exciting new indicators and with the plethora of cryptocurrencies now available and increasingly being offered through mainstream brokers, at Quantum Trading we thought it was time for us to step in and develop something unique to help traders and investors trading the new kids on the block.
Cryptocurrencies like their more established cousins in forex, are in a constant state of flux moving from overbought to oversold and back again, but at a much faster pace, and generally associated with volatility. The challenge of course is picking those phases of price action where these conditions have been met and so offering the trader two opportunities. Either to take a position ahead of any reversal and so get in early before the trend develops, or alternatively to wait until the trend is underway and then jump in. You can think of this as a train in the station. Do you board early before it leaves, or jump aboard once it is underway? Both approaches have advantages and disadvantages, but the choice is yours.
So, our development team set to work to deliver the perfect indicator to deliver this information for you visually and quickly, and we are proud to announce the Cryptocurrency Strength Indicator or the CCSI for short. And if you thought this looks similar to its hugely popular currency strength indicator for forex then you would be right.
This indicator is of course a little different, though the principles of how to use it can be considered the same. So how does it work? Well, first of all, here we are dealing with a cryptocurrency pair, rather than isolating out the currency itself, as every cryptocurrency is quoted against the USD in some way. In these markets we are seeing the movement of the cryptocurrency against the US dollar and in developing the indicator we have chosen to display this against Tether. In other words, USDT.
The indicator displays seven of the most popular cryptocurrencies against the USDT, but what we have also included in the design is the option to deselect these and select others of your choice, so you have complete control of those cryptocurrencies you wish to trade. In addition, we understand that alerts are a hugely popular function of the TradingView platform, so we have added these in these also. And of course, as you would expect we have included the option to isolate out those of interest. So how do we use the indicator?
First, as you might expect, the cryptocurrency market tends to move ‘en mass’ – in other words generally either moving higher or lower together. You can think of this as an equivalent to the currency matrix in forex, where currencies of one denomination, such as the yen will all move in the same direction if the yen is being bought or sold universally. It is the same here. On occasion, on the faster timeframes, one does see divergence, but as a general rule, they will all tend to move together which is great as it gives you the confidence you are trading in the direction of the entire market. What is important however is the direction of the USDT. This will ALWAYS be in the opposite direction which is why we isolate it out from the others, to reveal precisely how this is moving. Remember, what drives a strong trend is when one currency is rising and another falling in forex and it is exactly the same here. When the USDT is rising strongly and the cryptocurrencies are falling, then a strong trend is underway. Equally, if the USDT is falling strongly then you will see a strong trend in your chosen cryptocurrency.
Next, we look for overbought and oversold opportunities in precisely the same way as for the currency strength indicator. Cryptocurrencies are in a constant state of flux moving from oversold to overbought and back again in all timeframes so there are always plenty of opportunities to employ this tactic and get in early at the start of a new trend. The angle of inclination of the line reveals the strength of the move, but equally, if the cryptocurrencies are moving sideways along with the USDT then we have to wait and be patient. But the beauty of this market is that it genuinely trades twenty-four hours a day, and seven days a week. Trend trading is another great tactic and as soon as the move is underway you can jump on the moving train and join a current trend and with cryptocurrencies, you don’t normally have to wait long as the price action is constant.
However, don’t just think of the Cryptocurrency Strength Indicator as a tool for simply getting you in. It will also help you to stay in and get out at the right time. After all if it’s good enough to get you in then it’s good enough to keep you in also. But remember, when the lines are moving sideways along with the USDT, then it’s a question of being patient and waiting. In other words, it helps to keep you out too.
The indicator works in all timeframes on the TradingView platform from seconds and upwards, so all trading approaches and tactics are catered for with this indicator. It can be used with any instrument whether through a conventional broker or for trading binary options which are extremely popular, and of course cryptocurrency futures too.
