Stochastique Divergences IndicatorHello,
I made a custom indicator.
Divergences with stochastique and price are really strong signals.
About the indicator
A bullish divergence happens when the stoch K makes a higher low and is depicted by a green triangle up.
A bearish divergence happens when the stoch K makes a lower high and is depicted by a red triangle down.
This script is the base for my next strategy that I should upload soon.
I will grant access (to this script and my others) to people willing to make a small donation.
Here is my BTC address : 19sVQvCDmVfEACq7BiMnWSMqFPZ8qfSQ2K
If you prefer ETH : 0xc8a5d3a63a05db0c2363ea1c08b37a01cce9ebfb
Send me a Private Message with the ID of the transaction
If you want to do some forward testing first, send me a message.
Also check blockchainfiesta.com
In den Scripts nach "bear" suchen

wTF50This is a customized trend filter that has several uses:
It helps identify trend direction, either bullish or bearish
It distinguishes between a pullback and a trend reversal
It helps identify areas where traders should stand aside
It highlights areas of consolidation
dTF50This is a customized trend filter that has several uses:
It helps identify trend direction, either bullish or bearish
It distinguishes between a pullback and a trend reversal
It helps identify areas where traders should stand aside
It highlights areas of consolidation
OBV divergence hidden and regular on both bearish and bullish.OBV (on balance volume) divergence indicator with hidden and regular signal on both bearish and bullish.

CMYK VRMI◊ Introduction
This script indicates the relative movement of price x volume.
◊ Origin
Based on 'The Relative Momentum Index' by Roger Altman : February, 1993 issue of Technical Analysis of Stocks & Commodities magazine.
While RSI counts up and down days from close to close, the Relative Momentum Index counts up and down days from the close relative to a close x number of days ago.
This results in an RSI that is smoother. The input has been changed to the change of a smoothed close multiplied by a smoothed volume.
The polarity of VRMI indicates bearish/bullish movement.
◊ Adjustments
CMYK color theme applied.
◊ Usage
VRMI indicates the force the market moves with.
◊ Future Prospects
-
◊ ◊ ◊ ◊ ◊ ◊ ◊ ◊ ◊ ◊ ◊ ◊ ◊ ◊ ◊ ◊ ◊ ◊ ◊ ◊ ◊ ◊ ◊ ◊ ◊ ◊ ◊ ◊ ◊ ◊ ◊ ◊ ◊ ◊ ◊ ◊ ◊ ◊ ◊ ◊ ◊ ◊ ◊ ◊ ◊ ◊ ◊ ◊ ◊ ◊ ◊ ◊ ◊ ◊ ◊ ◊ ◊ ◊ ◊ ◊ ◊ ◊ ◊ ◊ ◊ ◊ ◊ ◊ ◊ ◊ ◊ ◊ ◊ ◊ ◊ ◊ ◊ ◊ ◊ ◊ ◊ ◊ ◊ ◊ ◊ ◊ ◊ ◊ ◊ ◊ ◊ ◊ ◊ ◊ ◊ ◊ ◊ ◊ ◊ ◊ ◊ ◊ ◊ ◊ ◊ ◊

CMYK VRMI RAYS ◊ Introduction
Introducing VRMI in this script, an RMI based on price movement and volume, to indicate bullish and bearish trends.
This script marks the background depending on RMI <> VRMI , VRMI polarity and large buy/sell sprees.
◊ Origin
Based on 'The Relative Momentum Index' by Roger Altman : February, 1993 issue of Technical Analysis of Stocks & Commodities magazine.
While RSI counts up and down days from close to close, the Relative Momentum Index counts up and down days from the close relative to a close x number of days ago.
This results in an RSI that is smoother.
In addition VRMI reacts quick, it is used to cut off latency from RMI, and it's polarity indicates the beginning and end of a trend.
Large buy sell sprees and detected in their proportion with an sma on the volume
◊ Adjustments
CMYK color theme applied.
◊ Usage
This indicator can be used to detect trends and mark reversals.
◊ Prospects
◊ ◊ ◊ ◊ ◊ ◊ ◊ ◊ ◊ ◊ ◊ ◊ ◊ ◊ ◊ ◊ ◊ ◊ ◊ ◊ ◊ ◊ ◊ ◊ ◊ ◊ ◊ ◊ ◊ ◊ ◊ ◊ ◊ ◊ ◊ ◊ ◊ ◊ ◊ ◊ ◊ ◊ ◊ ◊ ◊ ◊ ◊ ◊ ◊ ◊ ◊ ◊ ◊ ◊ ◊ ◊ ◊ ◊ ◊ ◊ ◊ ◊ ◊ ◊ ◊ ◊ ◊ ◊ ◊ ◊ ◊ ◊ ◊ ◊ ◊ ◊ ◊ ◊ ◊ ◊ ◊ ◊ ◊ ◊ ◊ ◊ ◊ ◊ ◊ ◊ ◊ ◊ ◊ ◊ ◊ ◊ ◊ ◊ ◊ ◊ ◊ ◊ ◊ ◊ ◊ ◊


Bullish and Bearish Engulfing Patterns auto detectionThis simple indicator detects automatically most important bullish and bearish candlestick patterns formations. Used to locate potential supply and demand imbalances.
Copyright 2017 Alfonso Moreno www.set-and-forget.com


Super Envolvente (Bullish y Bearish)Identificador de Super-envolventes (SE), se encarga de darle un color verde a la SE alzista (Bullish) verde y rojo a la bajista (Bearish).

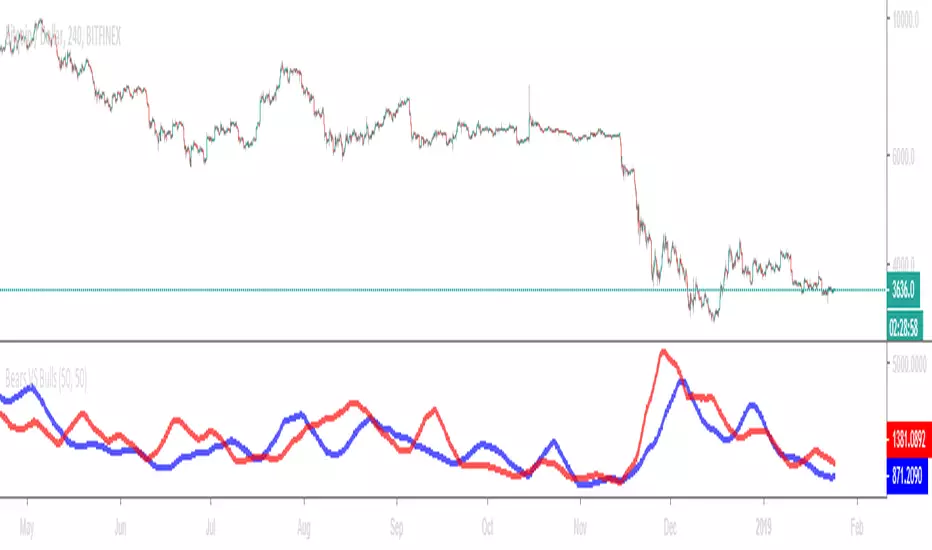
Bears VS BullsThis indicator will work on ANY instrument.
The red line is a moving average of ONLY sellers in the market.
The blue line is a moving average of ONLY buyers in the market.
The period or "length" of the individual moving averages can be adjusted in the indicator settings.
The default, it is set to 50.
Buying and selling trends often provide indications of market moves such as the most recent bottom in Cryptocurrencies.
Feel free to comment and share any indicator concepts or ideas for content you would like to see added to the Technical Indicator Bundle on www.kenzing.com
Bearish Trailing stopIt is a trailing SL. Works very well. Good good very good. Looks like my description needs more, so here is more random text.

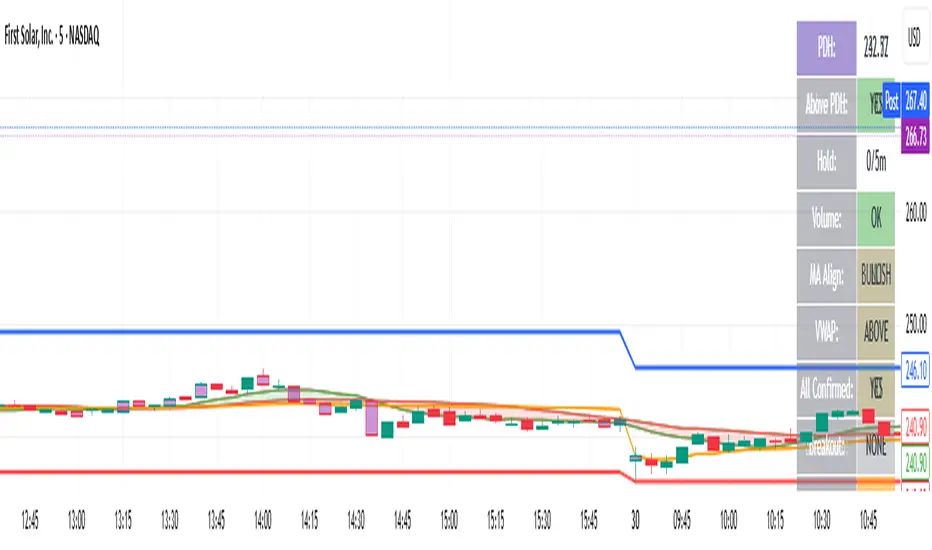
bearish Price Below PDL - Complete Multi-Confirmation Alert🎯 KEY IMPROVEMENTS:
1. Enhanced Alert Visibility:$jmoskyhigh
✅ HUGE triangle down marker with "SELL" text
✅ Alert title: "SELL SIGNAL - PDL BREAKDOWN CONFIRMED"
✅ Prominent info panel with red theme
✅ Clear "SELL ALERT: TRIGGERED" status
2. Better Visual Feedback:
Red frame around info panel
Larger shapes and markers
Color-coded confirmations (green = OK, red = FAIL)
Progress percentage displayed
Breakdown price label
3. Complete Alert System:
Main Alert: "SELL SIGNAL - PDL BREAKDOWN CONFIRMED"
Early Warning: "PDL Breakdown Started - Monitoring"
Reset Alert: "Confirmation Lost - Breakdown Reset"

Bearish signal using Point of Control (POC) with PAC by guruThis indicator code helps traders identify potential sell opportunities using several important technical indicators:
Point of Control (POC) – This is the price level where the most volume was traded over the past several days.
Previous Day's Low – This shows the lowest price reached during the previous day.
PAC (Price Action Channel) EMA – These are two moving averages (one based on the low price and one based on the close price) that help determine if the price is trending within a certain range.
Volume SMA – This is a 3-day simple moving average (SMA) of volume, which helps filter out signals based on market activity.
What the Script Does:
Point of Control (POC):
The script looks at the last 50 days (configurable) and calculates which price level had the highest trading volume.
It then plots a red line on the chart at the POC level. This is important because it helps identify areas where there was strong market interest in the past.
Volume Moving Average:
The script calculates a 3-day SMA of volume, but it excludes the current day to avoid premature signals based on today’s trading.
The volume SMA is used to ensure there’s enough market activity (with a threshold set to 25 units) before triggering a sell signal.
Price Action Channel (PAC) EMA:
The PAC consists of two exponential moving averages (EMAs):
The PAC Low EMA: This is based on the low prices over the last 34 periods (configurable).
The PAC Close EMA: This is based on the closing prices over the last 34 periods.
These EMAs help determine if the price is trending above or below certain price levels.
Sell Signal Logic: The script checks three conditions before displaying a "Sell" signal:
Price Below POC and Previous Day’s Low:
The close price must be below both the Point of Control (POC) and the previous day's low.
Volume SMA Above 25:
The 3-day volume SMA must be greater than 25. This ensures the signal only triggers when there’s enough trading volume in the market.
Today’s Low is Above PAC EMAs:
Today's low price must be above both the PAC low EMA and the PAC close EMA. This prevents sell signals when prices are already significantly below the PAC, indicating possible exhaustion in the downtrend.
If all three conditions are met, the script will display a red "Sell" label on the chart, signaling a potential selling opportunity.
No Sell Signal if Price Reverses:
If the price crosses back above the POC or the previous day's low, the script will remove the sell signal and reset for a new opportunity.
Summary of Conditions:
For the script to display a "Sell" label:
The close price must be below the Point of Control (POC) and the previous day’s low.
The 3-day volume SMA (excluding today) must be greater than 25 units.
The low price of the current day must be above both the PAC low EMA and the PAC close EMA.
If these conditions are met, a red sell label appears on the chart as a potential signal for a short (sell) trade.

Bearish FS Continuation S1BB - baby bar / inside bar
DF - downflow, meaning 20MA below 50MA
EXE - execution bar, indicator to short
Mainly to identify execution bar for shorting using inside bar identification and force top

Guneet-ScalperBearish trend candle color change to red with sell print
Bullish trend candle color change to green with buy print
thanks
jas toor

ProTrend System # ProTrend System - Complete Guide
> **Version:** Pine Script v6
> **Author:** Antigravity
> **Type:** All-in-One Trading Indicator
---
## 📋 Table of Contents
1. (#overview)
2. (#key-features)
3. (#how-to-install)
4. (#understanding-the-dashboard)
5. (#support--resistance-zones)
6. (#smart-trendlines)
7. (#rsi-divergence-detection)
8. (#trap-detection)
9. (#market-state-explained)
10. (#ai-score-system)
11. (#buy--sell-signals)
12. (#settings-guide)
13. (#trading-strategies)
14. (#faq)
---
## Overview
The **ProTrend System** is an all-in-one trading indicator that combines multiple professional trading concepts into a single, easy-to-use tool. It automatically:
- Finds support and resistance zones
- Draws trendlines with touch validation
- Detects divergences (regular and hidden)
- Spots trap patterns before they catch you
- Calculates an AI confidence score
- Generates BUY/SELL signals with stop-loss and take-profit levels
**Perfect for:** Forex, Stocks, Crypto, Futures, Options
---
## Key Features
| Feature | Description |
|---------|-------------|
| 🎯 Auto S/R Zones | Automatically finds price floors and ceilings |
| 📈 Smart Trendlines | Multi-touch validated lines with breakout alerts |
| 🔄 Divergence Engine | Detects regular + hidden divergences with strength rating |
| 🪤 Trap Detector | Finds bear/bull traps including hidden traps |
| 🧠 AI Score | Confidence meter from 0-20 based on multiple factors |
| 📊 Market State | Shows LONG BUILDUP, SHORT COVERING, etc. |
| 🚀 Signal Generator | Clear BUY/SELL signals with SL/TP levels |
| ⚙️ Auto-Tune | Automatically adjusts settings based on timeframe |
---
## How to Install
1. Open TradingView
2. Click "Pine Editor" at the bottom
3. Delete any existing code
4. Paste the ProTrend System code
5. Click "Add to Chart"
6. Customize settings as needed
---
## Understanding the Dashboard
The dashboard appears in the **bottom-right corner** of your chart:
| Row | Label | What It Shows |
|-----|-------|---------------|
| 1 | **ProTrend AI** | Header (title) |
| 2 | **Trend** | BULLISH / BEARISH / RANGING |
| 3 | **MTF** | Higher timeframe confirmation |
| 4 | **Mkt State** | Market state (see section below) |
| 5 | **Active Zones** | Number of S/R zones on chart |
| 6 | **Momentum** | RSI value with HOT/COLD status |
| 7 | **Strength** | EXPLOSIVE 🚀 / STRONG / WEAK |
| 8 | **AI Score** | Confidence score out of 20 |
| 9 | **Auto-Tune** | ON/OFF with current period |
---
## Support & Resistance Zones
### What Are They?
- **Support (Green Boxes)** = Price levels where falling price tends to stop and bounce UP
- **Resistance (Red Boxes)** = Price levels where rising price tends to stop and bounce DOWN
### How They're Created
1. When price makes a pivot high → Resistance zone is drawn
2. When price makes a pivot low → Support zone is drawn
3. More touches = Darker/stronger zone
4. When price breaks through → Zone is automatically deleted
### Trading With Zones
- **BUY** when price bounces off support (green box)
- **SELL** when price rejects from resistance (red box)
- Stronger zones (darker) = More reliable bounces
---
## Smart Trendlines
### How They Work
The indicator connects the last 3-5 price pivots to create trendlines:
- **Support Trendline (Green)** = Connects lower pivot points
- **Resistance Trendline (Red)** = Connects upper pivot points
### Touch Validation
| Touches | Appearance | Reliability |
|---------|------------|-------------|
| 1-2 | Thin line | Low |
| 3+ | **Thick, bright line** | High ✅ |
### Breakout Detection
When price breaks through a trendline:
- 🚀 `TL BREAK UP` = Bullish breakout (price breaks above resistance)
- 💥 `TL BREAK DOWN` = Bearish breakdown (price breaks below support)
### Channel Detection
If both trendlines have similar slopes, the indicator recognizes it as a **channel** and changes lines to dashed style.
---
## RSI Divergence Detection
### What Is Divergence?
Divergence occurs when **price** and **momentum (RSI)** disagree:
| Type | Price Action | RSI Action | Meaning |
|------|--------------|------------|---------|
| **Regular Bullish** | Lower Low ⬇️ | Higher Low ⬆️ | Reversal UP likely |
| **Hidden Bullish** | Higher Low ⬆️ | Lower Low ⬇️ | Trend continuation UP |
| **Regular Bearish** | Higher High ⬆️ | Lower High ⬇️ | Reversal DOWN likely |
| **Hidden Bearish** | Lower High ⬇️ | Higher High ⬆️ | Trend continuation DOWN |
### Divergence Labels
| Label | Meaning |
|-------|---------|
| `D_REG` | Regular divergence |
| `D_HID` | Hidden divergence |
| `D_REG+` | Multi-swing divergence (3+ pivots) |
| `★` | Weak strength (1-3) |
| `★★` | Medium strength (4-6) |
| `★★★` | Strong strength (7-10) |
### Strength Factors
- RSI gap size (+0-3 points)
- Price gap size (+0-2 points)
- RSI in extreme zone <30 or >70 (+3 points)
- Multi-swing pattern (+2 points)
---
## Trap Detection
### What Are Traps?
Traps occur when price **fakes a breakout** to catch traders on the wrong side:
### Trap Types
| Type | What Happens | Visual Label |
|------|--------------|--------------|
| **Bear Trap (Basic)** | Price breaks below support, then reverses UP | `⚠ BEAR TRAP BASIC` |
| **Bear Trap (Liquidity)** | Trap occurs at a strong S/R zone | `⚠ BEAR TRAP LIQ` |
| **Bear Trap (Hidden)** | 2-bar trap with confirmation candle | `🔒 HIDDEN BEAR TRAP` |
| **Bull Trap (Basic)** | Price breaks above resistance, then reverses DOWN | `⚠ BULL TRAP BASIC` |
| **Bull Trap (Liquidity)** | Trap at strong S/R zone | `⚠ BULL TRAP LIQ` |
| **Bull Trap (Hidden)** | 2-bar trap with confirmation | `🔒 HIDDEN BULL TRAP` |
### Trap Strength Rating
| Stars | Conditions Met |
|-------|----------------|
| ★ | Basic trap only |
| ★★ | Trap + volume OR liquidity zone |
| ★★★ | Hidden trap + all confirmations |
### How to Trade Traps
- **Bear Trap** → Consider BUYING (the "breakdown" was fake)
- **Bull Trap** → Consider SELLING (the "breakout" was fake)
---
## Market State Explained
The market state shows you what **big institutional traders** are doing:
### The 4 States
#### 1. LONG BUILDUP 🟢
> *"Smart money is aggressively BUYING"*
| Price | Volume | Meaning |
|-------|--------|---------|
| ⬆️ UP | ⬆️ UP | Strong bullish conviction |
**Action:** Best time to BUY. Follow the institutional money!
---
#### 2. SHORT COVERING 🟠
> *"Sellers are exiting, but no new buyers are entering"*
| Price | Volume | Meaning |
|-------|--------|---------|
| ⬆️ UP | ⬇️ DOWN | Weak rally, might be temporary |
**Action:** Be cautious with longs. The rally may fade.
---
#### 3. SHORT BUILDUP 🔴
> *"Smart money is aggressively SELLING"*
| Price | Volume | Meaning |
|-------|--------|---------|
| ⬇️ DOWN | ⬆️ UP | Strong bearish conviction |
**Action:** Best time to SELL. Follow the institutional money!
---
#### 4. LONG UNWINDING 🟡
> *"Buyers are exiting, but no new sellers are attacking"*
| Price | Volume | Meaning |
|-------|--------|---------|
| ⬇️ DOWN | ⬇️ DOWN | Weak decline, might bounce |
**Action:** Be cautious with shorts. A bounce may come.
---
## AI Score System
The AI Score combines multiple factors into a single confidence rating:
### Score Components
| Factor | Points | Description |
|--------|--------|-------------|
| Trend Strength | +2 | Price trending (not ranging) |
| RSI < 40 | +1 | Oversold momentum |
| RSI < 30 | +1 | Extremely oversold |
| RSI > 60 | +1 | Overbought momentum |
| RSI > 70 | +1 | Extremely overbought |
| Divergence | +1-5 | Based on divergence strength |
| Multi-Swing Div | +2 | Divergence spans 3+ swings |
| Volume Spike | +2 | High volume confirmation |
| Liquidity Sweep | +3 | Stop-hunt pattern detected |
| Strong Trendline | +2 | 3+ touches on trendline |
| TL Breakout | +3 | Trendline breakout confirmed |
### Score Interpretation
| Score | Color | Signal Quality |
|-------|-------|----------------|
| 0-7 | Gray | Weak setup - avoid or use small size |
| 8-14 | Green | Good setup - trade normally |
| 15-20 | Purple | Excellent setup - **"AI GEM"** 💎 |
---
## BUY & SELL Signals
### BUY Signal Conditions
All of these must be true:
1. ✅ Trend is BULLISH (green background)
2. ✅ Price is at support zone OR on support trendline
3. ✅ Current candle shows rejection wick (long lower shadow)
4. ✅ Market is trending (not choppy)
5. ✅ AI Score meets minimum threshold
### SELL Signal Conditions
All of these must be true:
1. ✅ Trend is BEARISH (red background)
2. ✅ Price is at resistance zone OR on resistance trendline
3. ✅ Current candle shows rejection wick (long upper shadow)
4. ✅ Market is trending (not choppy)
5. ✅ AI Score meets minimum threshold
### Signal Labels
| Label | AI Score | Meaning |
|-------|----------|---------|
| `BUY` / `SELL` | Below threshold | Basic signal |
| `STRONG BUY/SELL` | + Recent divergence | Enhanced signal |
| `AI BUY/SELL` | ≥ Threshold | AI-validated signal |
| `AI GEM` | ≥ 7 (on old scale) | Highest quality 💎 |
### SL/TP Lines
Every signal draws:
- **Red dashed line** = Stop Loss level
- **Teal dashed line** = Take Profit level
- **Gray dotted line** = Entry level
---
## Settings Guide
### Main Settings
| Setting | Default | Description |
|---------|---------|-------------|
| Auto-Tune | ON | Automatically adjusts period based on timeframe |
| Manual Period | 20 | Lookback period if Auto-Tune is OFF |
### S/R Zones
| Setting | Default | Description |
|---------|---------|-------------|
| Show S/R Zones | ON | Display support/resistance boxes |
| Required Touches | 3 | Minimum touches to validate zone |
| Zone Width | 0.5% | Width relative to ATR |
| Max Active Zones | 10 | Limit to prevent chart clutter |
### Trendlines
| Setting | Default | Description |
|---------|---------|-------------|
| Show Trendlines | ON | Display auto trendlines |
| Source | Wick | Use wick highs/lows (or Body) |
| Extend Lines | ON | Project lines into future |
### Signals
| Setting | Default | Description |
|---------|---------|-------------|
| Volatility Filter | ON | Only signal in trending markets |
| Min Slope | 0.25 | Minimum trend angle |
| Require Confirmation | ON | Wait for confirmation candle |
| SL Buffer | 0.5x ATR | Stop loss distance |
| Risk:Reward | 2.0 | TP = 2x the risk |
### AI Filter
| Setting | Default | Description |
|---------|---------|-------------|
| Use AI Filter | ON | Filter signals by AI score |
| Min AI Score | 3 | Minimum score to show signal |
| Show Sweeps | ON | Display liquidity sweeps |
---
## Trading Strategies
### Strategy 1: Zone Bounce
1. Wait for price to reach a **strong S/R zone** (dark color)
2. Look for **rejection wick** candle
3. Check AI Score is **8+**
4. Enter on signal confirmation
5. Use provided SL/TP levels
### Strategy 2: Divergence Reversal
1. Look for **★★★ divergence** label
2. Confirm price is at zone or trendline
3. Wait for **AI GEM** signal
4. Enter with tight stop below divergence low
5. Target 2-3x risk
### Strategy 3: Trap Trade
1. Spot a **trap label** (bear or bull)
2. Enter OPPOSITE direction of the "fake" breakout
3. Stop loss just beyond trap low/high
4. Higher strength traps (★★★) = More reliable
### Strategy 4: Trendline Breakout
1. Wait for **thick trendline** (3+ touches)
2. Watch for 🚀 or 💥 breakout label
3. Confirm with **LONG BUILDUP** or **SHORT BUILDUP** state
4. Enter on pullback to broken trendline
5. Target previous swing or 2x ATR
---
## FAQ
### Q: Why am I not seeing any signals?
**A:** The indicator is selective. Signals only appear when ALL conditions align. This is by design to reduce false signals.
### Q: Can I use this on any timeframe?
**A:** Yes! The Auto-Tune feature automatically adjusts settings for each timeframe. Works best on 5m, 15m, 1H, 4H, and Daily.
### Q: What's the best Risk:Reward ratio?
**A:** Default is 2.0 (you risk 1 to gain 2). For trending markets, you can increase to 3.0.
### Q: Should I take every signal?
**A:** No. Focus on signals with:
- AI Score ≥ 10
- Aligned with Market State (LONG BUILDUP for buys)
- Multiple confirmations (zone + divergence + trendline)
### Q: How do I avoid traps?
**A:** The indicator shows you traps AFTER they form. If you're already in the trap, exit immediately. If you see a trap label, consider trading the OPPOSITE direction.
---
## Summary
The ProTrend System combines professional trading concepts into one indicator:
1. **Zones** tell you WHERE to trade
2. **Trendlines** confirm the DIRECTION
3. **Divergence** warns of REVERSALS
4. **Traps** protect you from FAKEOUTS
5. **Market State** shows INSTITUTIONAL activity
6. **AI Score** rates your CONFIDENCE
7. **Signals** tell you WHEN to enter
**Remember:** No indicator is perfect. Always use proper risk management!
---
## 📊 Market State Deep-Dive (For New Traders)
This section provides an in-depth explanation of the Market State feature, which is one of the most powerful yet least understood concepts in trading.
### What Is Market State?
Market State tells you what **big institutional traders** (banks, hedge funds, mutual funds) are doing RIGHT NOW with their positions. While retail traders (like us) can only see price, institutions move enough volume to leave "footprints" we can detect.
Think of it like this:
> *"Price tells you WHAT happened. Market State tells you WHO made it happen and WHY."*
---
### How Is It Calculated?
The indicator analyzes TWO key metrics on each candle:
| Metric | What We Look At | Meaning |
|--------|-----------------|---------|
| **Price Delta** | `Close - Open` | Did the candle close UP or DOWN? |
| **Volume Delta** | `Current Volume - Previous Volume` | Is activity INCREASING or DECREASING? |
By combining these two factors, we can determine the "character" of the market:
```
VOLUME
⬆️ UP ⬇️ DOWN
┌─────────┬─────────┐
⬆️ UP │ LONG │ SHORT │
PRICE │ BUILDUP │COVERING │
├─────────┼─────────┤
⬇️ DOWN │ SHORT │ LONG │
│ BUILDUP │UNWINDING│
└─────────┴─────────┘
```
---
### The 4 Market States Explained In Detail
---
#### 1️⃣ LONG BUILDUP 🟢
**What's Happening:**
> *"Smart money is aggressively BUYING and they're adding NEW positions."*
| Indicator | Value |
|-----------|-------|
| Price | Going UP ⬆️ |
| Volume | Going UP ⬆️ |
| Conviction | HIGH |
| Sustainability | STRONG |
**Real-World Analogy:**
Imagine a stadium concert. Not only are people rushing IN through the gates, but MORE people keep arriving. The crowd (price) grows, and the line (volume) at the entrance grows too.
**What This Means For You:**
- ✅ Strong bullish momentum
- ✅ Institutions are committing capital
- ✅ The move is likely to CONTINUE
- ✅ Best time to enter LONG positions
**Trading Action:**
- Look for BUY signals
- Add to existing long positions
- Higher AI score = more confidence
- Use wider stop losses (trend is strong)
**Visual Pattern on Chart:**
```
┃ ← Large green candle
┃ ┃ ← Increasing size
┃ ┃ ┃
┃ ┃ ┃ Volume bars getting TALLER ▓▓▓▓▓▓▓▓
┃ ┃ ┃ ▓▓▓▓▓▓
▓ ▓ ▓ ▓▓▓▓
```
---
#### 2️⃣ SHORT COVERING 🟠
**What's Happening:**
> *"Price is rising, but NOT because new buyers are entering. Instead, SELLERS are running away (closing their shorts)."*
| Indicator | Value |
|-----------|-------|
| Price | Going UP ⬆️ |
| Volume | Going DOWN ⬇️ |
| Conviction | LOW |
| Sustainability | WEAK |
**Real-World Analogy:**
The stadium is getting quieter, not louder. People aren't rushing IN - they're just the ones already inside moving toward the exits slowly. The apparent "activity" is just people leaving, not new arrivals.
**What This Means For You:**
- ⚠️ The rally is WEAK
- ⚠️ No fresh buying pressure
- ⚠️ Move may REVERSE soon
- ⚠️ This is often a "relief rally" or "dead cat bounce"
**Trading Action:**
- Be CAUTIOUS with new longs
- Take profits on existing longs
- Watch for reversal patterns
- Don't chase the move
**Visual Pattern on Chart:**
```
┃ ← Green candles
┃ ┃ ← But smaller
┃ ┃ ┃
Volume bars getting SHORTER
▓▓▓▓▓▓▓
▓▓▓▓
▓▓
```
**When You See This:**
If you're already in a LONG position → Consider taking partial profits
If you're looking to BUY → Wait for LONG BUILDUP instead
---
#### 3️⃣ SHORT BUILDUP 🔴
**What's Happening:**
> *"Smart money is aggressively SELLING and they're adding NEW short positions."*
| Indicator | Value |
|-----------|-------|
| Price | Going DOWN ⬇️ |
| Volume | Going UP ⬆️ |
| Conviction | HIGH |
| Sustainability | STRONG |
**Real-World Analogy:**
Panic at the stadium! People are rushing OUT through all exits, and MORE people keep trying to leave. The crowd (price) shrinks rapidly while chaos (volume) increases.
**What This Means For You:**
- ✅ Strong bearish momentum
- ✅ Institutions are betting against the asset
- ✅ The decline is likely to CONTINUE
- ✅ Best time to enter SHORT positions or exit LONGS
**Trading Action:**
- Look for SELL signals
- Add to existing short positions
- Exit long positions immediately
- Use wider stop losses on shorts
**Visual Pattern on Chart:**
```
┃
┃ ┃ ← Red candles
┃ ┃ ┃ ← Increasing size (down)
Volume bars getting TALLER
▓▓
▓▓▓▓
▓▓▓▓▓▓
▓▓▓▓▓▓▓▓
```
---
#### 4️⃣ LONG UNWINDING �
**What's Happening:**
> *"Price is dropping, but NOT because new sellers are attacking. Instead, BUYERS are just taking profits (closing their longs)."*
| Indicator | Value |
|-----------|-------|
| Price | Going DOWN ⬇️ |
| Volume | Going DOWN ⬇️ |
| Conviction | LOW |
| Sustainability | WEAK |
**Real-World Analogy:**
The stadium is slowly emptying, but there's no panic. People are calmly walking out, not rushing. The decline is orderly, not aggressive.
**What This Means For You:**
- ⚠️ The drop is WEAK
- ⚠️ No aggressive selling pressure
- ⚠️ Bounce is LIKELY soon
- ⚠️ This is often just profit-taking or consolidation
**Trading Action:**
- Be CAUTIOUS with new shorts
- Don't panic sell longs
- Watch for support levels
- Prepare for potential reversal
**Visual Pattern on Chart:**
```
┃ ┃
┃ ┃ ┃ ← Red candles
┃ ┃ ← But smaller
Volume bars getting SHORTER
▓▓▓▓▓▓▓▓
▓▓▓▓▓▓
▓▓▓▓
```
---
### Market State Trading Matrix
Use this table to quickly decide what to do:
| Current State | Signal Type | Action | Confidence |
|---------------|-------------|--------|------------|
| LONG BUILDUP + BUY | ✅ Take it! | Full position | HIGH 💪 |
| LONG BUILDUP + SELL | ❌ Skip | Against momentum | LOW |
| SHORT COVERING + BUY | ⚠️ Cautious | Small position | MEDIUM |
| SHORT COVERING + SELL | ✅ Consider | Reversal likely | MEDIUM |
| SHORT BUILDUP + SELL | ✅ Take it! | Full position | HIGH 💪 |
| SHORT BUILDUP + BUY | ❌ Skip | Against momentum | LOW |
| LONG UNWINDING + SELL | ⚠️ Cautious | Small position | MEDIUM |
| LONG UNWINDING + BUY | ✅ Consider | Bounce likely | MEDIUM |
---
### Real Trading Examples
#### Example 1: Perfect LONG BUILDUP Trade
```
Scenario: BTC/USDT 1H Chart
1. Market State shows: LONG BUILDUP 🟢
2. Price touches support zone
3. AI Score: 14/20
4. BUY signal appears
Action: Enter long with confidence!
Result: Strong trend continuation ✅
```
#### Example 2: Avoiding a Trap with SHORT COVERING
```
Scenario: AAPL 15m Chart
1. Price suddenly spikes up +2%
2. You think: "I should buy!"
3. But Market State shows: SHORT COVERING 🟠
4. No new buyers, just shorts closing
Action: WAIT - don't chase!
Result: Price reverses in 30 mins ✅
```
---
## 🎓 Advanced Trading Concepts
### Concept 1: Multi-Timeframe (MTF) Confirmation
The dashboard shows **MTF (240)** or **MTF (W)** which represents the higher timeframe trend:
| Your Chart | MTF Checked |
|------------|-------------|
| 1m - 60m | 4-Hour (240) |
| 4H+ | Weekly (W) |
**Best Practice:**
- Only take LONG trades when MTF = BULLISH
- Only take SHORT trades when MTF = BEARISH
- Mixed signals = Stay out or reduce size
---
### Concept 2: Confluence Trading
The most reliable trades have multiple confirmations ("confluence"):
| # of Confirmations | Reliability | Suggested Action |
|--------------------|-------------|------------------|
| 1 | Low | Skip or tiny size |
| 2 | Medium | Normal position |
| 3+ | High | Full position 💪 |
**Example of High Confluence Trade:**
1. ✅ Price at support zone
2. ✅ Bullish divergence (★★★)
3. ✅ LONG BUILDUP state
4. ✅ AI Score 15+
5. ✅ MTF = BULLISH
This is a **5-confluence** trade = Very high probability!
---
### Concept 3: The "Sweep & Reversal" Pattern
One of the most reliable patterns this indicator detects:
**Pattern Steps:**
1. Price sweeps below a pivot low (liquidity grab)
2. Indicator shows "SWEEP" label
3. Price closes back above the level
4. Bear trap is confirmed
5. Market State shows LONG BUILDUP
→ **STRONG BUY SETUP**
The opposite works for sells (sweep above pivot high → bull trap → SHORT BUILDUP).
---
### Concept 4: Using AI Score Dynamically
The AI Score isn't just a filter - use it to size your positions:
| AI Score | Position Size | Risk Level |
|----------|---------------|------------|
| 3-7 | 25% of normal | Low conviction |
| 8-12 | 50% of normal | Medium conviction |
| 13-17 | 100% of normal | High conviction |
| 18-20 | 150% of normal | "AI GEM" - Rare setup 💎 |
**Example:**
- Normal risk per trade: 2%
- AI Score = 18: Risk 3% (1.5x)
- AI Score = 6: Risk 0.5% (0.25x)
---
### Concept 5: Time-Based Filters
The indicator works on all timeframes, but some are more reliable:
| Timeframe | Noise Level | Recommended Use |
|-----------|-------------|-----------------|
| 1m | Very High | Scalping only (experienced) |
| 5m | High | Quick trades, tight stops |
| 15m | Medium | Day trading (best balance) |
| 1H | Low | Swing setups |
| 4H | Very Low | Position trading |
| Daily | Minimal | Investment decisions |
**Pro Tip:** If you're new, start with 15m or 1H charts. The signals are cleaner and less noisy.
---
### Concept 6: Volume Spike Interpretation
The "Vol" diamond labels indicate high-volume rejection candles:
| Volume Spike + Candle Type | Meaning |
|---------------------------|---------|
| Vol + Bullish Rejection | Strong buying interest |
| Vol + Bearish Rejection | Strong selling pressure |
| Vol + No Rejection | Indecision, wait for clarity |
**Key Insight:**
Volume without wick rejection is often just noise. Volume WITH rejection is a statement of intent.
---
### Concept 7: Reading the Trend Strength
The dashboard shows **Strength** as:
| Label | Slope Value | Meaning |
|-------|-------------|---------|
| WEAK | < 0.5 | Trend losing momentum |
| STRONG | 0.5 - 1.0 | Healthy trend |
| EXPLOSIVE 🚀 | > 1.0 | Very strong momentum |
**How to Use:**
- EXPLOSIVE + LONG BUILDUP = Strong continuation trades
- WEAK + Any state = Potential reversal or consolidation
- STRONG = Normal trend-following trades
---
## 📝 Quick Reference Card
### Signals to TAKE:
- ✅ AI Score 10+
- ✅ At zone OR trendline
- ✅ BUILDUP state matches direction
- ✅ MTF confirms
### Signals to SKIP:
- ❌ AI Score < 6
- ❌ COVERING/UNWINDING state
- ❌ No zone or trendline nearby
- ❌ MTF conflicts
### Risk Management Rules:
1. Never risk more than 2% per trade
2. Use the provided SL/TP lines
3. Scale position size by AI Score
4. Cut losses quickly if Market State changes
---
## 🏆 Master Checklist Before Every Trade
Before entering ANY trade, go through this checklist:
```
□ 1. Is there a signal on the chart? (BUY/SELL label)
□ 2. Is AI Score >= 8? (Check dashboard)
□ 3. Is Market State favorable? (BUILDUP = good)
□ 4. Does MTF confirm? (Same direction as trade)
□ 5. Is price at a zone OR trendline?
□ 6. Is trend strength STRONG or EXPLOSIVE?
□ 7. Is there any trap warning? (If yes, trade opposite)
□ 8. Have I set my stop loss? (Use the red line)
□ 9. Is my position size correct? (Based on AI Score)
□ 10. Am I okay losing this money? (Risk management)
```
**If you can check ALL 10 boxes → Take the trade with confidence!**
---
*Happy Trading! �🚀*
*Remember: The best traders are not the ones who are always right, but the ones who manage risk well when they're wrong.*

Funded Indicator### Detailed Step-by-Step Guide for Using the "Funded Indicator" on TradingView
This comprehensive guide explains how to install, configure, interpret, and use the "Funded Indicator" — an advanced Pine Script v5 tool that combines momentum signals from RSI, MACD, and Stochastic across multiple timeframes, with volume spike confirmation, divergence detection, a real-time dashboard, trend background coloring, and customizable alerts. It is designed for technical traders analyzing forex, cryptocurrencies, stocks, or any other market on TradingView.
**Important Disclaimer**: This indicator is provided for educational and analytical purposes only. It does not constitute financial advice, guarantee profits, or predict future price movements. Trading carries the risk of loss of capital. Always perform your own analysis, apply proper risk management (such as stop-loss orders), and comply with TradingView’s terms of service. No warranties are made — performance varies depending on market conditions, asset, timeframe, and user settings. Backtest thoroughly before using real capital.
The guide assumes you have a TradingView account (free or premium) and basic familiarity with the platform.
#### **Step 1: Installation on TradingView**
- **Open TradingView**:
- Log in to tradingview.com via browser or the mobile/desktop app.
- Load a chart of any symbol (e.g., BTCUSD, EURUSD, AAPL) and choose an initial timeframe (5m or 15m recommended for first tests).
- **Access the Pine Editor**:
- Click the “Pine Editor” tab at the bottom of the chart (or press Alt + Shift + P on PC/Mac).
- If hidden, click the “...” button in the bottom toolbar and select “Pine Editor.”
- **Paste the Script Code**:
- Delete any existing code in the editor.
- Copy and paste the complete Pine Script code of the indicator.
- Click “Save” (or Ctrl + S). Give it a name like “Funded Indicator” or “Momentum Fusion Pro.”
- **Add to the Chart**:
- Click the green “Add to Chart” button in the top-right corner of the editor.
- The indicator should now appear: a Fusion Score line, horizontal levels, buy/sell labels, divergence tags, background coloring (if enabled), and a dashboard table in the top-right corner.
- **Verification**:
- Check the console at the bottom of the editor for any compilation errors. If errors appear, review the error message carefully.
- Refresh the page or switch timeframes/symbols if elements do not display.
- If the dashboard is missing, ensure “Show Dashboard” is enabled in the settings (see Step 2).
#### **Step 2: Configuring the Inputs (Customization)**
- **Open Settings**:
- Locate the indicator name in the left panel (e.g., “Funded Indicator”).
- Double-click it or right-click → “Settings.”
- Go to the “Inputs” tab.
- **Detailed Explanation of Each Input Group**:
- **───── Core & Timeframe ─────**
- **Source**: Price data used for calculations (default: close).
Use “close” for standard behavior; “high” for bullish bias or “low” for bearish bias.
- **Higher TF Multiplier (× current)**: Defines the higher timeframe (default: 4).
Example: 5m chart × 4 = 20m analysis. Increase (5–10) for stronger trend filtering in volatile markets; decrease (2–3) for faster response in low-volatility pairs.
- **───── RSI ─────**
- **Length**: RSI period (default: 14).
Shorten (7–10) for sensitive signals; lengthen (21+) for smoother trends.
- **Overbought / Oversold**: Thresholds (default: 70 / 30).
Raise OB to 80 in strong uptrends; lower OS to 20 in strong downtrends.
- **───── MACD ─────**
- **Fast / Slow / Signal**: Standard MACD periods (12/26/9).
Shorten Fast to 8–10 for quicker signals in crypto; lengthen for smoother forex behavior.
- **───── Stochastic ─────**
- **%K Length / %K Smooth / %D Smooth**: Periods (14/3/3).
Reduce smoothing for rawer signals; increase for noise reduction.
- **Overbought / Oversold**: Thresholds (80/20).
Adjust similarly to RSI levels.
- **───── Volume & Weights ─────**
- **Volume MA Length**: Period for volume average (default: 20).
Increase to 50 for stronger confirmation; decrease to 10 for intraday.
- **Volume Spike × MA**: Spike detection threshold (default: 1.6).
Raise to 2.0+ in low-volume assets; lower to 1.2 in high-liquidity markets.
- **RSI / MACD / Stoch Weight**: Fusion score weights (default: 0.40 / 0.35 / 0.25).
Adjust to emphasize preferred oscillator; keep sum close to 1.0.
- **───── Display & Alerts ─────**
- **Trend Background**: Enables green/red background coloring (default: true).
Disable if the chart feels cluttered.
- **Show Dashboard**: Displays the summary table (default: true).
Highly recommended for quick multi-TF overview.
- **Show Divergence Labels**: Shows bullish/bearish divergence tags (default: true).
Disable in very noisy or ranging markets.
- **Save Changes**:
- Click “OK.” Reload the chart if necessary.
#### **Step 3: Interpreting Visual Elements and Signals**
- **Fusion Score Plot**: Thick line colored green above zero, red below.
Above +40 = strong bullish momentum; below -40 = strong bearish momentum.
- **Horizontal Lines**: Zero (gray dashed), +40 (green dotted), -40 (red dotted).
Use as dynamic support/resistance for momentum.
- **Buy/Sell Shapes**: Green “BUY” below candle, red “SELL” above candle.
Appear only on crossovers confirmed by volume spike.
- **Divergence Labels**: “Bull Div ▲” (green) and “Bear Div ▼” (red).
Indicate potential reversals when price and RSI diverge.
- **Trend Background**: Light green = strong bull, light red = strong bear.
Provides instant visual bias.
- **Dashboard Table** (top-right corner): Shows current and higher-TF values for Fusion, RSI, MACD Hist, Stoch, Volume Spike, and Trend.
Green = bullish, red = bearish, yellow = neutral/overbought/oversold.
#### **Step 4: Generating and Using Signals / Basic Strategy**
- **Buy Signal** — “BUY” label + fusion crosses above 0 + volume spike + bullish divergence + green background.
- **Sell Signal** — “SELL” label + fusion crosses below 0 + volume spike + bearish divergence + red background.
- **Strong Trend Confirmation** — Dashboard shows “STRONG BULL” or “STRONG BEAR” → favor trend-following trades.
- **Neutral / Ranging** — No strong color or dashboard signals → avoid new positions or wait for breakout.
- **Example Workflow**:
1. Check higher-TF column in dashboard for alignment.
2. Wait for “BUY” or “SELL” label with volume “YES”.
3. Confirm divergence (if present) and background color.
4. Enter trade with stop-loss below/above recent swing.
5. Exit on opposite signal or when fusion returns to zero.
#### **Step 5: Setting Up Alerts**
- Right-click on the chart → “Add Alert.”
- Select “Funded Indicator” as the condition source.
- Choose one of the built-in alerts:
- “Fusion BUY + Volume”
- “Fusion SELL + Volume”
- Set frequency to “Once Per Bar Close” to reduce noise.
- Customize message (e.g., “Buy signal on {{ticker}} at {{close}}”).
- Enable notifications (email, app push, SMS, webhook for automation).
- Test alerts in a demo environment first.
#### **Step 6: Testing and Optimization**
- **Backtesting** — Use TradingView’s “Bar Replay” tool to manually review historical signals.
- **Forward Testing** — Apply the indicator to a paper trading account for 1–4 weeks.
- **Parameter Optimization** — Adjust one input at a time (e.g., volume threshold, weights) and compare performance across different symbols and timeframes.
- **Market-Specific Tuning** — Crypto may need higher volume thresholds; forex may benefit from tighter RSI levels.
#### **Step 7: Advanced Tips and Important Reminders**
- **Best Timeframes**: 5m–1h for intraday; 4h–daily for swing trading.
- **Complementary Tools**: Use with support/resistance, moving averages, or volume profile for better context.
- **Risk Management**: Never risk more than 1–2% per trade. Always set stop-loss and take-profit levels.
- **Limitations**: No indicator is perfect. False signals occur in ranging or low-volume markets.
- **Updates**: If new features are added (e.g., additional filters), re-save and re-add the script.
This guide helps users maximize the value of the Funded Indicator while maintaining responsible trading practices. Happy analyzing and trading!

SELF FU Wick Sweep + Inside Close//@version=5
indicator("SELF FU Wick Sweep + Inside Close", overlay=true)
// Oldingi va joriy sham holati
prevBull = close > open
prevBear = close < open
currBull = close > open
currBear = close < open
// Wick ikkala tomondan sweep
wickSweep = high > high and low < low
// Yopilish narxi oldingi sham ichida
closeInsidePrev = close < high and close > low
// Bearish SELF FU
bearSELFFU = prevBull and currBear and wickSweep and closeInsidePrev
plotshape(bearSELFFU, title="Bearish SELF FU", location=location.abovebar,
style=shape.labeldown, color=color.red, text="SELF FU", textcolor=color.white)
// Bullish SELF FU
bullSELFFU = prevBear and currBull and wickSweep and closeInsidePrev
plotshape(bullSELFFU, title="Bullish SELF FU", location=location.belowbar,
style=shape.labelup, color=color.green, text="SELF FU", textcolor=color.white)

Gaussian Regression Wave | Lyro RSOverview
Gaussian Regression Wave by Lyro RS is a multi-functional technical analysis indicator designed to visualize trend reversals, volatility bands, and momentum shifts using a Gaussian-filtered linear regression approach. It combines price smoothing, standard deviation zones, and Heikin Ashi visualization into one configurable module. The indicator is especially tailored for short-term reversal trading and includes multiple display modes and dynamic regime detection.
Introduction
The Gaussian Regression Wave introduces a comprehensive framework for interpreting price dynamics through a blend of statistical smoothing, volatility filtering, and trend detection. Without revealing internal logic, the core methodology is centered on Gaussian-based smoothing of a momentum-derived linear regression, further layered with volatility envelopes and optional Heikin Ashi representation.
Purpose
This tool was designed to help traders identify potential market reversals with greater clarity on lower timeframes. It integrates a multi-dimensional view of trend momentum, volatility, and overbought/oversold zones. Intended primarily for reversal trading, it is best utilized on lower timeframe charts such as 1-minute, 5-minute, or 15-minute periods. The indicator provides flexible modes that allow traders to assess trend conditions, strength of price moves, and reversal zones in real time. Additionally, the regime detector allows users to adapt visually to trending versus mean-reverting environments.
Originality and Uniqueness
Unlike traditional regression or moving average indicators, this script introduces a Gaussian filter applied to a momentum-adjusted regression wave, which results in more adaptive and noise-filtered signals. It integrates a wide variety of moving average smoothing methods, which are customizable, alongside a configurable volatility engine using both ATR and standard deviation logic. The ability to toggle between classic and Heikin Ashi modes adds visual clarity, while the inclusion of a background-colored regime detector and a table-based summary panel provides an at-a-glance understanding of market state. The indicator's modularity, visual flexibility, and incorporation of both statistical and price-action elements make it distinct from conventional trend-following or reversal tools.
Inputs
Source: Defines the price input for calculations, such as close, open, high, or low.
LR Length: Defines a period for one of the calculations.
Select MA Type: Allows the user to choose from several smoothing methods (e.g., EMA, HMA,
TEMA). Each affects how responsive or smoothed the final regression output is.
Smoothing Length: Determines the smoothing applied post-regression. A higher value increases lag but improves noise reduction.
Gaussian Length: Number of bars over which the Gaussian weights are calculated. A longer length increases smoothness.
Gaussian Sigma: Adjusts the width of the Gaussian distribution curve. Higher sigma results in a flatter curve and broader smoothing effect.
ATR Length: Defines the lookback period for calculating the Average True Range, used to estimate volatility.
ATR Factor: A multiplier applied to the ATR to scale the dynamic range of the indicator.
Standard Deviation Length: Period used for computing standard deviation boundaries, affecting band sensitivity.
Reverse Calculations: When enabled, flips regime coloration, which may be more suitable for interpreting lower timeframe behavior.
Market Regime Detector: Toggles whether regime analysis is active and allows selection between short-term or long-term views.
Regime Trend Color / Regime Mean Reversion Color: Custom user-defined colors for regime states.
Background Color Transparency: Adjusts the opacity of regime background coloration for visual emphasis or subtlety.
Use 0 as Middle Line: Replaces the midline with a static zero level, offering a normalized view of mean reversion zones.
Standard Deviation Length: Sets the calculation length for standard deviation used in SD band plotting.
Standard Deviation Multiplier: Determines how wide the bands are around the midline based on standard deviation multiples.
Enable Take Profit: Enables markers for potential profit-taking conditions based on standard deviation thresholds.
Display Variation: Chooses between standard candle plots or Heikin Ashi-style rendering for a smoother appearance.
Select Mode: Toggles between visual modes — Trend, Strength, or Reversals — depending on user focus.
Custom Color Palette: Offers four pre-configured color themes for bullish and bearish conditions.
Use Custom Palette: Allows manual selection of custom up and down colors.
Custom Up / Down: Sets personalized signal colors for bullish and bearish conditions.
Force Table Overlay: Ensures the state table overlays on the chart, even in constrained layouts.
LR MOM Modes Table: Sets the screen location for the summary table.
Table Size: Adjusts the size of the state display for better chart readability.
Features
Gaussian Smoothing: A hand-coded Gaussian filter smooths input data across a user-defined length and sigma range. This helps reduce short-term noise while maintaining essential trend structure.
Dynamic Regression Wave: Momentum values derived from price are passed through a linear regression, followed by optional smoothing using any of sixteen different MA types. This produces a centerline that visually oscillates with price momentum.
Dual Plot Modes: Users can switch between classic candle visualization and a Heikin Ashi-based mode. The HA mode provides smoother visuals, particularly helpful for observing transitions and reversals.
Volatility Bands: The indicator plots two layers of standard deviation bands (1 and 2 standard deviations). These bands dynamically contract or expand with volatility and can act as reversal or breakout zones.
Midline Options: The script gives the choice between using a dynamically calculated SMA midline or a fixed level at zero, depending on whether users want a normalized reference.
Market Regime Detector: Through background shading, the indicator helps users distinguish trending vs. mean-reverting environments. Users can choose between long-term or short-term perspectives. An optional reversal switch inverts the coloring logic, adapting better to fast or slow markets.
Visual Display Modes:
Trend Mode: Colors candles based on their relationship to the regression midline.
Strength Mode: Applies gradient coloring to price candles, indicating relative momentum intensity.
Reversals Mode: Highlights candles that breach outer deviation zones, helping identify potential exhaustion points.
Take-Profit Signal Markers: Displays small x-crosses above or below candles at designated deviation thresholds to suggest likely profit-taking opportunities in both long and short positions.
Color Customization: Supports full palette customization, either through predefined themes or user-defined color values, allowing better integration with user chart styles.
Summary Table: A compact on-chart table dynamically reports the state of trend, strength, reversal, and regime analysis using clear symbols and color-coded status.
Alert Conditions: Includes a comprehensive set of alerts for each mode and visualization type, allowing real-time notification of trend shifts, momentum changes, reversal signals, and regime transitions.
Conclusion
Gaussian Regression Wave combines several statistical and visual techniques to help traders interpret market conditions with a focus on reversals. Designed for lower timeframes, it provides flexible tools to analyze price behavior across multiple lenses: trend, strength, volatility, and regime. With extensive configuration options and visual modes, the indicator caters to both discretionary and systematic traders who seek real-time confirmation of price exhaustion or momentum shift. The inclusion of Gaussian smoothing, multiple moving average types, and an integrated regime detector makes it a highly adaptable tool within a structured trading system.
⚠️ Disclaimer
This indicator is a technical analysis tool and does not guarantee results. It should be used in conjunction with additional analysis methods and proper risk management strategies. The creators of this indicator are not responsible for any financial decisions made based on its signals.

SolQuant TASolQuant TA - Technical Analysis Overlay
The SolQuant TA is an integrated technical analysis overlay designed to identify institutional liquidity zones and trend exhaustion through the confluence of four mathematically distinct systems: Multi-Timeframe Order Blocks , Adaptive Linear Regression , Multi-Timeframe Moving Averages , and Standard Deviation-weighted VWAP .
Unlike standard "mashup" indicators, this script synchronizes these tools to solve a specific problem: identifying high-probability reversal zones that align with macro-trend volatility.
________________________________________________________________________________
1. Adaptive Trend Channel (Pearson's R Logic)
The core of the trend detection system uses Linear Regression with a logarithmic price transformation . Log transformation is utilized to provide a more accurate fit for assets that exhibit exponential growth or volatility, such as Cryptocurrencies.
Self-Optimization: The script iterates through 19 different lookback periods (ranging from 100 to 1000 bars in Long-Term mode).
Optimal Fit: It calculates the Pearson’s R correlation coefficient for every period to automatically select the period with the highest correlation, ensuring the channel reflects the most mathematically sound trend.
Confidence HUD: A real-time table displays a "Confidence Level" based on the Pearson’s R value, ranging from "Extremely Weak" to "Ultra Strong".
2. MTF Order Block System
This system detects areas of institutional interest by identifying Volume Pivots .
Detection: An Order Block (OB) is defined when a ta.pivothigh in volume occurs simultaneously with a specific market structure state.
Refinement: Bullish OBs are calculated using the hl2 and low of the signal bar, while Bearish OBs use the high and hl2 .
Mitigation: To reduce chart noise, zones are automatically removed from the array once price "mitigates" them (crosses the zone boundary).
MTF Integration: The script uses request.security with lookahead = barmerge.lookahead_off to pull OB data from the 1H, 4H, and Daily timeframes.
3. Triple-Anchor VWAP & Volatility Bands
Standard VWAP often suffers from visual "jumps" at period resets. This script utilizes a dynamic color-switching logic that sets transparency to 100% at period boundaries to maintain a clean visual flow.
Anchoring: Simultaneously tracks Session, Weekly, and Monthly VWAP benchmarks.
Volatility Filters: Uses standard deviation multipliers (Default: 1.0, 1.618, and 2.618) to create dynamic overbought/overs
