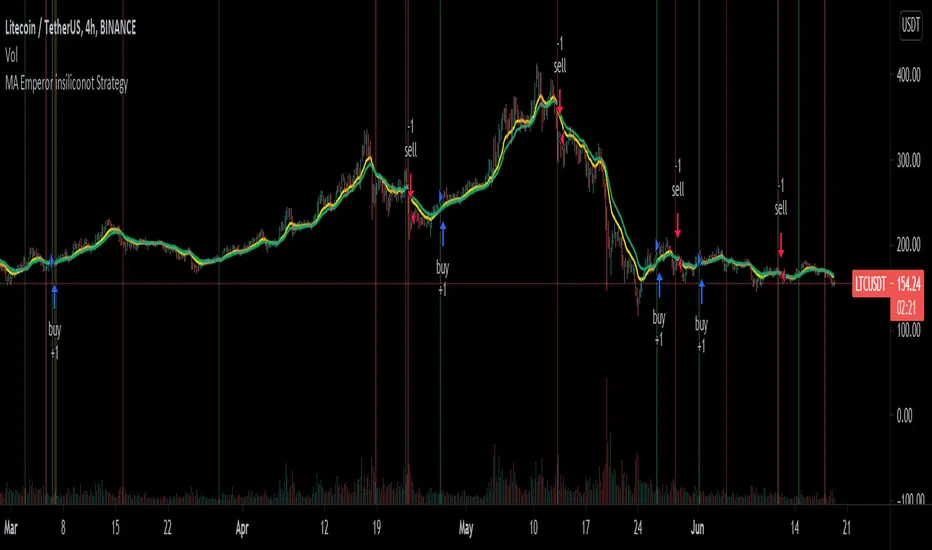
MA Emperor insiliconot StrategyConverted EmperorBTC's EMA crossover indicator for easy backtesting and added ability to:
Specify time period for backtesting
Specify order quantity
Toggle original indicators (default off)
Quoting EmperorBTC:
Entry is to be made when the
1. Cross over gives a P(Positive Sign) and the candle completely closes above the cross-over
2. When the Heikin Ashi turns green and the next green HA candle goes above the previous green HA candle.
3. The price should be at-least above the 0.236 Level from the Swing high.
Kindly note that the strategy only attempts to do check number 1, where it ensures the entry opens above the cross-over.
In den Scripts nach "backtest" suchen
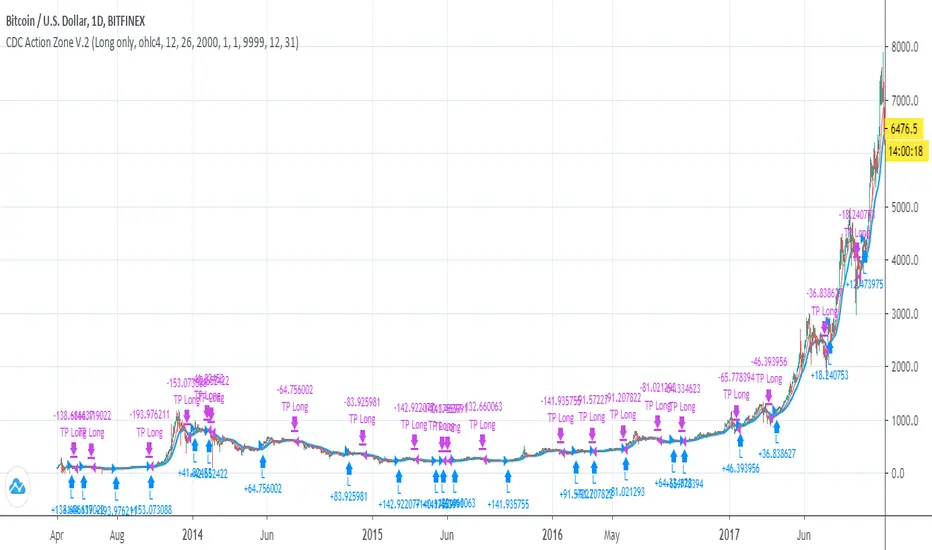
CDC Action Zone V.2 Strategy BacktestPublished for backtest purpose
All credit to : CDC Action Zone V.2 by piriya33
จัดทำขึ้นเพื่อการดูผล Backtest เขียวซื้อแดงขาย
ตัวสคริปท์มีการเพิ่ม
- Strategy Long/Short/Both // ปรับได้ใน Setting
- Back test range // ปรับได้ใน Setting
TS - Long Term Trading Algorithm - StrategyStrategy to the bespoke TS - Trading Algorithm. Highly profitable cryptocurrency trading model.
This script is long only profitable strategy- there is a script coming in the next few days for shorter timeframe long & short trading.
- Backtesting is from 2017.
- 0.05% commission
- 100% capital allocation per trade.
Access to both the backtesting strategy & indicator is paid - PM me for details.

Volatility Breakout [Backtest]If it breaks the volatility(green line) of the day, it is a strategy to buy and settle the market price(yellow line) the next day.
You can backtest volatility breakout strategy below the daily chart.
You can change the backtest period and the volatility coefficient K.
당일 변동성(녹색선)을 돌파하면 매수하고, 다음날 시가(노란선)에 청산하는 전략입니다.
변동성 돌파 전략을 일간 차트이하에서 백테스트할 수 있습니다.
백테스트 기간과 변동성 계수 K를 바꿀 수 있습니다.

TB!G-Scalp Strategy [Backtest]Scalping Crypto Assets Made Easy
TB!G-Scalp is a TradingView based alert and accompanying strategy PineV3 Script.
Backtest vs Realtime
When designing the algorithms for this strategy our focus was primarily on ease of use.This results in a beautiful yet easy to use scalping strategy. As input it takes a chart period and only one extra parameter for fine tuning. The backtest results are an accurate representation of it’s real-time behaviour.
What makes it tick?
Over the last 2 years we collected a lot of market data regarding Bull and Bear behaviours. This previous market behaviour echo’s into the current market trend.
By recognising these echo’s we are able to anticipate an upcoming micro reversal which eventually end up being a scalping strategy.
Interested
Access is provided to a limited amount of people and for the duration that is determined by it’s Alpha Decay Rate.
This ADR is expected to become problematic after 2.3 year of usage on a lot of 150 users.

Anchor SafeSwing Gold StrategyOverview:
The Anchor SafeSwing Gold Strategy is designed for users who prefer structured, rule-based swing trading on XAUUSD. It focuses on identifying high-quality trade setups rather than frequent entries.
This strategy analyzes the market using multiple technical indicators and methods—including trend analysis, multi-chart confirmation, and support/resistance evaluation—to identify potential swing points. It also incorporates a dynamic approach to risk management through adaptive stop-loss and take-profit logic.
How the Strategy Works
1. Multi-Chart & Trend Analysis:
The strategy evaluates trend direction using several indicators and multiple charts. This helps determine whether the trend favors long or short setups.
2. Buy/Sell Conditions:
a. Buy Conditions: When the broader trend is identified as bullish, the strategy waits for the formation of a strong support zone before considering a long position.
b. Sell Conditions: When the trend is bearish, it waits for a confirmed resistance zone before initiating short positions.
3. Dynamic Take-Profit Logic
The strategy uses adaptive take-profit behavior based on evolving market conditions. It monitors new support/resistance structures and various overbought/oversold signals to dynamically exit trades.
4. Dynamic and Configurable Stop-Loss:
A flexible stop-loss system adjusts according to volatility and market structure.
Users can modify the stop-loss threshold in the settings based on their own risk tolerance and account size.
Trading Frequency :
This strategy focuses on select, high-quality setups. As a result, trade frequency is relatively low and may vary depending on market conditions. Backtesting may show roughly several trades per month, but actual live performance can differ.
Important Notes
All trading involves risk, and users should evaluate the strategy and adjust settings according to their own risk management preferences.

DCA with the Money Supply Index DCA with the Money Supply Index (MSI) by zdmre
This strategy is based on the Money Supply Index (MSI) by zdmre and enhances it with two functional options for users: a DCA (Dollar-Cost Averaging) approach and a signal-based buy/sell mode. It’s designed to help traders and investors make data-driven, disciplined entry decisions based on monetary supply trends.
🧠 Concept Overview
The Money Supply Index (MSI) provides insight into how liquidity (money supply) influences market movements. This strategy builds upon that foundation by allowing users to either:
Accumulate positions over time using DCA, based on favorable MSI conditions.
Execute a single buy and sell trade, optimized for bull market conditions.
⚙️ Inputs Explained
General Parameters
Start Bar Index / Stop Bar Index
Defines the range of bars (historical data) for backtesting or strategy visualization.
Long DCA
Activates the DCA mode. If unchecked, the strategy operates in single-entry/single-exit signal mode.
Trading Signal
Enables signal-based entries and exits when the MSI reaches predefined thresholds.
DCA Parameters
Entry Value
The MSI value that triggers a DCA buy event. When the MSI crosses below this value, the strategy considers it a favorable moment to deploy the saved capital.
Saved Amount
The amount of money set aside regularly (e.g., monthly) for investment. This simulates the DCA effect by accumulating capital and deploying it when conditions are optimal.
Data Inputs
Money Supply
The data source for the Money Supply Index (default: ECONOMICS:USM2).
Relational Symbol
The market instrument to compare against the money supply (default: NASDAQ_DLY:NDX). This allows the strategy to measure liquidity impact on a specific market.
Chart Display Options
You can toggle these metrics on the chart for better visualization:
Entry Price (green) – The price level of executed buys.
Cash Balance (yellow) – Remaining uninvested capital.
Invested Capital (red) – Total amount currently invested.
Current Value (blue) – The current valuation of the investment.
Profit (purple) – The total realized and unrealized profit.
Trades on Chart / Signal Labels / Quantity – Enables trade markers, signal text, and position size visualization.
📈 How the Strategy Works
1️⃣ DCA Mode
In DCA mode, the strategy simulates periodic savings and only invests when the MSI indicates favorable liquidity conditions (based on the Entry Value).
This approach aims to achieve the best possible average entry price over time — a powerful strategy for long-term investors seeking stable accumulation with reduced emotional bias.
2️⃣ Signal-Based Mode
In signal mode (with DCA disabled), the strategy performs one buy and one sell trade based on MSI turning points.
It’s most effective during bull markets, where liquidity expansion supports upward momentum.
This mode helps identify high-probability entry and exit zones rather than averaging in continuously.
💡 Additional Notes
This strategy includes helpful metrics to monitor your personal investment performance — showing invested capital, cash reserves, and profit in real-time.
The goal is to combine macroeconomic insight (money supply) with disciplined execution and capital management.
⚠️ Disclaimer
This strategy is for educational and research purposes only. It does not constitute financial advice. Always conduct your own analysis before making investment decisions.

Strategy Chameleon [theUltimator5]Have you ever looked at an indicator and wondered to yourself "Is this indicator actually profitable?" Well now you can test it out for yourself with the Strategy Chameleon!
Strategy Chameleon is a versatile, signal-agnostic trading strategy designed to adapt to any external indicator or trading system. Like a chameleon changes colors to match its environment, this strategy adapts to match any buy/sell signals you provide, making it the ultimate backtesting and automation tool for traders who want to test multiple strategies without rewriting code.
🎯 Key Features
1) Connects ANY external indicator's buy/sell signals
Works with RSI, MACD, moving averages, custom indicators, or any Pine Script output
Simply connect your indicator's signal output to the strategy inputs
2) Multiple Stop Loss Types:
Percentage-based stops
ATR (Average True Range) dynamic stops
Fixed point stops
3) Advanced Trailing Stop System:
Percentage trailing
ATR-based trailing
Fixed point trailing
4) Flexible Take Profit Options:
Risk:Reward ratio targeting
Percentage-based profits
ATR-based profits
Fixed point profits
5) Trading Direction Control
Long Only - Bull market strategies
Short Only - Bear market strategies
Both - Full market strategies
6) Time-Based Filtering
Optional trading session restrictions
Customize active trading hours
Perfect for day trading strategies
📈 How It Works
Signal Detection: The strategy monitors your connected buy/sell signals
Entry Logic: Executes trades when signals trigger during valid time periods
Risk Management: Automatically applies your chosen stop loss and take profit levels
Trailing System: Dynamically adjusts stops to lock in profits
Performance Tracking: Real-time statistics table showing win rate and performance
⚙️ Setup Instructions
0) Add indicator you want to test, then add the Strategy to your chart
Connect Your Signals:
imgur.com
Go to strategy settings → Signal Sources
1) Set "Buy Signal Source" to your indicator's buy output
2) Set "Sell Signal Source" to your indicator's sell output
3) Choose table position - This simply changes the table location on the screen
4) Set trading direction preference - Buy only? Sell only? Both directions?
imgur.com
5) Set your preferred stop loss type and level
You can set the stop loss to be either percentage based or ATR and fully configurable.
6) Enable trailing stops if desired
imgur.com
7) Configure take profit settings
8) Toggle time filter to only consider specific time windows or trading sessions.
🚀 Use Cases
Test various indicators to determine feasibility and/or profitability.
Compare different signal sources quickly
Validate trading ideas with consistent risk management
Portfolio Management
Apply uniform risk management across different strategies
Standardize stop loss and take profit rules
Monitor performance consistently
Automation Ready
Built-in alert conditions for automated trading
Compatible with trading bots and webhooks
Easy integration with external systems
⚠️ Important Notes
This strategy requires external signals to function
Default settings use 10% of equity per trade
Pyramiding is disabled (one position at a time)
Strategy calculates on bar close, not every tick
🔗 Integration Examples
Works perfectly with:
RSI strategies (connect RSI > 70 for sells, RSI < 30 for buys)
Moving average crossovers
MACD signal line crosses
Bollinger Band strategies
Custom oscillators and indicators
Multi-timeframe strategies
📋 Default Settings
Position Size: 10% of equity
Stop Loss: 2% percentage-based
Trailing Stop: 1.5% percentage-based (enabled)
Take Profit: Disabled (optional)
Trade Direction: Both long and short
Time Filter: Disabled

Alligator + MA Trend Catcher [TradeDots]The "Alligator + MA Trend Catcher" is a trading strategy that integrates the William Alligator indicator with a Moving Average (MA) to establish robust entry and exit conditions, optimized for capturing trends.
HOW IT WORKS
This strategy combines the traditional William Alligator set up with an additional Moving Average indicator for enhanced trend confirmation, creating a user-friendly backtesting tool for traders who prefer the Alligator method.
The original Alligator strategy can frequently present fluctuations, even in well-established trends, leading to potentially premature exits. To mitigate this, we incorporate a Moving Average as a secondary confirmation measure to ensure the market trend has indeed shifted.
Here’s the operational flow for long orders:
Entry Signal: When the price rises above the Moving Average, it confirms a bullish market state. Enter if Alligator spread in an upward direction. The trade remains active even if the Alligator indicator suggests a trend reversal.
Exit Signal: The position is closed when the price falls below the Moving Average, and the Alligator spreads in the downward direction. This setup helps traders to maintain positions through the entirety of the trend for maximum gain.
APPLICATION
This strategy is tailored for assets with significant, well-defined trends, such as Bitcoin and Ethereum, which are known for their high volatility and substantial price movements.
This strategy offers a low win-rate but high reward configuration, making asset selection critical for long-term profitability. If you choose assets that lack strong price momentum, there's a high chance that this strategy may not be effective.
For traders seeking to maximize gains from large trends without exiting prematurely, this strategy provides an aggressive yet controlled approach to riding out substantial market waves.
DEFAULT SETUP
Commission: 0.01%
Initial Capital: $10,000
Equity per Trade: 80%
RISK DISCLAIMER
Trading entails substantial risk, and most day traders incur losses. All content, tools, scripts, articles, and education provided by TradeDots serve purely informational and educational purposes. Past performances are not definitive predictors of future results.

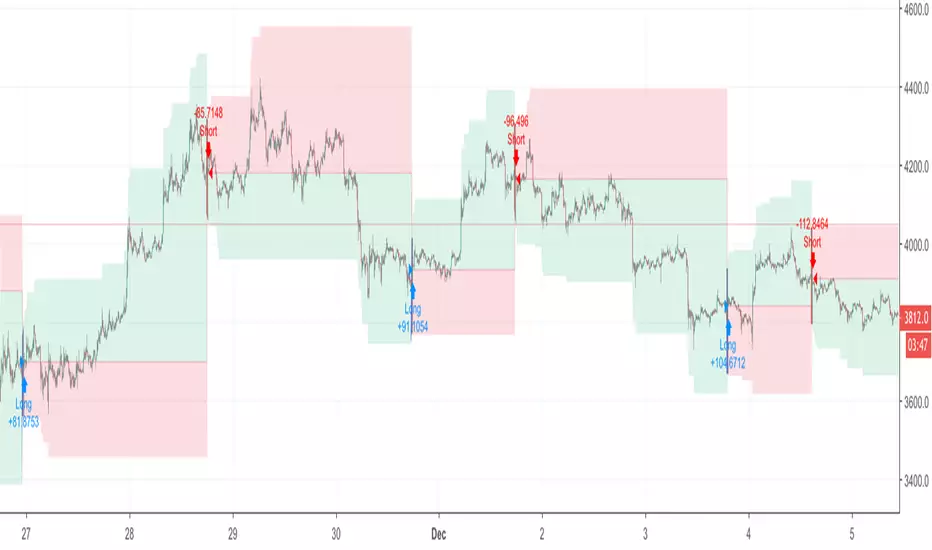
HK Percentile Interpolation One
This script is designed to execute a trading strategy based on Heikin Ashi candlesticks, moving averages, and percentile levels.
Please note that you should keep your original chart in normal candlestick mode and not switch it to Heikin Ashi mode. The script itself calculates Heikin Ashi values from regular candlesticks. If your chart is already in Heikin Ashi mode, the script would be calculating Heikin Ashi values based on Heikin Ashi values, which would produce incorrect results.
The strategy begins trading from a start date that you can specify by modifying the `startDate` parameter. The format of the date is "YYYY MM DD". So, for example, to start the strategy from January 1, 2022, you would set `startDate = timestamp("2022 01 01")`.
The script uses Heikin Ashi candlesticks, which are plotted in the chart. This approach can be useful for spotting trends and reversals more easily than with regular candlestick charts. This is particularly useful when backtesting in TradingView's "Rewind" mode, as you can see how the Heikin Ashi candles behaved at each step of the strategy.
Buy and sell signals are generated based on two factors:
1. The crossing over or under of the Heikin Ashi close price and the 75th percentile price level.
2. The Heikin Ashi close price being above certain moving averages.
You have the flexibility to adjust several parameters in the script, including:
1. The stop loss and trailing stop percentages (`stopLossPercentage` and `trailStopPercentage`). These parameters allow the strategy to exit trades if the price moves against you by a certain percentage.
2. The lookback period (`lookback`) used to calculate percentile levels. This determines the range of past bars used in the percentile calculation.
3. The lengths of the two moving averages (`yellowLine_length` and `purplLine_length`). These determine how sensitive the moving averages are to recent price changes.
4. The minimum holding period (`holdPeriod`). This sets the minimum number of bars that a trade must be kept open before it can be closed.
Please adjust these parameters according to your trading preferences and risk tolerance. Happy trading!

TTP OSC SuperTrendThis strategy instead of following the trend of the price it follows the trend of an oscillator.
You can follow the trend of RSI or CCI.
We use SuperTrend applied to either oscillator for entering a long.
Position can close from
- using a stop loss percentage parameter
- or when entering downtrend
- or when using TP% when the target is achieved
Ideas:
- Use the SuperTrend multiplier to match the oscillator behaviour, CCI moves less, so I use 1.5 multiplier. With RSI I use 3
- I find this strategy works great to do swing trades during bull markets. When backtesting BTCUSDT it outperforms buy and hold before the beginning of the bear market.
- Try RSI 7 instead of RSI 14 for faster response
Alerts
It supports separated payloads for each alert type:
1- Deal open
2- TP% reached
3- SL%
4- Downtrend deal close

iMoku (Ichimoku Complete Tool) - The Quant Science iMoku™ is a professional all-in-one solution for the famous Ichimoku Kinko Hyo indicator.
The algorithm includes:
1. Backtesting spot
2. Visual tool
3. Auto-trading functions
With iMoku you can test four different strategies.
Strategy 1: Cross Tenkan Sen - Kijun Sen
A long position is opened with 100% of the invested capital ($1000) when "Tenkan Sen" crossover "Kijun Sen".
Closing the long position on the opposite condition.
There are 3 different strength signals for this strategy: weak, normal, strong.
Weak : the signal is weak when the condition is true and the price is above the 'Kumo'
Normal : the signal is normal when the condition is true and the price is within the 'Kumo'
Strong : the signal is strong when the condition is true and the price is below the 'Kumo'
Strategy 2: Cross Price - Kijun Sen
A long position is opened with 100% of the invested capital ($1000) when the price crossover the 'Kijun Sen'.
Closing the long position on the opposite condition.
There are 3 different strength signals for this strategy: weak, normal, strong.
Weak : the signal is weak when the condition is true and the price is above the 'Kumo'
Normal : the signal is normal when the condition is true and the price is inside the 'Kumo'
Strong : the signal is strong when the condition is true and the price is below the 'Kumo'
Strategy 3: Kumo Breakout
A long position is opened with 100% of the invested capital ($1000) when the price breakup the 'Kumo'.
Closing the long position with a percentage stop loss and take profit on the invested capital.
Strategy 4: Kumo Twist
A long position is opened with 100% of the invested capital ($1000) when the 'Kumo' goes from negative to positive (called "Twist").
Closing the long position on the opposite condition.
There are 2 different strength signals for this strategy: weak, and strong.
Weak : the signal is weak when the condition is true and the price is above the 'Kumo'
Strong : the signal is strong when the condition is true and the price is below the 'Kumo'
This script is compliant with algorithmic trading.
You can use this script with trading terminals such as 3Commas or CryptoHopper. Connecting this script is very easy.
1. Enter the user interface
2. Select and activate a strategy
3. Copy your bot's links into the dedicated fields
4. Create and activate alert
Disclaimer: algorithmic trading involves risk, the user should consider aspects such as slippage, liquidity and costs when evaluating an asset. The Quant Science is not responsible for any kind of damage resulting from use of this script. By using this script you take all the responsibilities and risks.

EMR Strategy [H1 Backtesting]EMR Strategy base on EMA, MACD and RSI to supply signal on time frame H1.
Details of Rule as below:
===
1.EMA
+ Time frame: H1
+ Periods: 25, 100 (~ EMA 25 H4), 600 (~ EMA 25 D1)
===
2.MACD
+ Time frame: H1
+ Periods: 12,26,9
===
3.RSI
+ Time frame: H1
+ Periods: 14
===
4.Trading Rule
4.1.Long Position
+ MACD>0 and RSI>50 and close price moving above EMA 25
+ Close price crossed EMA 100 or crossed EMA 600 at the first time
4.2.Short Position
+ MACD<0 and RSI<50 and close price moving below EMA 25
+ Close price crossed EMA 100 or crossed EMA 600 at the first time
===
5.Money Management
+ This strategy concentrate into winrate.
+ So use trailing stop to protect your profits.
+ And use stoploss to avoid big loss on trades.

AltBetaHello Tradingivew!
This is a new script I have been working on for last few weeks, its still in a beta mode version but i want to publish it to get some feedback on it
This script uses a variety of indicators in conjunction with each other
Its unique in a way as it only LONGS and gives the exits rather than shorting too
It uses a percentage of the spread between average of high, low and close with ema crossover
it's uni-directional, picking longs only
Stop losses are wide enough to give the signal room for good results
it works best by backtesting against data to see results before using it on any particular symbol or timeframe
To try it our you may message me directly on tradingview chat
Thanks

SupterTrend I created this script for basically two reasons
1. there is not simple suptertrend indicator available on tv rather you will find many fancy suptrend indicators with confusing other indicators and absurd background colors i dont know why some of the trader coders are obsessed with is using over the top color and designing phenomena.
2. I want to let people know about the accuracy of suptertrend indicator on multiple time frames i am plaining to create a backtesting tool for almost all Famous indicators so that specially new folks know what should they expect from any particular Indicator
Also i added intraday filter to check the results for intrday signals . the sqaure off timings are for Indian markets only but you can edit the hours and minutes in the code for using other than indian markets. No need to do anything if you only want positional trading trading results

Patient Trendfollower (7)(alpha) Backtesting AlgorithmThis is an alpha version of backtesting algorithm for my Patient Trendfollower (7) strategy. It can help you adapt the indicator to other charts than EURUSD. Please bear in mind that price action, volume profiles and supzistences are a catalyst for successful trading, not an indicator. You can get significantly better results if you use these things in your trading and use Trendfollower only as a secondary tool.
Patient Trendfollower Indicator
Thanks belongs to @everget and Satik FX, their contributions are highlighted on an indicator page.

BO - RSI - M5 BacktestingBO - RSI - M5 Backtesting -Rule of Strategy
A. Data
1. Chart M5 IDC
2. Symbol: EURJPY
B. Indicator
1. RSI
2. Length: 12 (adjustable)
3. Extreme Top: 75 (adjustable)
4. Extreme Bottom: 25 (adjustable)
C. Rule of Signal
1. Put Signal
* Rsi create a temporary peak over Extreme Top
row61: peak_rsi= rsi >rsi and rsi >rsi and rsi rsi_top
2. Call Signal
* Rsi create a temporary bottom under Extreme Bottom
row62: bott_rsi= rsi rsi and rsi

UT Bot Strategy with Backtesting Range [QuantNomad]UT Bot indicator was inially developer by @Yo_adriiiiaan
Idea of original code belongs @HPotter
I can't update my original UT Bot Strategy so I publishing new strategy with backtesting range included.
I just took code of Yo_adriiiiaan, cleaned it, deleted all useless pieces of code, transformet to v4 and created a strategy from it.
Also I added an input that allows you to swich to signals from Heiking Ashi. I saw that author uses HA for the indicator and on HA it look much nices then on real candles.
Do not add this strategy to HA candles, use usual candles and this checkbox.
Original script:
UT Bot

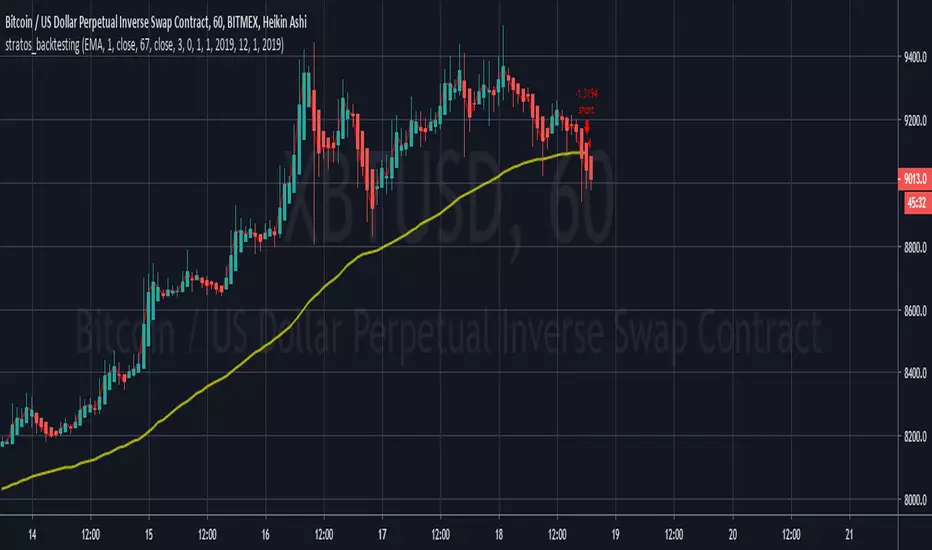
Stratos - Backtesting - Final Version - CryptoFoudid.comHi all,
Here you have the backtesting script based on Moving Average.
We trade automatically for our customers on the bitmex platform. For more information, contact me directly.
Cheers

-- Ultimate Crypto Trading Strategy -- Backtesting version** This is the backtesting (strategy) version of the ~ Ultimate Crypto Trading Strategy ~ script in TradingView. **
~ Ultimate Crypto Trading Strategy ~
֎ Trading system script on @tradingview that brings the easiest approach to trading with a high profitability rate
֎ Optimized for crypto markets, to catch trend movements as soon as possible and maximize profitability
֎ Sell & Buy alerts, Safeguard mode, Take Profits alerts, auto resistance-support and always adding new features!
֎ Customizable settings.
֎ Users Discord community for learning, sharing and direct support
֎ Ultimate Crypto Trading Strategy Tutorial Video: www.youtube.com www.youtube.com
֎ Safeguard feature (match multiple timeframes signals) explained: youtu.be youtu.be
If you’d like to test the trading script in TradingView, I can give you access to a 10 days trial.
Please send me a message in tradingview and I’ll activate it right away.
Thank you!

TigerBot SuperWave with MACD Skeleton (Faster Backtesting)Visit our website or direct message us to learn how you can get started with TigerBot automation today!
This strategy is a custom solution that we have provided. At this time, it is a private, invite only script.
Note: This is a TigerBot Strategy, which means that it includes our full set of automation and risk management features such as:
Thorough event triggers for automated order execution
Profit/Loss Zones
Profit/Loss Indicators
Take Profit
Normal Stop Loss
Trailing Stop Loss
Advanced Trailing Stop
Profit Locker Stop Loss
Advanced Pyramiding Support
Leverage Support
Much more
Each TigerBot Strategy includes a set of 3 scripts that belong together:
STRATEGY - used for full-featured customization with all our visuals
STUDY - with alert triggers for automation
SKELETON - for faster backtesting without the visuals enabled
This is the SKELETON version of this script. Please also see the other 2 related scripts.

TigerBot SuperWave with MACD Strategy (Backtesting)Visit our website or direct message us to learn how you can get started with TigerBot automation today!
This strategy is a custom solution that we have provided. At this time, it is a private, invite only script.
Note: This is a TigerBot Strategy, which means that it includes our full set of automation and risk management features such as:
Thorough event triggers for automated order execution
Profit/Loss Zones
Profit/Loss Indicators
Take Profit
Normal Stop Loss
Trailing Stop Loss
Advanced Trailing Stop
Profit Locker Stop Loss
Advanced Pyramiding Support
Leverage Support
Much more
Each TigerBot Strategy includes a set of 3 scripts that belong together:
STRATEGY - used for full-featured customization with all our visuals
STUDY - with alert triggers for automation
SKELETON - for faster backtesting without the visuals enabled
This is the STRATEGY version of this script. Please also see the other 2 related scripts.