[BACKTEST] CMYK-RMI-SMA◊ Introduction
This script makes use of three RMI's and SMA's, that indicate Overbought/Oversold on different Periods that correspond with Frequency’s that move the market.
◊ Origin
This is an update on █▓▒░ CMYK ♦ RMI ♦ TRIPLE ░▒▓█
◊ Usage
This script is intended for Automated Trading on the 1-5 minute chart.
◊ Features Summary
Two Part Indicator
Strategy Type Selection
Three RMI's SMA's
Trend adjustment
Pump/Dump Entry Delay
Pyramiding
Ignore first entries
Take Profit
Interval between Entries
Multiring Fix
Alert signal Seperation
◊ Community
Wanna try this script out ? need help resolving a problem ?
CMYK :: discord.gg
AUTOVIEW :: discordapp.com
TRADINGVIEW UNOFFICIAL :: discord.gg
◊ Setting up Autoview Alerts
Use the study version of this script, To set up The Alerts Autoview Picks up on.
Goto the CMYK Discord for support and Settings.
◊ Backtesting
Use the strategy version of this script for backtesting.
◊ Contact
Wanna try this script out ? need help resolving a problem ?
CMYK :: discord.gg
Happy trades!!!
In den Scripts nach "alert" suchen

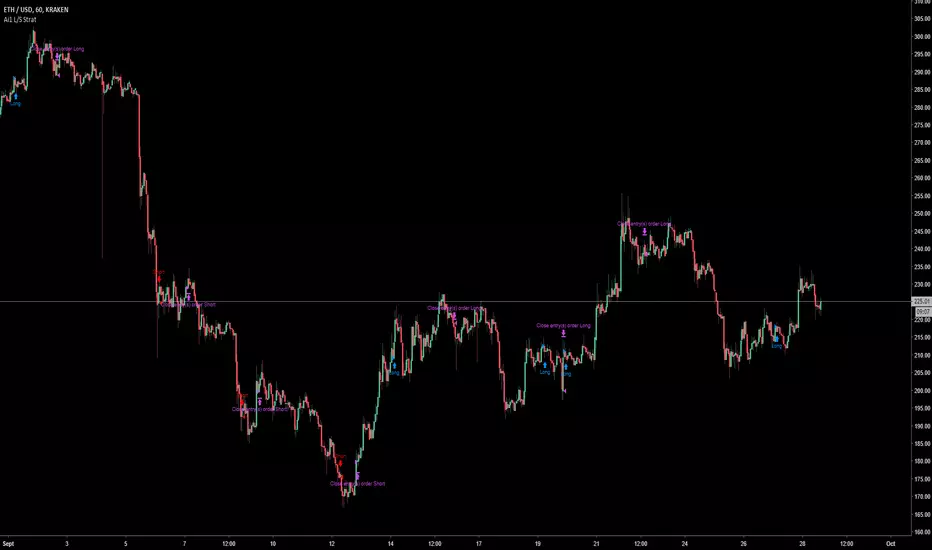
All-in-One Solutions - Long/Short StrategyHello,
I always had in mind that a single strategy cannot be profitable on multiple symbols or commodities ...
This is why I created this strategy where different settings can be applied for each of the symbol you use to trade.
For each symbol you trade, the strategy will ask you for 9 parameters to play with. I already filled the settings for several symbol but it is up to you to find the best 9 parameters for the symbol you like to trade and the time frame you usually use (I often use it in 1H).
The script does not allow any repaint and the Trading view back-testing system is reliable.
For exemple if you like to trade ETH/USD, you have to play with the 9 parameters and find the best net profitability calculated by the back-testing of Trading View.
Here is a screenshot of the setting page of the strategy :
imgur.com
You can find also below the link to all the previous scripts I published :
fr.tradingview.com
PS: please do not ask me to add in this strategy an alert system as Trading View does not allow to implement alerts in strategies script (because strategies scripts run on you computer, where alerts are located on TV servers).
Nevertheless if there is a demand, I can develop an indicator where you can implement the best settings found by you in this strategy and use it as an alerts script.
Please ask me for access, I grant free 1 week full access to all my indicators.
Have fun !
Last Update:
- I added the bar color in order to see on the chart the Long and Short positions
- I added the panels Open and Close positions to be visible on the chart
- I added an horizontal line on the chart when a position is open in order to see on the chart if position is positive or negative
- I modified the parameters description in order to make it more clear
I filled nice settings for 5 cryptos. If you find suitable settings for other commodities, please share the parameters into the comment in order to share with the community.
All-in-One Solutions - Long/Short StrategyHello,
I always had in mind that a single strategy cannot be profitable on multiple symbols or commodities...
This is why I created this strategy where different settings can be applied for each of the symbol you use to trade.
For each symbol you trade, the strategy will ask you for 9 parameters to play with. I already filled the settings for several symbol but it is up to you to find the best 9 parameters for the symbol you like to trade and the time frame you usually use (I often use it in 1H).
The script does not allow any repaint and the Trading view back-testing system is reliable.
For exemple if you like to trade ETH/USD, you have to play with the 9 parameters and find the best net profitability calculated by the back-testing of Trading View.
Here is a screenshot of the setting page of the strategy :
imgur.com
You can find also below the link to all the previous scripts I published :
fr.tradingview.com
PS: please do not ask me to add in this strategy an alert system as Trading View does not allow to implement alerts in strategies script (because strategies scripts run on you computer, where alerts are located on TV servers).
Nevertheless if there is a demand, I can develop an indicator where you can implement the best settings found by you in this strategy and use it as an alerts script.
Please ask me for access, I grant free 1 week full access to all my indicators.
Have fun !
DNP V3DNP V3 identifies optimal times to enter and exit a trade on relatively high-volume goods. The in-house algorithm works against all asset classes, from Forex, stocks, options and, especially, cryptocurrencies.
Through TV's alert system you can set up email alerts to notify you of any meaningful change in market activity, thereby giving you more time to take care of the things in life that are truly important.
There's no skill of interpretation required. Simply discover a set of values that return favorable profits on the backtest, set up the alert according to them and then buy and sell when told.
Welcome to the matrix
This script works best with: high volume, long-term goals, large trade positions.

Omni Trader Accompanying Backtesting StrategyVersion 1.0
Purpose
This backtesting strategy indicator is a accompanying tool for use with my popular trading and alert indicator: Omni Trader | RMI EMA RSI VOL | Margin Focused Indicator
Reference Indicator Link:
Features
This strategy has been programmed to act exactly how the accompanying indicator would be used with an automated strategy such as Autoview or through manual trading
Has identical coloured signals with correct icons for reference with the indicators standard alert conditions (LONG/SHORT)
The ability to toggle on or off all the logic and UI presets you could previously use to enhance the standard indicator
Fully customisable in the settings regarding trading strategy to match exactly how you have the reference indicator set up with alerts or how you are trading manually with it.
Ability to choose a timeframe, want to ignore the crypto boom at the latter stages of 2017? Sure you can, change the time frames in the settings to see a more recent representation of your trades.
Stop Loss & Take Profit enabled in this back tester for fine tuning of your strategy, especially useful for automated users to refine the most profitable settings for your style.
Access
This indicator is free for existing owners of my Omni Trader | RMI EMA RSI VOL | Margin Focused Indicator linked above as an accompanying tool to improve their strategy and net more profit. If you would like access to any of my indicators or would like to know more please find me on my community discord channel where you can find indicator details/documentation and general help:
Discord Link: discord.gg
Thank you for the immense support everyone, happy trading!
- Falco

CMYK RMI SMA Automated Strategy▼ This is the strategy version of the script, For Backtesting
◊ Introduction
This script makes use of three RMI's and SMA's, that indicate Overbought/Oversold on different Periods that correspond with Frequency’s that move the market.
◊ Origin
This is an update on █▓▒░ CMYK ♦ RMI ♦ TRIPLE ░▒▓█
◊ Usage
This script is intended for Automated Trading on the 1-5 minute chart.
◊ Features Summary
Two Part Indicator
Strategy Type Selection
Three RMI's SMA's
Trend adjustment
Pump/Dump Entry Delay
Pyramiding
Ignore first entries
Take Profit
Stop Loss
Interval between Entries
Multiring Fix
Alert signal Seperation
◊ Community
Wanna try this script out ? need help resolving a problem ?
CMYK :: discord.gg
AUTOVIEW :: discordapp.com
TRADINGVIEW UNOFFICIAL :: discord.gg
◊ Setting up Autoview Alerts
Use the study version of this script, To set up The Alerts Autoview Picks up on.
Goto the CMYK Discord for support and Settings.
◊ Backtesting
Use the strategy version of this script for backtesting.
◊ Contact
Wanna try this script out ? need help resolving a problem ?
CMYK :: discord.gg

Triple EMA Cross Strategy by lvinnylThis is a pretty simple strategy that uses three exponential moving averages (fast, normal, and slow) and enters a long position when the fast EMA is above the normal EMA and the normal EMA is above the slow EMA. The position will be closed once the inverse is true (slow is above normal and normal is above fast).
The settings allow you to choose your data source and the fast, normal and slow EMAs for your personal customization. It also includes custom back testing time frame inputs to target specific time frames in history to view its performance.
There is also a study version that supports alerts. The alerts are called "Long Condition" and "Short Condition".
Tips are welcomed...
BTC: 3B9vjMxrbdtbmZ3r3iGyq1uxxsnbkKNFzv
LTC: MU3oDbfDGeSxcAZc2VkMz31gKFDHAh5eF7
ETH: 0x6c432B24c4c62c3D2A8C55e6132FF1267A914110
Enjoy!

K.M Trend Strategy (BETA 1.2)My beautiful traders, how is everyone doing? This indicator I built detects trends, I haven't seen any repaints, I only had 3 minor ones. It is still on BETA version.
To all new traders, and busy traders I will be posting one that you can set alerts. Please look under my profile or type " K.M Trend Alerts (BETA 1.2) " .
I ask for everyone to try this script out, please provide any feedback under in the comments below. Any feedback will be amazing! Thank you to everyone, and www.tradingview.com.
Sincerely,
Kevin Manrrique
Follow us on Instagram: TWTForexGroup, we have amazing content and also sell signals!

ATR (Back Testing Script) by CanadianCryptoChrisHey Everyone,
Many people been watching my youtube and saw my ATR script and the one I was using before. I have created and broke off a chunk of my script, the ATR and backtesting abilities in this one for all those that want to be able to backtest their ATR strategies. Remember to fine tune your ATR to your timeframe and trading pair. For more information on this script, please check out my youtube:
How the ATR works:
youtu.be
How to tune the ATR:
youtu.be
And how to properly use this script:
Coming Shortly after I release this :)
Please check my youtube channel for this video on how to use this with backtesting capabilities. I will post a link after I make the video!
www.youtube.com
I will be releasing the Alerting Script shortly! As well as my backtesting and alerting scripts for my Guppy as well, each individually!
Thanks,
Chris

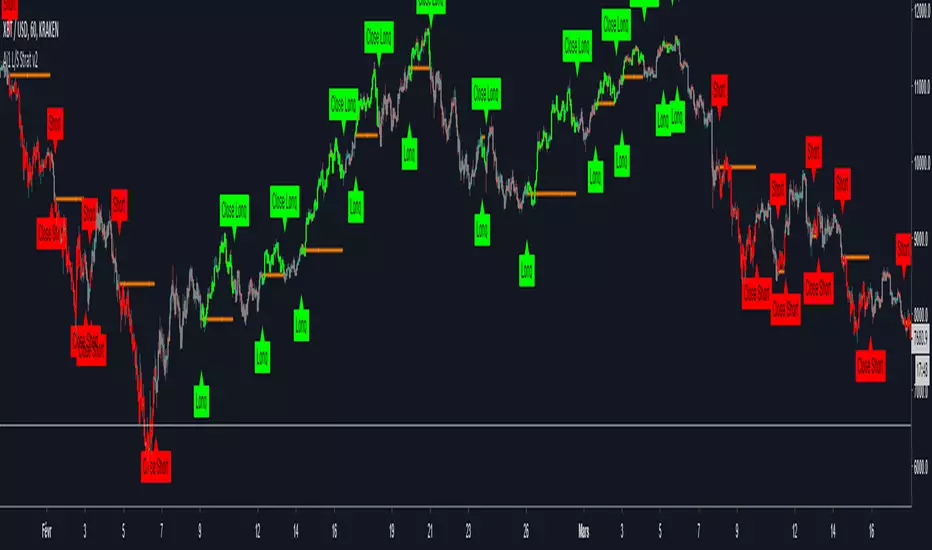
MP Rollercoaster Strat
This TMA strategy is called rollercoaster for the rounded ways it follows the moving average. Tried pinpointing entry/exit points as well as I could. Included alertconditions as well as syntax at the bottom for use with Autoview in a margin or spot trading environment. There is also the Study side for syntax and alertconditions use :) (autoview users and more!)
As usual, free to use, change it to suit your needs, please don't resell for profit.
For carpel tunnel surgery!
btc addy- 1Dsg49Zt2FQ9BnUHrmXQwvhL5dd3teqa7g
ltc addy- LYUpgsHSHnKeYdNaj9bu9prK4QsnJXEQtP
pinkcoin addy- 2PoeXyAk3rF9FmMC8azme2mGzMYsEiZ5eS
Trend Following $BTC - Multi-Timeframe Structure + ReversTREND FOLLOWING STRATEGY - MULTI-TIMEFRAME STRUCTURE BREAKOUT SYSTEM
Strategy Overview
This is an enhanced Turtle Trading system designed for cryptocurrency spot trading. It combines Donchian Channel breakouts with multi-timeframe structure filtering and ATR-based dynamic risk management. The strategy trades both long and short positions using reverse signal exits to maximize trend capture.
Core Features
Multi-Timeframe Structure Filtering
The strategy uses Swing High/Low analysis to identify market structure trends. You can customize the structure timeframe (default: 3 minutes) to match your trading style. Only enters trades aligned with the identified trend direction, avoiding counter-trend positions that often lead to losses.
Reverse Signal Exit System
Instead of using fixed stop-losses or time-based exits, this strategy exits positions only when a reverse entry signal triggers. This approach maximizes trend profits and reduces premature exits during normal market retracements.
ATR Dynamic Pyramiding
Automatically adds positions when price moves 0.5 ATR in your favor. Supports up to 2 units maximum (adjustable). This pyramid scaling enhances profitability during strong trends while maintaining disciplined risk management.
Complete Risk Management
Fixed position sizing at 5000 USD per unit. Includes realistic commission fees of 0.06% (Binance spot rate). Initial capital set at 10,000 USD. All backtest parameters reflect real-world trading conditions.
Trading Logic
Entry Conditions
Long Entry: Close price breaks above the 20-period high AND structure trend is bullish (price breaks above Swing High)
Short Entry: Close price breaks below the 20-period low AND structure trend is bearish (price breaks below Swing Low)
Position Scaling
Long positions: Add when price rises 0.5 ATR or more
Short positions: Add when price falls 0.5 ATR or more
Maximum 2 units including initial entry
Exit Conditions
Long Exit: Triggers when short entry signal appears (price breaks 20-period low + structure turns bearish)
Short Exit: Triggers when long entry signal appears (price breaks 20-period high + structure turns bullish)
Default Parameters
Channel Settings
Entry Channel Period: 20 (Donchian Channel breakout period)
Exit Channel Period: 10 (reserved parameter)
ATR Settings
ATR Period: 20
Stop Loss ATR Multiplier: 2.0
Add Position ATR Multiplier: 0.5
Structure Filter
Swing Length: 300 (Swing High/Low calculation period)
Structure Timeframe: 3 minutes
Adjust these based on your trading timeframe and asset volatility
Position Management
Maximum Units: 2 (including initial entry)
Capital Per Unit: 5000 USD
Visualization Features
Background Colors
Light Green: Bullish market structure
Light Red: Bearish market structure
Dark Green: Long position entry
Dark Red: Short position entry
Optional Display Elements (Default: OFF)
Entry and exit channel lines
Structure high/low reference lines
ATR stop-loss indicator
Next position add level
Entry/exit labels
Alert Message Format
The strategy sends notifications with the following format:
Entry: "5m Long EP:90450.50"
Add Position: "15m Add Long 2/2 EP:91000.25"
Exit: "5m Close Long Reverse Signal"
Where the first part shows your current chart timeframe and EP indicates Entry Price
Backtest Settings
Capital Allocation
Initial Capital: 10,000 USD
Per Entry: 5,000 USD (split into 2 potential entries)
Leverage: 0x (spot trading only)
Trading Costs
Commission: 0.06% (Binance spot VIP0 rate)
Slippage: 0 (adjust based on your experience)
Best Use Cases
Ideal Scenarios
Trending markets with clear directional movement
Moderate to high volatility assets
Timeframes from 1-minute to 4-hour charts
Best suited for major cryptocurrencies with good liquidity
Not Recommended For
Highly volatile choppy/ranging markets
Low liquidity small-cap coins
Extreme market conditions or black swan events
Usage Recommendations
Timeframe Guidelines
1-5 minute charts: Use for scalping, consider Swing Length 100-160
15-30 minute charts: Good for short-term trading, Swing Length 50-100
1-4 hour charts: Suitable for swing trading, Swing Length 20-50
Optimization Tips
Always backtest on historical data before live trading
Adjust swing length based on asset volatility and your timeframe
Different cryptocurrencies may require different parameter settings
Enable visualization options initially to understand entry/exit points
Monitor win rate and drawdown during backtesting
Technical Details
Built on Pine Script v6
No repainting - uses proper bar referencing with offset
Prevents lookahead bias with lookahead=off parameter
Strategy mode with accurate commission and slippage modeling
Multi-timeframe security function for structure analysis
Proper position state tracking to avoid duplicate signals
Risk Disclaimer
This strategy is provided for educational and research purposes only. Past performance does not guarantee future results. Backtesting results may differ from live trading due to slippage, execution delays, and changing market conditions. The strategy performs best in trending markets and may experience drawdowns during ranging conditions. Always practice proper risk management and never risk more than you can afford to lose. It is recommended to paper trade first and start with small position sizes when going live.
How to Use
Add the strategy to your TradingView chart
Select your desired timeframe (1m to 4h recommended)
Adjust parameters based on your risk tolerance and trading style
Review backtest results in the Strategy Tester tab
Set up alerts for automated notifications
Consider paper trading before risking real capital
Tags
Trend Following, Turtle Trading, Donchian Channel, Structure Breakout, ATR, Cryptocurrency, Spot Trading, Risk Management, Pyramiding, Multi-Timeframe Analysis
---
Strategy Name: Trend Following BTC
Version: v1.0
Pine Script Version: v6
Last Updated: December 2025

Options Scalper v2 - SPY/QQQHere's a comprehensive description of the Options Scalper v2 strategy:
---
## Options Scalper v2 - SPY/QQQ
### Overview
A multi-indicator confluence-based scalping strategy designed for trading SPY and QQQ options on short timeframes (1-5 minute charts). The strategy uses a scoring system to generate high-probability CALL and PUT signals by requiring alignment across multiple technical indicators before triggering entries.
---
### Core Logic
The strategy operates on a **scoring system (0-9 points)** where both bullish (CALL) and bearish (PUT) conditions are evaluated independently. A signal only fires when:
1. A recent EMA crossover occurred (within the last 3 bars)
2. The direction's score meets the minimum threshold (default: 4 points)
3. The signal's score is higher than the opposite direction
4. Enough bars have passed since the last signal (cooldown period)
5. Price action occurs during valid trading sessions
---
### Indicators Used
| Indicator | Purpose | CALL Condition | PUT Condition |
|-----------|---------|----------------|---------------|
| **9/21 EMA Cross** | Primary trigger | Fast EMA crosses above slow | Fast EMA crosses below slow |
| **200 EMA** | Trend filter | Price above 200 EMA | Price below 200 EMA |
| **RSI (14)** | Momentum filter | RSI between 45-65 | RSI between 35-55 |
| **VWAP** | Institutional level | Price above VWAP | Price below VWAP |
| **MACD (12,26,9)** | Momentum confirmation | MACD line > Signal line | MACD line < Signal line |
| **Stochastic (14,3)** | Overbought/Oversold | Oversold or K > D | Overbought or K < D |
| **Volume** | Participation confirmation | Spike on green candle | Spike on red candle |
| **Price Structure** | Breakout detection | Higher high formed | Lower low formed |
---
### Scoring Breakdown
**CALL Score (Max 9 points):**
- Recent EMA cross up: +2 pts
- EMA alignment (fast > slow): +1 pt
- RSI in bullish range: +1 pt
- Above VWAP: +1 pt
- MACD bullish: +1 pt
- Volume spike on green candle: +1 pt
- Stochastic setup: +1 pt
- Above 200 EMA: +1 pt
- Breaking higher high: +1 pt
**PUT Score (Max 9 points):**
- Recent EMA cross down: +2 pts
- EMA alignment (fast < slow): +1 pt
- RSI in bearish range: +1 pt
- Below VWAP: +1 pt
- MACD bearish: +1 pt
- Volume spike on red candle: +1 pt
- Stochastic setup: +1 pt
- Below 200 EMA: +1 pt
- Breaking lower low: +1 pt
---
### Risk Management
The strategy uses **ATR-based dynamic stops and targets**:
| Parameter | Default | Description |
|-----------|---------|-------------|
| Stop Loss | 1.5x ATR | Distance below entry for longs, above for shorts |
| Take Profit | 2.0x ATR | Creates a 1:1.33 risk-reward ratio |
Positions are also closed on:
- Opposite direction signal (flip trade)
- Take profit or stop loss hit
---
### Session Filtering
Trades are restricted to high-liquidity periods by default:
- **Morning Session:** 9:30 AM - 11:00 AM EST
- **Afternoon Session:** 2:30 PM - 3:55 PM EST
This avoids choppy midday price action and captures the highest volume periods.
---
### Input Parameters
| Parameter | Default | Description |
|-----------|---------|-------------|
| Fast EMA | 9 | Fast moving average period |
| Slow EMA | 21 | Slow moving average period |
| Trend EMA | 200 | Long-term trend filter |
| RSI Length | 14 | RSI calculation period |
| RSI Overbought | 65 | Upper RSI threshold |
| RSI Oversold | 35 | Lower RSI threshold |
| Volume Multiplier | 1.2x | Volume spike detection threshold |
| Min Signal Strength | 4 | Minimum score required to trigger |
| Crossover Lookback | 3 | Bars to consider crossover "recent" |
| Min Bars Between Signals | 5 | Cooldown period between signals |
---
### Visual Elements
**Chart Plots:**
- Green line: 9 EMA (fast)
- Red line: 21 EMA (slow)
- Gray line: 200 EMA (trend)
- Purple dots: VWAP
**Signal Markers:**
- Green triangle up + "CALL" label: Buy call signal
- Red triangle down + "PUT" label: Buy put signal
- Small circles: EMA crossover reference points
**Info Table (Top Right):**
- Real-time CALL and PUT scores
- RSI, MACD, Stochastic values
- VWAP and 200 EMA position
- Recent crossover status
- Current signal state
---
### Alerts
| Alert Name | Trigger |
|------------|---------|
| CALL Entry | Standard call signal fires |
| PUT Entry | Standard put signal fires |
| Strong CALL | Call signal with score ≥ 6 |
| Strong PUT | Put signal with score ≥ 6 |
---
### Recommended Usage
| Setting | 0DTE Scalping | Intraday Swings |
|---------|---------------|-----------------|
| Timeframe | 1-2 min | 5 min |
| Min Signal Strength | 5-6 | 4 |
| ATR Stop Mult | 1.0 | 1.5 |
| ATR TP Mult | 1.5 | 2.0 |
| Option Delta | 0.40-0.50 | 0.30-0.40 |
---
### Key Improvements Over v1
1. **Requires actual crossover** - Eliminates false signals from simple trend continuation
2. **Balanced scoring** - Both directions evaluated equally, highest score wins
3. **Signal cooldown** - Prevents overtrading with minimum bar spacing
4. **Multi-indicator confluence** - 8 factors must align for signal generation
5. **Volume-candle alignment** - Volume spikes only count when matching candle direction
---
### Disclaimer
This strategy is for educational purposes. Backtest thoroughly before live trading. Options trading involves significant risk of loss. Past performance does not guarantee future results.

Third eye • StrategyThird eye • Strategy – User Guide
1. Idea & Concept
Third eye • Strategy combines three things into one system:
Ichimoku Cloud – to define market regime and support/resistance.
Moving Average (trend filter) – to trade only in the dominant direction.
CCI (Commodity Channel Index) – to generate precise entry signals on momentum breakouts.
The script is a strategy, not an indicator: it can backtest entries, exits, SL, TP and BreakEven logic automatically.
2. Indicators Used
2.1 Ichimoku
Standard Ichimoku settings (by default 9/26/52/26) are used:
Conversion Line (Tenkan-sen)
Base Line (Kijun-sen)
Leading Span A & B (Kumo Cloud)
Lagging Span is calculated but hidden from the chart (for visual simplicity).
From the cloud we derive:
kumoTop – top of the cloud under current price.
kumoBottom – bottom of the cloud under current price.
Flags:
is_above_kumo – price above the cloud.
is_below_kumo – price below the cloud.
is_in_kumo – price inside the cloud.
These conditions are used as trend / regime filters and for stop-loss & trailing stops.
2.2 Moving Average
You can optionally display and use a trend MA:
Types: SMA, EMA, DEMA, WMA
Length: configurable (default 200)
Source: default close
Filter idea:
If MA Direction Filter is ON:
When Close > MA → strategy allows only Long signals.
When Close < MA → strategy allows only Short signals.
The MA is plotted on the chart (if enabled).
2.3 CCI & Panel
The CCI (Commodity Channel Index) is used for entry timing:
CCI length and source are configurable (default length 20, source hlc3).
Two thresholds:
CCI Upper Threshold (Long) – default +100
CCI Lower Threshold (Short) – default –100
Signals:
Long signal:
CCI crosses up through the upper threshold
cci_val < upper_threshold and cci_val > upper_threshold
Short signal:
CCI crosses down through the lower threshold
cci_val > lower_threshold and cci_val < lower_threshold
There is a panel (table) in the bottom-right corner:
Shows current CCI value.
Shows filter status as colored dots:
Green = filter enabled and passed.
Red = filter enabled and blocking trades.
Gray = filter is disabled.
Filters shown in the panel:
Ichimoku Cloud filter (Long/Short)
Ichimoku Lines filter (Conversion/Base vs Cloud)
MA Direction filter
3. Filters & Trade Direction
All filters can be turned ON/OFF independently.
3.1 Ichimoku Cloud Filter
Purpose: trade only when price is clearly above or below the Kumo.
Long Cloud Filter (Use Ichimoku Cloud Filter) – when enabled:
Long trades only if close > cloud top.
Short Cloud Filter – when enabled:
Short trades only if close < cloud bottom.
If the cloud filter is disabled, this condition is ignored.
3.2 Ichimoku Lines Above/Below Cloud
Purpose: stronger trend confirmation: Ichimoku lines should also be on the “correct” side of the cloud.
Long Lines Filter:
Long allowed only if Conversion Line and Base Line are both above the cloud.
Short Lines Filter:
Short allowed only if both lines are below the cloud.
If this filter is OFF, the conditions are not checked.
3.3 MA Direction Filter
As described above:
When ON:
Close > MA → only Longs.
Close < MA → only Shorts.
4. Anti-Re-Entry Logic (Cloud Touch Reset)
The strategy uses internal flags to avoid continuous re-entries in the same direction without a reset.
Two flags:
allowLong
allowShort
After a Long entry, allowLong is set to false, allowShort to true.
After a Short entry, allowShort is set to false, allowLong to true.
Flags are reset when price touches the Kumo:
If Low goes into the cloud → allowLong = true
If High goes into the cloud → allowShort = true
If Close is inside the cloud → both allowLong and allowShort are set to true
There is a key option:
Wait Position Close Before Flag Reset
If ON: cloud touch will reset flags only when there is no open position.
If OFF: flags can be reset even while a trade is open.
This gives a kind of regime-based re-entry control: after a trend leg, you wait for a “cloud interaction” to allow new signals.
5. Risk Management
All risk management is handled inside the strategy.
5.1 Position Sizing
Order Size % of Equity – default 10%
The strategy calculates:
position_value = equity * (Order Size % / 100)
position_qty = position_value / close
So position size automatically adapts to your current equity.
5.2 Take Profit Modes
You can choose one of two TP modes:
Percent
Fibonacci
5.2.1 Percent Mode
Single Take Profit at X% from entry (default 2%).
For Long:
TP = entry_price * (1 + tp_pct / 100)
For Short:
TP = entry_price * (1 - tp_pct / 100)
One strategy.exit per side is used: "Long TP/SL" and "Short TP/SL".
5.2.2 Fibonacci Mode (2 partial TPs)
In this mode, TP levels are based on a virtual Fib-style extension between entry and stop-loss.
Inputs:
Fib TP1 Level (default 1.618)
Fib TP2 Level (default 2.5)
TP1 Share % (Fib) (default 50%)
TP2 share is automatically 100% - TP1 share.
Process for Long:
Compute a reference Stop (see SL section below) → sl_for_fib.
Compute distance: dist = entry_price - sl_for_fib.
TP levels:
TP1 = entry_price + dist * (Fib TP1 Level - 1)
TP2 = entry_price + dist * (Fib TP2 Level - 1)
For Short, the logic is mirrored.
Two exits are used:
TP1 – closes TP1 share % of position.
TP2 – closes remaining TP2 share %.
Same stop is used for both partial exits.
5.3 Stop-Loss Modes
You can choose one of three Stop Loss modes:
Stable – fixed % from entry.
Ichimoku – fixed level derived from the Kumo.
Ichimoku Trailing – dynamic SL following the cloud.
5.3.1 Stable SL
For Long:
SL = entry_price * (1 - Stable SL % / 100)
For Short:
SL = entry_price * (1 + Stable SL % / 100)
Used both for Percent TP mode and as reference for Fib TP if Kumo is not available.
5.3.2 Ichimoku SL (fixed, non-trailing)
At the time of a new trade:
For Long:
Base SL = cloud bottom minus small offset (%)
For Short:
Base SL = cloud top plus small offset (%)
The offset is configurable: Ichimoku SL Offset %.
Once computed, that SL level is fixed for this trade.
5.3.3 Ichimoku Trailing SL
Similar to Ichimoku SL, but recomputed each bar:
For Long:
SL = cloud bottom – offset
For Short:
SL = cloud top + offset
A red trailing SL line is drawn on the chart to visualize current stop level.
This trailing SL is also used as reference for BreakEven and for Fib TP distance.
6. BreakEven Logic (with BE Lines)
BreakEven is optional and supports two modes:
Percent
Fibonacci
Inputs:
Percent mode:
BE Trigger % (from entry) – move SL to BE when price goes this % in profit.
BE Offset % from entry – SL will be set to entry ± this offset.
Fibonacci mode:
BE Fib Level – Fib level at which BE will be activated (default 1.618, same style as TP).
BE Offset % from entry – how far from entry to place BE stop.
The logic:
Before BE is triggered, SL follows its normal mode (Stable/Ichimoku/Ichimoku Trailing).
When BE triggers:
For Long:
New SL = max(current SL, BE SL).
For Short:
New SL = min(current SL, BE SL).
This means BE will never loosen the stop – only tighten it.
When BE is activated, the strategy draws a violet horizontal line at the BreakEven level (once per trade).
BE state is cleared when the position is closed or when a new position is opened.
7. Entry & Exit Logic (Summary)
7.1 Long Entry
Conditions for a Long:
CCI signal:
CCI crosses up through the upper threshold.
Ichimoku Cloud Filter (optional):
If enabled → price must be above the Kumo.
Ichimoku Lines Filter (optional):
If enabled → Conversion Line and Base Line must be above the Kumo.
MA Direction Filter (optional):
If enabled → Close must be above the chosen MA.
Anti-re-entry flag:
allowLong must be true (cloud-based reset).
Position check:
Long entries are allowed when current position size ≤ 0 (so it can also reverse from short to long).
If all these conditions are true, the strategy sends:
strategy.entry("Long", strategy.long, qty = calculated_qty)
After entry:
allowLong = false
allowShort = true
7.2 Short Entry
Same structure, mirrored:
CCI signal:
CCI crosses down through the lower threshold.
Cloud filter: price must be below cloud (if enabled).
Lines filter: conversion & base must be below cloud (if enabled).
MA filter: Close must be below MA (if enabled).
allowShort must be true.
Position check: position size ≥ 0 (allows reversal from long to short).
Then:
strategy.entry("Short", strategy.short, qty = calculated_qty)
Flags update:
allowShort = false
allowLong = true
7.3 Exits
While in a position:
The strategy continuously recalculates SL (depending on chosen mode) and, in Percent mode, TP.
In Fib mode, fixed TP levels are computed at entry.
BreakEven may raise/tighten the SL if its conditions are met.
Exits are executed via strategy.exit:
Percent mode: one TP+SL exit per side.
Fib mode: two partial exits (TP1 and TP2) sharing the same SL.
At position open, the script also draws visual lines:
White line — entry price.
Green line(s) — TP level(s).
Red line — SL (if not using Ichimoku Trailing; with trailing, the red line is updated dynamically).
Maximum of 30 lines are kept to avoid clutter.
8. How to Use the Strategy
Choose market & timeframe
Works well on trending instruments. Try crypto, FX or indices on H1–H4, or intraday if you prefer more trades.
Adjust Ichimoku settings
Keep defaults (9/26/52/26) or adapt to your timeframe.
Configure Moving Average
Typical: EMA 200 as a trend filter.
Turn MA Direction Filter ON if you want to trade only with the main trend.
Set CCI thresholds
Default ±100 is classic.
Lower thresholds → more signals, higher noise.
Higher thresholds → fewer but stronger signals.
Enable/disable filters
Turn on Ichimoku Cloud and Ichimoku Lines if you want only “clean” trend trades.
Use Wait Position Close Before Flag Reset to control how often re-entries are allowed.
Choose TP & SL mode
Percent mode is simpler and easier to understand.
Fibonacci mode is more advanced: it aligns TP levels with the distance to stop, giving asymmetric RR setups (two partial TPs).
Choose Stable SL for fixed-risk trades, or Ichimoku / Ichimoku Trailing to tie stops to the cloud structure.
Set BreakEven
Enable BE if you want to lock in risk-free trades after a certain move.
Percent mode is straightforward; Fib mode keeps BreakEven in harmony with your Fib TP setup.
Run Backtest & Optimize
Press “Add to chart” → go to Strategy Tester.
Adjust parameters to your market and timeframe.
Look at equity curve, PF, drawdown, average trade, etc.
Live / Paper Trading
After you’re satisfied with backtest results, use the strategy to generate signals.
You can mirror entries/exits manually or connect them to alerts (if you build an alert-based execution layer).

RC - Crypto Scalper v3Cryptocurrency scalping strategy for perpetual futures with risk management and automation capabilities.
## Strategy Overview
This strategy identifies high-probability scalping opportunities in cryptocurrency perpetual futures markets using adaptive position sizing, dynamic stop losses, and intelligent exit management to maintain consistent risk-adjusted returns across varying market conditions.
## Technical Foundation
The strategy employs exponential moving averages for trend detection, Bollinger Bands for volatility measurement and mean reversion signals, RSI for momentum confirmation and overbought/oversold conditions, ATR for dynamic volatility-based stop placement, and VWAP for institutional price level identification. These technical indicators are combined with volume analysis and optional multi-timeframe confirmation to filter low-probability setups.
## Entry Methodology
The strategy identifies trading opportunities using three complementary approaches that can be enabled individually or in combination:
Momentum-Based Entries: Detects directional price movements aligned with short-term and intermediate-term trend indicators, with momentum oscillator confirmation to avoid entries at exhaustion points. Volume analysis provides additional confirmation of institutional participation.
Mean Reversion Entries: Identifies price extremes using statistical volatility bands combined with momentum divergence, targeting high-probability reversal zones in ranging market conditions. Entries require initial price structure confirmation to reduce false signals.
Institutional Flow Entries: Monitors volume-weighted price levels to identify areas where institutional orders are likely concentrated, entering on confirmed breaks of these key levels with supporting directional bias from trend indicators.
Each methodology uses distinct combinations of the technical indicators mentioned above, with specific parameter relationships and confirmation requirements that can be customized based on trader preference and market conditions.
## Exit Framework
Adaptive Stop Loss: Uses ATR-based stops (default 0.7x multiplier on 14-period ATR) that automatically adjust to current market volatility. Stop distance expands during volatile periods to avoid premature stops while tightening during consolidation to protect capital. Alternative percentage-based stops available for traders preferring fixed-distance risk management.
Trailing Profit System: Employs a dual-target exit approach combining fixed limit orders with dynamic trailing stops. The system activates trailing stops when positions reach profitable thresholds, allowing winning trades to capture extended moves while protecting accumulated gains. The high fixed limit (6R default) serves as a ceiling for exceptional moves while the trailing mechanism handles the majority of exits at optimal profit levels.
Time-Based Management: Implements maximum holding period constraints (50 bars default) to prevent capital from being trapped in directionless price action. This ensures consistent capital turnover and prevents the strategy from holding through extended consolidation periods.
Breakeven Protection: Automatically adjusts stop loss to entry price plus commission costs once trades reach predefined profit thresholds (0.7R default), eliminating downside risk on positions that have demonstrated directional follow-through.
## Risk Management
Position Sizing: Dynamic position sizing based on account equity percentage risk model (2% default). Calculates optimal position size based on entry price, stop distance, and account risk tolerance. Includes maximum position exposure caps and minimum position size thresholds to ensure practical trade execution.
Daily Loss Limits: Automatic trading suspension when intraday losses exceed configured threshold (5% of equity default). Prevents catastrophic drawdown days and removes emotional decision-making during adverse market conditions. Resets automatically at the start of each new trading day.
Leverage Controls: Comprehensive leverage monitoring with built-in liquidation protection for margined positions. Strategy calculates liquidation prices based on leverage settings and automatically closes positions approaching critical margin levels, preventing forced liquidations.
Exposure Management: Multiple layers of position size controls including maximum position value as percentage of equity (50% default), leverage-adjusted margin requirements, and minimum capital availability thresholds before opening new positions.
## Market Filters
Session-Based Filtering: Configurable trading windows for Asian (00:00-08:00 UTC), London (08:00-16:00 UTC), and New York (13:00-21:00 UTC) sessions. Allows traders to focus on specific market hours or avoid illiquid periods based on their asset and trading style.
Volatility Requirements: Minimum and maximum ATR percentage thresholds ensure strategy only operates within optimal volatility ranges. Prevents trading during both insufficient movement periods and extreme volatility events where execution quality deteriorates.
Trend Alignment: Optional higher timeframe trend filter ensures directional bias aligns with broader market structure, reducing counter-trend entries during strong directional moves.
Volume Confirmation: Configurable volume requirements for entry validation, ensuring sufficient market participation and reducing false signals during low-liquidity periods.
## Automation Support
Built-in webhook integration generates JSON payloads compatible with popular broker automation platforms. Alert system provides comprehensive notifications for all entry signals, exit executions, risk limit breaches, and daily trading status updates. Supports both automated and manual execution workflows.
## Settings Explanation
Initial Capital: $5,000
Selected as realistic starting point for retail traders entering crypto futures markets. Strategy scales proportionally - larger accounts show similar percentage returns with proportionally larger absolute gains and position sizes.
Risk Per Trade: 2%
Conservative default providing significant drawdown tolerance. With 51% historical win rate and positive expectancy, risking 2% per trade allows for extended losing streaks without account impairment. Adjustable from 0.5% (very conservative) to 5% (aggressive, experienced traders only).
Leverage: 10x
Standard cross-margin leverage for cryptocurrency perpetual futures. Combined with 2% risk setting and maximum 50% equity position size caps, actual exposure remains controlled despite leverage. Built-in liquidation protection provides additional safety layer.
Commission: 0.055%
Modeled on major exchange maker fee structures (Bybit, Binance Futures).
**Slippage: 50 ticks**
Ultra-conservative slippage assumption representing extreme worst-case execution scenarios. ETH perpetual tick size is $0.01, therefore 50 ticks equals $0.50 per side or $1.00 round trip slippage per trade.
Real-world slippage on 30-minute timeframe typically ranges from 2-5 ticks ($0.02-0.05 round trip) under normal conditions, with 10-20 ticks during highly volatile periods. The 50-tick setting assumes every single trade executes during extreme market stress conditions.
This ultra-conservative modeling approach means real-world trading performance under typical market conditions may exceed backtest results, as the strategy has been tested under punishing execution cost assumptions that represent worst-case scenarios rather than expected outcomes.
Stop Loss: ATR-based (0.7x multiplier)
Volatility-adaptive stops optimized for 30-minute cryptocurrency perpetuals. The 0.7x multiplier balances protection against premature stops due to normal market noise. Lower multipliers (0.5-0.6x) suitable for lower timeframes, higher multipliers (0.8-1.2x) for higher timeframes.
Take Profit: 6R (Risk:Reward)
High target designed to work in conjunction with trailing stop system rather than as primary exit mechanism. Historical analysis shows most profitable trades exit via trailing stops at lower multiples, with the 6R limit capturing occasional extended moves. This configuration allows the trailing stop system to operate optimally while providing upside capture on exceptional price runs.
Trailing Stop: Activates at 1R | Offset 0.5R
Trailing mechanism engages when position reaches 1:1 risk-reward, then maintains 0.5R distance from peak favourable price. This configuration allows profitable trades room to develop while protecting accumulated gains from reversals.
Maximum Holding Period: 50 bars
Automatic exit trigger after 50 bars (25 hours on 30-minute timeframe) prevents capital commitment to non-trending price action. Adjustable based on timeframe and trading style preferences.
## Backtest Performance
Test Period: November 2023 - November 2025 (2 years)
Asset: ETH/USDT Perpetual Futures
Timeframe: 30 minutes
Initial Capital: $5,000
Performance Metrics:
- Final Equity: $25,353.99
- Net Profit: $20,353.99
- Total Return: 407.08%
- Annualized Return: ~204%
- Total Trades: 2,549
- Winning Trades: 1,308 (51.28%)
- Losing Trades: 1,241 (48.72%)
- Profit Factor: 1.215
- Sharpe Ratio: 0.813
- Sortino Ratio: 6.428
- Maximum Drawdown: 11.53%
- Average Drawdown: <2%
Trade Statistics:
- Average Win: 1.15% per trade
- Average Loss: -0.98% per trade
- Win/Loss Ratio: 1.17:1
- Largest Win: 7.14%
- Largest Loss: -2.31%
- Average Trade Duration: ~8 hours
- Trades Per Month: ~106
Cost Analysis:
- Total Commission Paid: $21,277.06
- Commission as % of Gross Profit: 18.5%
- Modeled Slippage Impact: $2,549.00 (50 ticks per trade)
- Total Trading Costs: $23,826.06
- Net Profit After All Costs: $20,353.99
Risk-Adjusted Performance:
- Return/Max DD Ratio: 35.3
- Profit Per Trade: $7.98 average
- Risk of Ruin: <0.001% (with 2% risk, 51% win rate, 1.17 R:R)
## Bear Market Validation
To validate robustness across different market conditions, the strategy was additionally tested during the 2022 cryptocurrency bear market:
Test Period: May 2022 - November 2022 (7 months)
Market Conditions: ETH declined 57% (from ~$2,900 to ~$1,200)
Bear Market Results:
- Net Profit: $4,959.69
- Return: 99.19%
- Total Trades: 845
- Win Rate: 51.72%
- Maximum Drawdown: 18.54%
- Profit Factor: 1.235
- Outperformance vs Buy & Hold: +156.3%
The strategy demonstrated profitable performance during severe market decline, with short positions showing particular strength (54.1% win rate on shorts vs 49.4% on longs). This validates that the edge is not dependent on bullish market conditions and the multiple entry methodologies adapt naturally to different market environments.
## Recommended Usage
Optimal Timeframes:
- Primary: 30-minute (tested and optimized)
- Alternative: 1-hour (more selective, fewer trades)
- Not recommended: <15-minute (execution quality deteriorates)
Suitable Assets:
High-liquidity cryptocurrency perpetual futures recommended:
- BTC/USDT (>$2B daily volume)
- ETH/USDT (>$1B daily volume)
- SOL/USDT, AVAX/USDT (>$100M daily volume)
- Avoid low-liquidity pairs (<$50M daily volume)
Risk Configuration:
- Conservative: 1-1.5% per trade
- Moderate: 2-3% per trade (default: 2%)
- Aggressive: 3-5% per trade (requires discipline)
## Important Considerations
Backtesting vs Live Trading: Always paper trade first. Real-world results vary based on execution quality, broker-specific factors, network latency, and individual trade management decisions. Backtest performance represents historical simulation with ultra-conservative cost assumptions, not guaranteed future results.
Market Conditions: Strategy designed for liquid, actively-traded markets. Performance characteristics:
- Strong trends: Optimal (trailing stops capture extended moves)
- Ranging markets: Moderate (mean reversion component provides edge)
- Low volatility: Reduced (ATR filter prevents most entries)
- Extreme volatility: Protected (maximum volatility filter prevents entries)
Cost Impact: Commission represents approximately 18.5% of gross profit in backtests. The 50-tick slippage assumption is deliberately punitive - typical execution will likely be 5-10x better (2-10 ticks actual vs 50 ticks modeled), meaning real-world net results may significantly exceed backtest performance under normal market conditions.
Execution Quality: 30-minute timeframe provides sufficient time for order placement and management. Automated execution recommended for consistency. Manual execution requires discipline to follow signals without hesitation or second-guessing.
Starting Procedures:
1. Run backtest on your specific asset and timeframe
2. Paper trade for minimum 50 trades or 2 weeks
3. Start with minimum position sizes (0.5-1% risk)
4. Gradually scale to target risk levels as confidence builds
5. Monitor actual execution costs vs backtest assumptions
## Strategy Limitations
- Requires liquid markets; performance degrades significantly on low-volume pairs
- No built-in news event calendar; traders should manually avoid scheduled high-impact events
- Weekend/holiday trading may experience wider spreads and different price behaviour
- Does not model spread costs (assumes mid-price fills); add 1-2 ticks additional cost for market orders
- Performance during market structure changes (regime shifts) may differ from backtest period
- Requires consistent monitoring during active trading hours for optimal automated execution
- Slippage assumptions are deliberately extreme; actual slippage will typically be much lower
## Risk Disclosure
Cryptocurrency trading involves substantial risk of loss. Leverage amplifies both gains and losses. This strategy will experience losing streaks and drawdowns. The 11.53% maximum historical drawdown in bull market testing and 18.54% in bear market testing do not represent ceilings - larger drawdowns are possible and should be expected in live trading.
Past performance does not guarantee future results. Market conditions evolve, and historical edge may diminish or disappear. No strategy works in all market conditions. The strategy has been tested with extremely conservative slippage assumptions (50 ticks per trade) that significantly exceed typical execution costs; this provides a safety margin but does not eliminate risk.
Capital at Risk: Only trade with capital you can afford to lose completely. The strategy's positive historical performance across both bull and bear markets does not eliminate the possibility of significant losses or account impairment.
Not Financial Advice: This strategy is an educational tool, not investment advice. Users are solely responsible for their trading decisions, risk management, and outcomes. The developer assumes no liability for trading losses.
Leverage Warning: Trading with leverage can result in losses exceeding initial investment. Ensure you understand leverage mechanics and liquidation risks before using leveraged products.
## Technical Requirements
- TradingView Premium subscription (for strategy testing and alerts)
- Understanding of risk management principles
- Familiarity with perpetual futures mechanics
- Broker account supporting crypto perpetuals (if trading live)
- For automation: Webhook-compatible execution platform
## Version History
v3.0 - November 2025 (Initial Release)
- Multi-methodology entry system (Momentum, Mean Reversion, VWAP)
- Comprehensive risk management framework
- Adaptive exit system with trailing stops
- Session and volatility filtering
- Webhook automation support
- Validated across bull market (2024-25) and bear market (2022) periods
- Tested with ultra-conservative 50-tick slippage assumptions
Disclaimer: This strategy is provided "as-is" for educational purposes. Past performance does not indicate future results. All backtests conducted with 50-tick slippage (ultra-conservative assumptions). Actual trading costs typically significantly lower. Trade responsibly and at your own risk.

ParabolicSAR+EMA[TS_Indie]🚀 EMA + Parabolic SAR Reversal Trading Strategy
This trading system effectively combines the use of Exponential Moving Averages (EMA) with the Parabolic SAR to identify both price trends and key reversal points. The EMA Fast is used to signal the primary short-term trend, while the EMA Slow acts as a filter for the long-term trend direction. The Parabolic SAR then helps to confirm the reversal signals.
🛠️ Tools Used
1. EMA Fast – Primary Short-Term Trend
2. EMA Slow – Long-Term Trend Filter
3. Parabolic SAR – Reversal Confirmation
🎯 Entry Rules
📈 Buy Setup
1. Trend Filter: EMA Fast > EMA Slow → Uptrend
2. Pullback: Price pulls back and closes below the EMA Fast line.
3. Reversal: Price reverses/pulls back up and closes above the EMA Fast line.
4. SAR Confirmation: The previous Parabolic SAR dot is above the high, and the dot in the current candle is below the low → Reversal signal confirmed.
5. Entry: Enter Buy immediately.
📉 Sell Setup
1. Trend Filter: EMA Fast < EMA Slow → Downtrend
2. Pullback: Price pulls back and closes above the EMA Fast line.
3. Reversal: Price reverses/pulls back down and closes below the EMA Fast line.
4. SAR Confirmation: The previous Parabolic SAR dot is below the low, and the dot in the current candle is above the high → Reversal signal confirmed.
5. Entry: Enter Sell immediately.
💰 Exit Management (Entry, Stop Loss, Take Profit)
1. Entry: Enter the order at the closing price of the signal candle.
2. Stop Loss (SL): Set the Stop Loss at the Parabolic SAR dot.
3. Take Profit (TP): Calculated from the Entry and Stop Loss points, multiplied by the Risk Reward Ratio.
⚙️ Optional Parameters
➭ Custom Risk/Reward Ratio for Take Profit.
➭ Option to add an ATR buffer to the Stop Loss.
➭ Adjustable EMA Fast period.
➭ Adjustable EMA Slow period.
➭ Adjustable Parabolic SAR parameters.
➭ Option to enable Long-only / Short-only positions.
➭ Customizable Backtest start and end date.
➭ Customizable trading session time.
🔔 Alert Function
Alerts display:
➭ Entry Price
➭ Stop Loss Price
➭ Take Profit Price
💡 This strategy allows for many parameter adjustments, such as the MA type, adding/subtracting from the Stop Loss using ATR, and selecting specific sessions for backtesting. If you find interesting or profitable results after adjusting the parameters, please share your comments with other traders!
⚠️ Disclaimer
This indicator is designed for educational and research purposes only. It does not guarantee profits and should not be considered financial advice. Trading in financial markets involves significant risk , including the potential loss of capital.

Moving Average Band StrategyOverview
The Moving Average Band Strategy is a fully customizable breakout and trend-continuation system designed for traders who need both simplicity and control.
The strategy creates adaptive bands around a user-selected moving average and executes trades when price breaks out of these bands, with advanced risk-management settings including optional Risk:Reward targets.
This script is suitable for intraday, swing, and positional traders across all markets — equities, futures, crypto, and forex.
Key Features
✔ Six Moving Average Types
Choose the MA that best matches your trading style:
SMA
EMA
WMA
HMA
VWMA
RMA
✔ Dynamic Bands
Upper Band built from MA of highs
Lower Band built from MA of lows
Adjustable band offset (%)
Color-coded band fill indicating price position
✔ Configurable Strategy Preferences
Toggle Long and/or Short trades
Toggle Risk:Reward Take-Profit
Adjustable Risk:Reward Ratio
Default position sizing: % of equity (configurable via strategy settings)
Entry Conditions
Long Entry
A long trade triggers when:
Price crosses above the Upper Band
Long trades are enabled
No existing long position is active
Short Entry
A short trade triggers when:
Price crosses below the Lower Band
Short trades are enabled
No existing short position is active
Clear entry markers and price labels appear on the chart.
Risk Management
This strategy includes a complete set of risk-controls:
Stop-Loss (Fixed at Entry)
Long SL: Lower Band
Short SL: Upper Band
These levels remain constant for the entire trade.
Optional Risk:Reward Take-Profit
Enabled/disabled using a toggle switch.
When enabled:
Long TP = Entry + (Risk × Risk:Reward Ratio)
Short TP = Entry – (Risk × Risk:Reward Ratio)
When disabled:
Exits are handled by reverse crossover signals.
Exit Conditions
Long Exit
Stop-Loss Hit (touch-based)
Take-Profit Hit (if enabled)
Reverse Band Crossover (if TP disabled)
Short Exit
Stop-Loss Hit (touch-based)
Take-Profit Hit (if enabled)
Reverse Band Crossover (if TP disabled)
Exit markers and price labels are plotted automatically.
Visual Tools
To improve clarity:
Upper & Lower Band (blue, adjustable width)
Middle Line
Dynamic band fill (green/red/yellow)
SL & TP line plotting when in position
Entry/Exit markers
Price labels for all executed trades
These are built to help users visually follow the strategy logic.
Alerts Included
Every trading event is covered:
Long Entry
Short Entry
Long SL / TP / Cross Exit
Short SL / TP / Cross Exit
Combined Alert for webhook/automation (JSON-formatted)
Perfect for algo trading, Discord bots, or automation platforms.
Best For
This strategy performs best in:
Trending markets
Breakout environments
High-momentum instruments
Clean intraday swings
Works seamlessly on:
Stocks
Index futures
Commodities
Crypto
Forex
⚠️ Important Disclaimer
This script is for educational purposes only.
Trading involves risk. Backtest results are not indicative of future performance.
Always validate settings and use proper position sizing.

W%R Pullback+EMA Trend [TS_Indie]🔰 Core Concept of the Strategy
The main idea is “Trend-Following with Momentum Pullback.”
This means trading in the direction of the main trend (defined by EMA) while using Williams %R to identify pullback entries (buying the dip or selling the rally) where momentum returns to the trend direction.
📊 Indicators Used
1. EMA Fast – Defines the short-term trend.
2. EMA Slow – Defines the long-term trend (used as a trend filter).
3. Williams %R
• Overbought zone: above -20
• Oversold zone: below -80
⚙️ Entry Rules
🔹 Buy Setup
1. EMA Fast > EMA Slow → Uptrend condition.
2. Williams %R on the previous candle dropped below -80, and on the current candle, it crosses back above -80 → indicates momentum returning to the upside.
3. Current close is above EMA Fast.
4. Entry Buy at the close of the candle where %R crosses above -80.
🎯 Entry, Stop Loss, and Take Profit
1. Entry : At the candle close where the signal occurs.
2. Stop Loss : At the lowest low between the current and previous candles.
3. Take Profit : Calculated based on entry price and stop loss distance multiplied by the Risk/Reward Ratio.
🔹 Sell Setup
1. EMA Fast < EMA Slow → Downtrend condition.
2. Williams %R on the previous candle went above -20, and on the current candle, it crosses back below -20 → indicates renewed selling momentum.
3. Current price is below EMA Fast.
4. Entry Sell at the close of the candle where %R crosses below -20.
🎯 Entry, Stop Loss, and Take Profit
1. Entry : At the candle close where the signal occurs.
2. Stop Loss : At the highest high between the current and previous candles.
3. Take Profit : Calculated based on entry price and stop loss distance multiplied by the Risk/Reward Ratio.
⚙️ Optional Parameters
• Custom Risk/Reward Ratio for Take Profit.
• Option to add ATR buffer to Stop Loss.
• Adjustable EMA Fast period.
• Adjustable EMA Slow period.
• Adjustable Williams %R period.
• Option to enable Long only / Short only positions.
• Customizable Backtest start and end date.
• Customizable trading session time.
⏰ Alert Function
Alerts display:
• Entry price
• Stop Loss price
• Take Profit price
Guys, try adjusting the parameters yourselves!
I’ve been tweaking the settings for several days and managed to get great results on XAU/USD in the 5-minute timeframe.
I think this strategy is quite interesting and could potentially deliver good results on other instruments as well.
⚠️ Disclaimer
This indicator is designed for educational and research purposes only.
It does not guarantee profits and should not be considered financial advice.
Trading in financial markets involves significant risk, including the potential loss of capital.

Super Frog Power - Cluster Flip %Super Frog Power - Cluster Flip %
🔄 Trade Smarter, Not Harder: Let the Cluster Decide
Welcome to the "Super Frog Power - Cluster Flip %" strategy, a sophisticated multi-system confluence engine designed to filter out market noise and pinpoint high-probability trade setups. This isn't just another indicator; it's a comprehensive trading system that aggregates signals from eight distinct technical methodologies, waiting for them to align into a powerful "cluster" before you enter a trade.
🎯 Core Philosophy: The Power of Confluence
A single indicator can give false signals. A cluster of indicators from uncorrelated systems agreeing on a direction is a much stronger signal. This strategy continuously monitors multiple independent systems and only executes a trade when a significant number of them flip to a consensus, dramatically increasing the likelihood of a successful move.
✨ The 8 Systems of Super Frog Power
This strategy synthesizes signals from the following powerful components:
Bollinger Bands®: Identifies overbought and oversold conditions relative to recent volatility.
CMI (Cluster Momentum Index) System: A unique multi-period momentum oscillator that identifies convergence and breakout moments with custom "Lion" (SELL) and "Car" (BUY) signals.
SMI (Stochastic Momentum Index) System: A refined momentum indicator that generates "Mouse" (BUY) signals and combines with CMI for "Green Angel" and "Red Devil" super signals.
Lucky Balls (NVI/PVI): Utilizes Negative and Positive Volume Index to gauge smart money flow and identify accumulation/distribution zones.
Momentum System: A triple-threat combo of RSI, CCI, and PPO, scaled and combined to generate robust momentum-based entries and exits.
Lucky Table (Oscillator Overload): Counts the number of key oscillators (SMI, RSI, CCI) in overbought or oversold territory, triggering a signal when a threshold is met.
Apples & Pairs System: A complex system analyzing price swings, accumulation, mass index, and doji patterns with fun, emoji-based signals like "Apple Cross Up" 🍎 and "Pig Cross Down" 🐖.
ZBT (Zonal Breakout Trend) System: A multi-timeframe trend-following system using dynamic EMA channels and an ATR-based trailing stop to identify the primary trend and robust breakout points.
⚙️ How It Works: The Cluster Flip Logic
The magic happens in the signal aggregation. The strategy counts every single BUY and SELL signal from all active systems.
A "Strong Buy" is triggered when 6 or more independent BUY signals occur simultaneously.
A "Strong Sell" is triggered when 5 or more independent SELL signals occur simultaneously.
This "cluster flip" mechanism ensures you are only trading when there is broad-based technical agreement, keeping you out of choppy and uncertain market conditions.
🛡️ Integrated Risk Management
We believe a strategy is nothing without proper risk management. This system comes with built-in, percentage-based order management:
User-Defined Profit Target (%): Lock in profits automatically at your specified percentage gain.
User-Defined Stop Loss (%): Protect your capital with a hard stop loss.
Position Sizing: Control your risk per trade with a customizable position size.
Trades are also managed logically: a new strong signal in the opposite direction will automatically close any existing position, ensuring you're always on the right side of the cluster's consensus.
🎨 Visual Features & Customization
Fully Customizable: Don't like one system? Turn it off! Every system can be toggled on/off from the inputs.
Clear Visuals: Each system is plotted in a distinct color, making the chart a rich source of information without being cluttered.
Signal Markers: Strong Buy and Strong Sell clusters are clearly marked with large circles below and above the bars.
Alert Ready: Built-in alerts for Strong Buy and Strong Sell signals so you never miss a cluster setup.
🚀 How to Use
Add the script to your chart (1H, 4H, or Daily timeframes are recommended for swing trading).
Adjust the inputs to your liking, especially the Profit Target %, Stop Loss %, and Position Size under the "Strategy Parameters" section.
Observe the clusters. Wait for the "Strong Buy" or "Strong Sell" circle to appear.
Enter the trade. The strategy will automatically plot the profit target and stop loss levels on the chart for your reference.
Manage your trade. Let the logic handle the exits, or use your own discretion.
💡 Ideal For
Swing Traders looking for high-confidence set-and-forget setups.
Technical Analysts who appreciate the depth of multi-system confluence.
Traders who want to avoid the paralysis of analyzing too many indicators separately.
Unleash the power of cluster trading. Add the "Super Frog Power - Cluster Flip %" to your chart today!

v2.0—Tristan's Multi-Indicator Reversal Strategy🎯 Multi-Indicator Reversal Strategy - Optimized for High Win Rates
A powerful confluence-based strategy that combines RSI, MACD, Williams %R, Bollinger Bands, and Volume analysis to identify high-probability reversal points . Designed to let winners run with no stop loss or take profit - positions close only when opposite signals occur.
Also, the 3 hour timeframe works VERY well—just a lot less trades.
📈 Proven Performance
This strategy has been backtested and optimized on multiple blue-chip stocks with 80-90%+ win rates on 1-hour timeframes from Aug 2025 through Oct 2025:
✅ V (Visa) - Payment processor
✅ MSFT (Microsoft) - Large-cap tech
✅ WMT (Walmart) - Retail leader
✅ IWM (Russell 2000 ETF) - Small-cap index
✅ NOW (ServiceNow) - Enterprise software
✅ WM (Waste Management) - Industrial services
These stocks tend to mean-revert at extremes, making them ideal candidates for this reversal-based approach. I only list these as a way to show you the performance of the script. These values and stock choices may change over time as the market shifts. Keep testing!
🔑 How to Use This Strategy Successfully
Step 1: Apply to Chart
Open your desired stock (V, MSFT, WMT, IWM, NOW, WM recommended)
Set timeframe to 1 Hour
Apply this strategy
Check that the Williams %R is set to -20 and -80, and "Flip All Signals" is OFF (can flip this for some stocks to perform better.)
Step 2: Understand the Signals
🟢 Green Triangle (BUY) Below Candle:
Multiple indicators (RSI, Williams %R, MACD, Bollinger Bands) show oversold conditions
Enter LONG position
Strategy will pyramid up to 10 entries if more buy signals occur
Hold until red triangle appears
🔴 Red Triangle (SELL) Above Candle:
Multiple indicators show overbought conditions
Enter SHORT position (or close existing long)
Strategy will pyramid up to 10 entries if more sell signals occur
Hold until green triangle appears
🟣 Purple Labels (EXIT):
Shows when positions close
Displays count if multiple entries were pyramided (e.g., "Exit Long x5")
Step 3: Let the Strategy Work
Key Success Principles:
✅ Be Patient - Signals don't occur every day, wait for quality setups
✅ Trust the Process - Don't manually close positions, let opposite signals exit
✅ Watch Pyramiding - The strategy can add up to 10 positions in the same direction
✅ No Stop Loss - Positions ride through drawdowns until reversal confirmed
✅ Session Filter - Only trades during NY session (9:30 AM - 4:00 PM ET)
⚙️ Winning Settings (Already Set as Defaults)
INDICATOR SETTINGS:
- RSI Length: 14
- RSI Overbought: 70
- RSI Oversold: 30
- MACD: 12, 26, 9 (standard)
- Williams %R Length: 14
- Williams %R Overbought: -20 ⭐ (check this! And adjust to your liking)
- Williams %R Oversold: -80 ⭐ (check this! And adjust to your liking)
- Bollinger Bands: 20, 2.0
- Volume MA: 20 periods
- Volume Multiplier: 1.5x
SIGNAL REQUIREMENTS:
- Min Indicators Aligned: 2
- Require Divergence: OFF
- Require Volume Spike: OFF
- Require Reversal Candle: OFF
- Flip All Signals: OFF ⭐
RISK MANAGEMENT:
- Use Stop Loss: OFF ⭐⭐⭐
- Use Take Profit: OFF ⭐⭐⭐
- Allow Pyramiding: ON ⭐⭐⭐
- Max Pyramid Entries: 10 ⭐⭐⭐
SESSION FILTER:
- Trade Only NY Session: ON
- NY Session: 9:30 AM - 4:00 PM ET
**⭐ = Critical settings for success**
## 🎓 Strategy Logic Explained
### **How It Works:**
1. **Multi-Indicator Confluence**: Waits for at least 2 out of 4 technical indicators to align before generating signals
2. **Oversold = Buy**: When RSI < 30, Williams %R < -80, price below lower Bollinger Band, and/or MACD turning bullish → BUY signal
3. **Overbought = Sell**: When RSI > 70, Williams %R > -20, price above upper Bollinger Band, and/or MACD turning bearish → SELL signal
4. **Pyramiding Power**: As trend continues and more signals fire in the same direction, adds up to 10 positions to maximize gains
5. **Exit Only on Reversal**: No arbitrary stops or targets - only exits when opposite signal confirms trend change
6. **Session Filter**: Only trades during liquid NY session hours to avoid overnight gaps and low-volume periods
### **Why No Stop Loss Works:**
Traditional reversal strategies fail because they:
- Get stopped out too early during normal volatility
- Miss the actual reversal that happens later
- Cut winners short with tight take profits
This strategy succeeds because it:
- ✅ Rides through temporary noise
- ✅ Captures full reversal moves
- ✅ Uses multiple indicators for confirmation
- ✅ Pyramids into winning positions
- ✅ Only exits when technical picture completely reverses
---
## 📊 Understanding the Display
**Live Indicator Counter (Top Corner / end of current candles):**
Bull: 2/4
Bear: 0/4
(STANDARD)
Shows how many indicators currently align bullish/bearish
"STANDARD" = normal reversal mode (buy oversold, sell overbought)
"FLIPPED" = momentum mode if you toggle that setting
Visual Indicators:
🔵 Blue background = NY session active (trading window)
🟡 Yellow candle tint = Volume spike detected
💎 Aqua diamond = Bullish divergence (price vs RSI)
💎 Fuchsia diamond = Bearish divergence
⚡ Advanced Tips
Optimizing for Different Stocks:
If Win Rate is Low (<50%):
Try toggling "Flip All Signals" to ON (switches to momentum mode)
Increase "Min Indicators Aligned" to 3 or 4
Turn ON "Require Divergence"
Test on different timeframe (4-hour or daily)
If Too Few Signals:
Decrease "Min Indicators Aligned" to 2
Turn OFF all requirement filters
Widen Williams %R bands to -15 and -85
If Too Many False Signals:
Increase "Min Indicators Aligned" to 3 or 4
Turn ON "Require Divergence"
Turn ON "Require Volume Spike"
Reduce Max Pyramid Entries to 5
Stock Selection Guidelines:
Best Suited For:
Large-cap stable stocks (V, MSFT, WMT)
ETFs (IWM, SPY, QQQ)
Stocks with clear support/resistance
Mean-reverting instruments
Avoid:
Ultra low-volume penny stocks
Extremely volatile crypto (try traditional settings first)
Stocks in strong one-directional trends lasting months
🔄 The "Flip All Signals" Feature
If backtesting shows poor results on a particular stock, try toggling "Flip All Signals" to ON:
STANDARD Mode (OFF):
Buy when oversold (reversal strategy)
Sell when overbought
May work best for: V, MSFT, WMT, IWM, NOW, WM
FLIPPED Mode (ON):
Buy when overbought (momentum strategy)
Sell when oversold
May work best for: Strong trending stocks, momentum plays, crypto
Test both modes on your stock to see which performs better!
📱 Alert Setup
Create alerts to notify you of signals:
📊 Performance Expectations
With optimized settings on recommended stocks:
Typical results we are looking for:
Win Rate: 70-90%
Average Winner: 3-5%
Average Loser: 1-3%
Signals Per Week: 1-3 on 1-hour timeframe
Hold Time: Several hours to days
Remember: Past performance doesn't guarantee future results. Always use proper risk management.

AMF PG Strategy v2.3AMF PG Strategy v2.3
1. Core Philosophy: Filtered and Volatility-Aware Trend Following
"AMF PG Strategy" is an advanced trend-following system designed to adapt to the dynamic nature of modern markets. The strategy's core philosophy is not just to follow the trend but also to wait for the right conditions to enter the market.
This is not a "black box." It is a rules-based framework that gives the user full control over various market filters. By requiring multiple conditions to be met simultaneously, the strategy aims to filter out low-quality signals and focus only on high-probability trend opportunities.
2. Core Engine: AMF PG Trend Following
At the heart of the strategy is a proprietary, volatility-aware trend-following mechanism called AMF PG (Praetorian Guard). This engine operates as follows:
Dynamic Bands: Creates a dynamic upper and lower band around the price that is constantly recalculated. The width of these bands is not fixed; It dynamically adjusts based on recent market volatility, volume flow, and price expansion. This adaptive structure allows the strategy to adapt to both calm and high-volatility markets.
Entry Signals: A buy signal is triggered when the price rises above the upper band. A sell signal is triggered when the price falls below the lower band. However, these signals are executed only when all the active filters described below give the green light.
Trailing Stop-Loss: When a position is entered, the opposite band automatically acts as a trailing stop-loss level. For example, when a buy position is opened, the lower band follows the price as a stop-loss. This allows for profit retention and trend continuation.
3. Multi-Layered Filter System: Understanding the Market
The power of this strategy comes from its modular filter system, which allows the user to filter market conditions based on their own analysis. Each filter can be enabled or disabled individually in the settings:
Filter 1: Trend Strength (ADX Filter): This filter confirms whether there is a strong trend in the market. It uses the ADX (Average Directional Index) indicator and only allows trades if the ADX value is above a certain threshold. This helps avoid trading in weak or directionless markets. It also confirms the direction of the trend by checking the position of the DMI (+DI and -DI) lines.
Filter 2: Sideways Market (Chop Index Filter): This filter determines whether the market is excessively choppy or directionless. Using the Chop Index, this filter aims to protect against fakeouts by blocking trades when the market is highly indecisive.
Filter 3: Market Structure (Hurst Exponent Filter): This is one of the strategy's most advanced filters. It analyzes the current market behavior using the Hurst Exponent. This mathematical tool attempts to determine whether a market tends to trend (permanent), tends to revert to the mean (anti-permanent), or moves randomly. This filter ensures that signals are generated only when market structure supports trending trades.
4. Risk Management: Maximum Drawdown Protection
This strategy includes a built-in capital protection mechanism. Users can specify the percentage of their capital they will tolerate to decline from its peak. If the strategy's capital reaches this set drawdown limit, the protection feature is activated, closing all open positions and preventing new trades from being opened. This acts as an emergency brake to protect capital against unexpected market conditions.
5. Automation Ready: Customizable Webhook Alerts
The strategy is designed for traders who want to automate their signals. From the Settings menu, you can configure custom alert messages in JSON format, compatible with third-party automation services (via Webhooks).
6. Strategy Backtest Information
Please note that past performance is not indicative of future results. The published chart and performance report were generated on the 4-hour timeframe of the BTCUSD pair with the following settings:
Test Period: January 1, 2016 - October 31, 2025
Default Position Size: 15% of Capital
Pyramiding: Closed
Commission: 0.0008
Slippage: 2 ticks (Please enter the slippage you used in your own tests)
Testing Approach: The published test includes 423 trades and is statistically significant. It is strongly recommended that you test on different assets and timeframes for your own analysis. The default settings are a template and should be adjusted by the user for their own analysis.

USDJPY MA Zone Entry Strategy USD/JPY tested only.A consistent strategy that gives me alerts each time my conditions are met. I am a funded prop firm trader. this strategy gives 45-70% annual returns. the sequence for this strategy is: After 4 stop loss hits, place a trade on the NEXT ENTRY ALERT ONCE: (-.188) pips draw back towards the stop loss. (this turns the Strat from 1-3 RISK/REWARD to 1-7+ RISK/REWARD). keep the Stop Loss the same (-.300) away from your entry. Take Profit placed at (+1.488) from entry. if 3 losses in a row happens AFTER you've followed these instructions, don't trade again UNTIL the strategy has a TAKE PROFIT gain, then the sequence starts over again. that is this strategies losing streak. after that streak is over. the strategy will be back to give you profits.

Diabolos Long What the strategy tries to do
It looks for RSI dips into oversold, then waits for RSI to recover above a chosen level before placing a limit buy slightly below the current price. If the limit doesn’t fill within a few bars, it cancels it. Once in a trade, it sets a fixed take-profit and stop-loss. It can pyramid up to 3 entries.
Step-by-step
1) Inputs you control
RSI Length (rsiLen), Oversold level (rsiOS), and a re-entry threshold (rsiEntryLevel) you want RSI to reach after oversold.
Entry offset % (entryOffset): how far below the current close to place your limit buy.
Cancel after N bars (cancelAfterBars): if still not filled after this many bars, the limit order is canceled.
Risk & compounding knobs: initialRisk (% of equity for first order), compoundRate (% to artificially grow the equity base after each signal), plus fixed TP% and SL%.
2) RSI logic (arming the setup)
It calculates rsi = ta.rsi(close, rsiLen).
If RSI falls below rsiOS, it sets a flag inOversold := true (this “arms” the next potential long).
A long signal (longCondition) happens only when:
inOversold is true (we were oversold),
RSI comes back above rsiOS,
and RSI is at least rsiEntryLevel.
So: dip into OS → recover above OS and to your threshold → signal fires.
3) Placing the entry order
When longCondition is true:
It computes a limit price: close * (1 - entryOffset/100) (i.e., below the current bar’s close).
It sizes the order as positionRisk / close, where:
positionRisk starts as accountEquity * (initialRisk/100).
accountEquity was set once at script start to strategy.equity.
It places a limit long: strategy.order("Long Entry", strategy.long, qty=..., limit=limitPrice).
It then resets inOversold := false (disarms until RSI goes oversold again).
It remembers the bar index (orderBarIndex := bar_index) so it can cancel later if unfilled.
Important nuance about “compounding” here
After signaling, it does:
compoundedEquity := compoundedEquity * (1 + compoundRate/100)
positionRisk := compoundedEquity * (initialRisk/100)
This means your future order sizes grow by a fixed compound rate every time a signal occurs, regardless of whether previous trades won or lost. It’s not tied to actual PnL; it’s an artificial growth curve. Also, accountEquity was captured only once at start, so it doesn’t automatically track live equity changes.
4) Auto-cancel the limit if it doesn’t fill
On each bar, if bar_index - orderBarIndex >= cancelAfterBars, it does strategy.cancel("Long Entry") and clears orderBarIndex.
If the order already filled, cancel does nothing (there’s nothing pending with that id).
Behavioral consequence: Because you set inOversold := false at signal time (not on fill), if a limit order never fills and later gets canceled, the strategy will not fire a new entry until RSI goes below oversold again to re-arm.
5) Managing the open position
If strategy.position_size > 0, it reads the avg entry price, then sets:
takeProfitPrice = avgEntryPrice * (1 + exitGainPercentage/100)
stopLossPrice = avgEntryPrice * (1 - stopLossPercentage/100)
It places a combined exit:
strategy.exit("TP / SL", from_entry="Long Entry", limit=takeProfitPrice, stop=stopLossPrice)
With pyramiding=3, multiple fills can stack into one net long position. Using the same from_entry id ties the TP/SL to that logical entry group (not per-layer). That’s OK in TradingView (it will manage TP/SL for the position), but you don’t get per-layer TP/SL.
6) Visuals & alerts
It plots a green triangle under the bar when the long signal condition occurs.
It exposes an alert you can hook to: “Покупка при достижении уровня”.
A quick example timeline
RSI drops below rsiOS → inOversold = true (armed).
RSI rises back above rsiOS and reaches rsiEntryLevel → signal.
Strategy places a limit buy a bit below current price.
4a) If price dips to fill within cancelAfterBars, you’re long. TP/SL are set as fixed % from avg entry.
4b) If price doesn’t dip enough, after N bars the limit is canceled. The system won’t re-try until RSI becomes oversold again.
Key quirks to be aware of
Risk sizing isn’t PnL-aware. accountEquity is frozen at start, and compoundedEquity grows on every signal, not on wins. So size doesn’t reflect real equity changes unless you rewrite it to use strategy.equity each time and (optionally) size by stop distance.
Disarm on signal, not on fill. If a limit order goes stale and is canceled, the system won’t try again unless RSI re-enters oversold. That’s intentional but can reduce fills.
Single TP/SL id for pyramiding. Works, but you can’t manage each add-on with different exits.

Ramen & OJ V1Ramen & OJ V1 — Strategy Overview
Ramen & OJ V1 is a mechanical price-action system built around two entry archetypes—Engulfing and Momentum—with trend gates, session controls, risk rails, and optional interval take-profits. It’s designed to behave the same way you’d trade it manually: wait for a qualified impulse, enter with discipline (optionally on a measured retracement), and manage the position with clear, rules-based exits.
Core Idea (What the engine does)
At its heart, the strategy looks for a decisive candle, then trades in alignment with your defined trend gates and flattens when that bias is no longer valid.
Entry Candle Type
Engulfing: The body of the current candle swallows the prior candle’s body (classic momentum shift).
Momentum: A simple directional body (close > open for longs, close < open for shorts).
Body Filter (lookback): Optional guard that requires the current body to be at least as large as the max body from the last N bars. This keeps you from chasing weak signals.
Primary MA (Entry/Exit Role):
Gate (optional): Require price to be above the Primary MA for longs / below for shorts.
Exit (always): Base exit occurs when price closes back across the Primary MA against your position.
Longs: qualifying bullish candle + pass all enabled filters.
Shorts: mirror logic.
Entries (Impulse vs. Pullback)
You choose how aggressive to be:
Market/Bars-Close Entry: Fire on the bar that confirms the signal (respecting filters and sessions).
Retracement Entry (optional): Instead of chasing the close, place a limit around a configurable % of the signal candle’s range (e.g., 50%). This buys the dip/sells the pop with structure, often improving average entry and risk.
Flip logic is handled: when an opposite, fully-qualified signal appears while in a position, the strategy closes first and then opens the new direction per rules.
Exits & Trade Management
Primary Exit: Price closing back across the Primary MA against your position.
Interval Take-Profit (optional):
Pre-Placed (native): Automatically lays out laddered limit targets every X ticks with OCO behavior. Each rung can carry its own stop (per-rung risk). Clean, broker-like behavior in backtests.
Manual (legacy): Closes slices as price steps through the ladder levels intrabar. Useful for platforms/brokers that need incremental closes rather than bracketed OCOs.
Per-Trade Stop: Choose ticks or dollars, and whether the $ stop is per position or per contract. When pre-placed TP is on, each rung uses a coordinated OCO stop; otherwise a single hard stop is attached.
Risk Rails (Session P&L Controls)
Session Soft Lock: When a session profit target or loss limit is hit, the strategy stops taking new trades but does not force-close open positions.
Session Hard Lock: On reaching your session P&L limit, all orders are canceled and the strategy flattens immediately. No new orders until the next session.
These rails help keep good days good and bad days survivable.
Filters & How They Work Together
1) Trend & Bias
Primary MA Gate (optional): Only long above / only short below. This keeps signals aligned with your primary bias.
Primary MA Slope Filter (optional): Require a minimum up/down slope (in degrees over a defined bar span). It’s a simple way to force impulse alignment—green light only when the MA is actually moving up for longs (or down for shorts).
Secondary MA Filter (optional): An additional trend gate (SMA/EMA, often a 200). Price must be on the correct side of this higher-timeframe proxy to trade. Great for avoiding countertrend picks.
How to combine:
Use Secondary MA as the “big picture” bias, Primary MA gate as your local regime check, and Slope to ensure momentum in that regime. That three-layer stack cuts a lot of chop.
2) Volatility/Exhaustion
CCI Dead Zone Filter (optional): Trades only when CCI is inside a specified band (default ±200). This avoids entries when price is extremely stretched; think of it as a no-chase rule.
TTM Squeeze Filter (optional): When enabled, the strategy avoids entries during a squeeze (Bollinger Bands inside Keltner Channels). You’re effectively waiting for the release, not the compression itself. This plays nicely with momentum entries and the slope gate.
How to combine:
If you want only the clean breaks, enable Slope + Squeeze; if you want structure but fewer chases, add CCI Dead Zone. You’ll filter out a lot of low-quality “wiggle” trades.
3) Time & Market Calendar
Sessions: Up to two session windows (America/Chicago by default), with background highlights.
Good-Till-Close (GTC): When ON, trades can close outside the session window; when OFF, all positions are flattened at session end and pending orders canceled.
Market-Day Filters: Skip US listed holidays and known non-full Globex days (e.g., Black Friday, certain eves). Cleaner logs and fewer backtest artifacts.
How to combine:
Run your A-setup window (e.g., cash open hour) with GTC ON if you want exits to obey system rules even after the window, or GTC OFF if you want the book flat at the bell, no exceptions.
Practical Profiles (mix-and-match presets)
Trend Rider: Primary MA gate ON, Slope filter ON, Secondary MA ON, Retracement ON (50%).
Goal: Only take momentum that’s already moving, buy the dip/sell the pop back into trend.
Structure-First Pullback: Primary MA gate ON, Secondary MA ON, CCI Dead Zone ON, Retracement 38–62%.
Goal: Filter extremes, use measured pullbacks for better R:R.
Break-Only Mode: Slope ON + Squeeze filter ON (avoid compression), Body filter ON with short lookback.
Goal: Only catch clean post-compression impulses.
Session Scalper: Tight session window, GTC OFF, Interval TP ON (small slices, short rungs), per-trade tick stop.
Goal: Quick hits in a well-defined window, always flat after.
Automation Notes
The system is built with intrabar awareness (calc_on_every_tick=true) and supports bracket-style behavior via pre-placed interval TP rungs. For webhook automation (e.g., TradersPost), keep chart(s) open and ensure alerts are tied to your order events or signal conditions as implemented in your alert templates. Always validate live routing with a small-size shakedown before scaling.
Tips, Caveats & Good Hygiene
Intrabar vs. Close: Backtests can fill intrabar where your broker might not. The pre-placed mode helps emulate OCO behavior but still depends on feed granularity.
Slippage & Fees: Set realistic slippage/commission in Strategy Properties to avoid fantasy equity curves.
Session Consistency: Use the correct timezone and verify that your broker’s session aligns with your chart session settings.
Don’t Over-stack Filters: More filters ≠ better performance. Start with trend gates, then add one volatility filter if needed.
Disclosure
This script is for educational purposes only and is not financial advice. Markets carry risk; only trade capital you can afford to lose. Test thoroughly on replay and paper before using any automated routing.
TL;DR
Identify a decisive candle → pass trend/vol filters → (optionally) pull back to a measured limit → scale out on pre-planned rungs → exit on Primary MA break or session rule. Clear, mechanical, repeatable.
