AI ALGO SETUP by A+AI ALGO SETUP by A+. This Setup helps the Intraday Trader have an Edge in the MarketPine Script® Indikatorvon Arpitjain-forex4
AI Candlestick Pattern Identifier — Arrows & AlertsAI shows you high confidence candlestick patterns so that you can identify them quickly. Buy/Sell arrows will be placed alongside the pattern to alert you of which direction the indicator believes the market will go, as well as showing you the confidence in that indicator.Pine Script® Indikatorvon SaaETH43
AI MEDEA FORECASTAI MEDEA searches for similar historical patterns and uses them to generate predictions. The longer it runs, the more data it gathers and the better the predictions become. Important: The indicator must remain enabled to: - Collect predictions and check their accuracy - Have as much data as possible for comparison - Provide more accurate results Recommendation: Let the indicator run for several days on different timeframes (15m, 30m, 1H, 4H). The accuracy table will show the actual accuracy only after gathering enough predictions.Pine Script® Indikatorvon kameniczkifxAktualisiert 34
AI - Gaussian Channel Strategy AI – Gaussian Channel Strategy is a long-only swing trading strategy designed for Bitcoin and other assets on daily charts. It combines an adaptive Gaussian Channel with Supertrend and Stochastic RSI filters to identify potential bullish breakouts or pullback entries. The channel defines trend direction and volatility, while the Stochastic RSI provides momentum confirmation. Positions are opened only when the price closes above the channel’s upper band under favorable momentum conditions, and are closed when the price crosses back below the band. This script is intended for educational and research purposes. Parameters such as poles, period length, ATR factor, and RSI settings can be adjusted to fit different markets and timeframes. Disclaimer: This script does not guarantee profits and should not be considered financial advice. Past performance is not indicative of future results. Trading involves risk, and you are solely responsible for your own decisions and outcomes.Pine Script® Strategievon infotrader141443
AI - Williams Alligator Strategy (ATR Stop-Loss) AlertsAI - Williams Alligator Strategy (ATR Stop-Loss) with AlertsPine Script® Strategievon pjvf9z2myw92
AI Volume StrategyAI Volume Strategy detects significant volume spikes and combines them with trend direction and candlestick color to generate buy and sell signals. The strategy uses an Exponential Moving Average (EMA) of volume to identify abnormal volume spikes that may indicate strong market activity. Additionally, it uses a 50-period EMA of price to filter the trend and decide on entry direction. Key Features: Volume Spike Detection: The strategy detects when the current volume exceeds the EMA of volume by a user-defined multiplier, signaling abnormal increases in market activity. Trend Direction Filter: The strategy uses a 50-period EMA of price to determine the market trend. Buy signals are generated when the price is above the EMA (uptrend), and sell signals are generated when the price is below the EMA (downtrend). Candle Color Filter: The strategy generates a buy signal only when the current candle is bullish (green) and a sell signal only when the current candle is bearish (red). Exit after X Bars: The strategy automatically closes the position after a specified number of bars (default is 5 bars), but the exit condition can be adjusted based on user preference, timeframe, and backtesting results. The default exit is after 5 bars, but users can set it to 1 bar or any other number depending on their preferences and strategy. Signals: Buy Signal: Generated when a volume spike occurs, the trend is upward, and the current candle is bullish. Sell Signal: Generated when a volume spike occurs, the trend is downward, and the current candle is bearish. Alerts: Buy Alert: Alerts the user when a buy signal is triggered. Sell Alert: Alerts the user when a sell signal is triggered. Visualization: Buy Signal: A green label appears below the bar when the buy conditions are met. Sell Signal: A red label appears above the bar when the sell conditions are met. Volume EMA: Optionally, the Volume EMA line can be plotted on the chart to visualize volume trends. This strategy helps traders identify potential entry points based on increased volume activity while considering trend direction and candlestick patterns. With the ability to adjust the exit condition, users can fine-tune the strategy to their specific needs and backtest results.Pine Script® Strategievon szymonsobkowiak22125
AI Scalping Signals# 🤖 AI-Powered Scalping Indicator - Ultra-Fast Trading Signals ## Overview This advanced AI-driven **scalping indicator** is specifically engineered for high-frequency traders operating on smaller timeframes. Designed exclusively for **1-minute, 3-minute, and 5-minute charts**, this system combines multiple sophisticated technical analysis methods to identify rapid-fire, high-probability trade entries and exits. The AI algorithms analyze market momentum, micro-trend strength, and instant price dynamics in real-time, delivering lightning-fast BUY and SELL signals perfect for scalping strategies. ## Key Features ### ✨ AI-Enhanced Scalping Signal Generation - **Machine Learning Integration**: Proprietary AI algorithms process multiple technical indicators simultaneously with millisecond precision to catch quick market moves - **Smart Cross-Validation**: The AI system validates signals across multiple micro-conditions before generating alerts, perfect for fast-paced scalping - **Adaptive Micro-Trend Analysis**: Intelligent momentum and trend detection optimized specifically for 1M, 3M, and 5M timeframes - **Low-Latency Processing**: Designed for speed—signals generate instantly when conditions align for rapid trade execution ### 📊 Clean Visual Interface for Fast Trading - **Crystal Clear Signals**: Easy-to-read BUY (green) and SELL (red) labels appear directly on your chart—no delay, no confusion - **Background Confirmation**: Subtle background highlighting provides additional visual confirmation of scalping signals - **No Chart Clutter**: The indicator focuses on signals only—no unnecessary lines or plots to distract from rapid price action and quick decision-making - **Optimized for Speed**: Minimalist design allows you to spot and execute trades in seconds ### 🔔 Comprehensive Alert System for Scalpers - **Real-Time Notifications**: Get instantly notified when AI-confirmed BUY or SELL signals are generated—critical for scalping success - **Multi-Alert Options**: Separate alerts for buy signals, sell signals, or combined alerts for any scalping opportunity - **Never Miss a Quick Move**: Set up alerts and let the AI monitor rapid market movements 24/7 - **Mobile-Friendly**: Receive alerts on your phone for on-the-go scalping ## How It Works The indicator employs a sophisticated multi-layer analysis system optimized for scalping: 1. **Micro-Trend Analysis Layer**: AI algorithms analyze rapid trend shifts using advanced moving average techniques calibrated for small timeframes 2. **Momentum Spike Detection**: Smart momentum oscillators identify instant overbought and oversold conditions with scalping-level precision 3. **Price Action Validation**: Proprietary price cross-detection ensures signals align with actual market microstructure movements 4. **AI Flash Confirmation**: All conditions are processed through ultra-fast AI validation logic for immediate signal generation ### Signal Conditions **🟢 BUY Signal (Long Scalp Entry)** Generated when the AI system confirms: - Bullish micro-trend alignment detected - Price momentum shows instant strength above key thresholds - AI-validated upward price breakout occurs on small timeframe - Multiple technical confirmations align simultaneously for quick profit potential **🔴 SELL Signal (Short Scalp Entry)** Generated when the AI system confirms: - Bearish micro-trend alignment detected - Price momentum shows instant weakness below key thresholds - AI-validated downward price breakdown occurs on small timeframe - Multiple technical confirmations align simultaneously for quick profit potential ## Best Practices for Scalping ### Recommended Usage - **⚡ Optimal Timeframes**: Specifically calibrated for **1-minute, 3-minute, and 5-minute charts** for maximum scalping performance - **Markets**: Highly effective on forex pairs (especially majors), crypto (BTC, ETH), and high-liquidity stocks and indices - **Session Focus**: Best results during high-volume trading sessions (London/NY overlap for forex, market open for stocks) - **Quick Execution**: This is a scalping tool—execute trades immediately when signals appear - **Risk Management**: Use tight stop-losses (5-15 pips for forex) and quick take-profits; scalping requires strict risk control ### Scalping Strategy Tips - Execute trades instantly—scalping requires fast action within seconds of signal generation - Use 1:1 or 1:2 risk-reward ratios for consistent scalping profits - Monitor spreads and commissions—they matter significantly for scalpers - Trade during high liquidity hours to ensure tight spreads and quick fills - Consider trading multiple signals per session for accumulated gains - Set mobile alerts to catch quick opportunities throughout the day - Close positions quickly—don't let scalps turn into swing trades - The background color change provides a split-second early warning system ## What Makes This Scalping Indicator Different? Unlike traditional indicators designed for longer timeframes, this AI-powered scalping tool: - ✅ **Built Exclusively for Scalping**: Optimized specifically for 1M, 3M, and 5M timeframes—not a generic indicator - ✅ Combines multiple technical analysis methods with millisecond-precision AI processing - ✅ Uses artificial intelligence to filter noise and validate only the fastest, cleanest scalping signals - ✅ Eliminates the need to manually analyze multiple indicators during rapid market moves - ✅ Provides clear, actionable signals with no interpretation required—critical for scalping speed - ✅ Reduces false signals through multi-condition validation tuned for small timeframes - ✅ Adapts to rapid volatility changes and micro-trend shifts in real-time - ✅ Zero lag—signals appear instantly when conditions align for immediate execution ## Important Disclaimers ⚠️ **Scalping Risk Warning**: Scalping involves extremely high frequency trading with substantial risk of loss. This indicator is a tool to assist with fast-paced analysis and should not be the sole basis for trading decisions. Scalping requires experience, discipline, and proper risk management. ⚠️ **No Guarantee**: Past performance and backtested results do not guarantee future performance. No indicator is 100% accurate, especially in volatile scalping conditions. ⚠️ **Due Diligence**: Always conduct your own research and analysis. Use proper risk management with every single trade. Never risk more than 1-2% of your account per scalp trade. ⚠️ **Transaction Costs**: Be aware that scalping involves frequent trading, which means higher commission and spread costs. Ensure your broker offers competitive pricing for high-frequency trading. ⚠️ **Educational Tool**: This indicator is designed as an educational and analytical tool for experienced traders. Users are solely responsible for their own trading decisions. ## Settings & Customization This is a **protected scalping indicator** with optimized parameters locked specifically for 1-minute, 3-minute, and 5-minute chart performance. The AI algorithms have been fine-tuned through extensive backtesting and live scalping optimization. No manual adjustments are needed—simply add to your small timeframe chart and start receiving rapid-fire signals. ## Support & Updates This indicator receives regular updates to enhance AI algorithms and improve signal accuracy. For questions or support, please contact the publisher. --- **Ready to dominate the scalping game with AI-powered lightning-fast signals?** Add this indicator to your 1M, 3M, or 5M chart and experience the difference of intelligent, validated scalping signals designed for rapid-fire trading. *Remember: Scalping success requires lightning-fast execution, strict discipline, proper risk management, and continuous practice. Use this tool as part of a comprehensive scalping strategy with tight stop-losses and realistic profit targets.*Pine Script® Indikatorvon Awesome_Trader_666Aktualisiert 6661
AI Academy: Volume k-NN [PhenLabs]📊 AI Academy: Volume k-NN Version: PineScript™ v6 ━━━━━━━━━━━━━━━━━━━━━━━━━━━━━━━━━━ ━━━━━━━━━━━━━━━━━━━━━━━━━━━━━━━━━━ 📌 Description AI Academy: Volume k-NN (Theory Edition) is an educational indicator designed to demystify how artificial intelligence pattern recognition works directly on your TradingView charts. Rather than being a black-box signal generator, this tool visualizes the entire k-Nearest Neighbors algorithm process in real-time, showing you exactly how AI identifies similar historical patterns and generates predictions. The indicator scans up to 2,000 historical bars to find patterns that match your current price action, then uses an ensemble of the closest matches to project potential future movement. What sets this apart is the integrated “AI Grimoire”—an interactive educational book overlay that teaches core machine learning concepts through four illuminating chapters. Whether you’re a trader curious about AI methodology or a developer learning algorithmic concepts, this indicator transforms abstract machine learning theory into tangible, visual understanding. ━━━━━━━━━━━━━━━━━━━━━━━━━━━━━━━━━━ ━━━━━━━━━━━━━━━━━━━━━━━━━━━━━━━━━━ 🚀 Points of Innovation • First TradingView indicator to visualize k-NN algorithm execution in real-time with full transparency • Interactive “AI Grimoire” educational overlay teaches machine learning concepts while you trade • Dual-mode pattern matching combines price action with optional volume confirmation • Confidence-based opacity system visually communicates prediction reliability • Historical match visualization shows exactly which past patterns informed the prediction • Ghost bar projections display averaged ensemble predictions with adjustable forecast horizons ━━━━━━━━━━━━━━━━━━━━━━━━━━━━━━━━━━ 🔧 Core Components • Pattern Capture Engine: Converts recent price action into logarithmic returns for normalized comparison across different price levels • k-NN Search Algorithm: Calculates Euclidean distance between current pattern and historical patterns to find closest matches • Volume Weighting System: Optional feature that incorporates volume patterns into distance calculations with adjustable influence • Ensemble Predictor: Averages future returns from k-nearest historical matches to generate consensus forecast • Confidence Calculator: Measures average distance of top matches to determine prediction reliability on 0-100% scale • AI Grimoire Display: Table-based educational overlay rendering book-style content with chapter navigation ━━━━━━━━━━━━━━━━━━━━━━━━━━━━━━━━━━ 🔥 Key Features • Adjustable Pattern Length: Define how many bars constitute the current pattern for matching (5-100 bars) • Configurable Search Depth: Control how far back the algorithm searches for historical matches (500-4,900 bars) • Flexible k-Neighbors: Select how many closest matches inform the prediction (1-20 neighbors) • Volume Toggle: Enable or disable volume pattern matching for different market conditions • Volume Influence Slider: Fine-tune the weight given to volume vs. price patterns (0-100%) • Ghost Bar Count: Adjust how many future bars the indicator projects (3-15 bars) • Minimum Confidence Filter: Set threshold to hide low-confidence predictions • Historical Match Display: Toggle visibility of colored boxes marking source patterns ━━━━━━━━━━━━━━━━━━━━━━━━━━━━━━━━━━ 🎨 Visualization • Blue Scanner Box: Highlights current pattern being analyzed labeled “AI INPUT (The Prompt)” • Green Historical Boxes: Mark past patterns where price subsequently moved bullish • Red Historical Boxes: Mark past patterns where price subsequently moved bearish • Ghost Bars: Semi-transparent candles projecting into the future showing predicted price path • Confidence Label: Displays prediction confidence percentage and number of matches used • AI Grimoire Book: Leather-bound book overlay in top-right corner with navigable chapters ━━━━━━━━━━━━━━━━━━━━━━━━━━━━━━━━━━ 📖 Usage Guidelines Algorithm Settings • Pattern Length — Default: 20 | Range: 5-100 | Controls how many recent bars define the pattern. Shorter values find more matches but less specific. Longer values find fewer but more precise matches. • Search Depth — Default: 2000 | Range: 500-4900 | Determines how many historical bars to scan. Higher values find more potential matches but increase computation time. • k-Neighbors — Default: 5 | Range: 1-20 | Number of closest matches to use for prediction. Higher values smooth predictions but may dilute strong signals. • Ghost Bar Count — Default: 5 | Range: 3-15 | How many future bars to project. Shorter horizons are typically more reliable. • Use Volume Matching — Default: Off | When enabled, patterns must match on both price AND volume characteristics. • Volume Influence — Default: 30% | Range: 0-100% | Weight given to volume pattern when volume matching is enabled. Visualization Settings • Bullish/Bearish Match Colors — Customize colors for historical match boxes based on outcome direction. • Min Confidence % — Default: 60 | Predictions below this threshold will not display. • Show Historical Matches — Default: On | Toggle visibility of source pattern boxes on chart. Education Settings • Select Chapter — Navigate through AI Grimoire chapters or keep book closed for clean chart view. ━━━━━━━━━━━━━━━━━━━━━━━━━━━━━━━━━━ ✅ Best Use Cases • Learning how k-Nearest Neighbors algorithm functions in a trading context • Understanding the relationship between historical patterns and forward predictions • Identifying when current market conditions resemble past scenarios • Supplementing discretionary analysis with pattern-based confluence • Teaching others machine learning concepts through visual demonstration • Validating whether volume confirms price pattern formations • Building intuition for what AI “sees” when analyzing charts ━━━━━━━━━━━━━━━━━━━━━━━━━━━━━━━━━━ ⚠️ Limitations • Past pattern similarity does not guarantee future outcome similarity • Requires sufficient historical data (minimum 500+ bars) to function properly • Computation-intensive on lower timeframes with maximum search depth • Cannot predict truly novel “black swan” events not represented in historical data • Volume matching less effective on assets with inconsistent volume reporting • Predictions become less reliable as forecast horizon extends further out • Educational overlay may obstruct chart view on smaller screens ━━━━━━━━━━━━━━━━━━━━━━━━━━━━━━━━━━ 💡 What Makes This Unique • Full Transparency: Unlike black-box AI tools, every step of the algorithm is visualized on your chart • Integrated Education: The AI Grimoire teaches machine learning concepts without leaving TradingView • Theory Meets Practice: See exactly which historical patterns inform each prediction • Honest Uncertainty: Confidence scoring and opacity fading acknowledge when the AI “doesn’t know” • Dual-Mode Analysis: Optional volume weighting adds institutional-quality analysis dimension ━━━━━━━━━━━━━━━━━━━━━━━━━━━━━━━━━━ 🔬 How It Works 1. Pattern Capture: On each bar, the indicator captures the most recent price changes as logarithmic returns, creating a normalized “fingerprint” of current market behavior. If volume matching is enabled, volume changes are captured similarly. 2. Historical Search: The algorithm iterates through up to 2,000 historical bars, calculating the Euclidean distance between the current pattern fingerprint and each historical pattern. Distance combines price similarity and optional volume similarity based on weight settings. 3. Neighbor Selection: All historical patterns are ranked by similarity (lowest distance = most similar). The k-closest matches are selected as the “ensemble council” that will inform the prediction. 4. Confidence Calculation: Average distance of top-k matches determines confidence. Tighter clustering of similar patterns yields higher confidence scores, while scattered or distant matches produce lower confidence. 5. Prediction Generation: Future returns from each historical match (what happened AFTER those patterns) are averaged together. This ensemble average is applied to current price to generate ghost bar projections. 6. Visualization: Historical match locations are marked with colored boxes (green for bullish outcomes, red for bearish). Ghost bars render with opacity tied to confidence level—higher confidence means more solid bars. ━━━━━━━━━━━━━━━━━━━━━━━━━━━━━━━━━━ 💡 Note: This indicator is designed primarily for educational purposes —to help traders understand how AI pattern recognition algorithms function. While the predictions can supplement your analysis, they should never be used as the sole basis for trading decisions. The AI Grimoire chapters explain key concepts including why AI “hallucinates” during unprecedented market events. Always combine with proper risk management and additional confirmation. ━━━━━━━━━━━━━━━━━━━━━━━━━━━━━━━━━━ Pine Script® Indikatorvon PhenLabs48
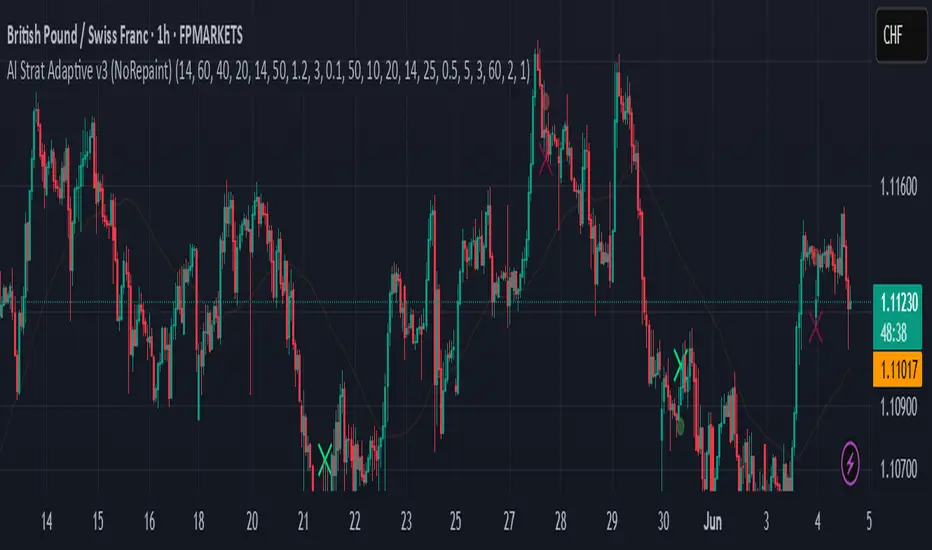
AI Strat ATR Dinamico + ADX + Trend Adaptivo (No Repaint)Below is a fully self-contained, English-language description of every input, function, and logical block inside the “AI Strat ATR Dinamico + ADX + Trend Adaptivo (No Repaint)” indicator. You can copy and paste this into TradingView’s “Description” field when you publish, without exposing any Pine code. --- ## Indicator Name and Purpose **Name (Short Title):** AI Strat Adaptive v3 (NoRepaint) **Overview:** This indicator combines multiple technical tools—RSI, EMA, ATR (with a dynamic multiplier), ADX/DI, and an “AI‐style” scoring mechanism—to generate trend-filtered and reversal signals. It also optionally confirms signals on a higher timeframe, dynamically adjusts its sensitivity based on volatility, and plots intrabar stop‐loss (SL) and take‐profit (TP) levels derived from ATR. Special care has been taken to ensure that no signals “repaint” (i.e., once drawn on a closed bar, they never disappear or shift). --- ## 1. Main Inputs All of the inputs appear in the Settings dialog for the published indicator. Below is a detailed explanation of each input, grouped by logical category. ### A. RSI & EMA Base Parameters 1. **RSI Length (Base)** * **Input type:** Integer (default 14) * **Description:** Number of bars used to calculate the Relative Strength Index (RSI). A shorter RSI reacts more quickly to price changes; a longer RSI is smoother. 2. **RSI Overbought Threshold** * **Input type:** Integer (default 60) * **Description:** If the RSI value rises above this level, it contributes a “sell” signal component. You can adjust this (e.g., 70) to make your system more conservative. 3. **RSI Oversold Threshold** * **Input type:** Integer (default 40) * **Description:** If the RSI falls below this level, it contributes a “buy” signal component. Raising this threshold (e.g., 50) makes the strategy more aggressive in seeking reversals. 4. **EMA Length (Base)** * **Input type:** Integer (default 20) * **Description:** Number of bars for the Exponential Moving Average (EMA). A shorter EMA will produce more frequent crossovers, a longer EMA is smoother. ### B. ATR & Volatility Filter Parameters 5. **ATR Length (Base)** * **Input type:** Integer (default 14) * **Description:** Number of bars to calculate Average True Range (ATR). The ATR is used both for measuring volatility and for dynamic SL/TP levels. 6. **ATR SMA Length** * **Input type:** Integer (default 50) * **Description:** Number of bars to compute a Simple Moving Average of the ATR itself. This gives a baseline of “normal” volatility. If ATR rises significantly above this SMA, the indicator treats the market as “high volatility.” 7. **ATR Multiplier Base** * **Input type:** Float (default 1.2, step 0.1) * **Description:** Base multiplier for ATR when filtering for volatility. The actual threshold is computed as `ATR_SMA × (ATR_Multiplier Base) × sqrt(current_ATR / ATR_SMA)`. In other words, the multiplier becomes larger if volatility is rising, and smaller if volatility is falling. 8. **Disable Volatility Filter** * **Input type:** Boolean (default false) * **Description:** If enabled (true), the indicator will ignore any volatility‐based filtering, using signals regardless of ATR behavior. If disabled (false), signals only fire when ATR > (ATR\_SMA × dynamic multiplier). ### C. Price-Change & “AI Score” Parameters 9. **Price Change Period (bars)** * **Input type:** Integer (default 3) * **Description:** The number of bars back to measure percentage price change. Used to ensure that a “trend” signal is accompanied by a sufficiently positive (for longs) or negative (for shorts) price movement over this many bars. 10. **Base AI Score Threshold** * **Input type:** Float (default 0.1) * **Description:** The indicator computes a composite “AI-style” score by combining the RSI signal (overbought/oversold) and an EMA crossover signal. Only if the absolute value of that composite score exceeds this threshold will a trend signal be eligible. Raising it makes signals rarer but (potentially) higher-conviction. ### D. SMA “ICT” Trend Filter Parameters 11. **ICT SMA Long Length (Base)** * **Input type:** Integer (default 50) * **Description:** Number of bars for the “long” Simple Moving Average (SMA) used in the internal trend filter. Typically, price must be above this SMA (and ADX must be strong) to confirm an uptrend, or below it (and ADX strong) to confirm a downtrend. 12. **ICT SMA Short1 Length (Base)** * **Input type:** Integer (default 10) * **Description:** Secondary “fast” SMA used both for reversal logic (e.g., price crossing above it can count as a bullish reversal) and part of the internal trend confirmation. 13. **ICT SMA Short2 Length (Base)** * **Input type:** Integer (default 20) * **Description:** A second “medium” SMA used for reversal triggers (e.g., crossovers or crossunders alongside RSI conditions). ### E. ADX & DI Parameters 14. **Base ADX Length** * **Input type:** Integer (default 14) * **Description:** Number of bars for the ADX (Average Directional Index) moving averages, which measure trend strength. The same length is used for +DI and –DI smoothing. 15. **Base ADX Threshold** * **Input type:** Float (default 25.0, step 0.5) * **Description:** If ADX > this threshold and +DI > –DI, we consider an uptrend; if ADX > this threshold and –DI > +DI, we consider a downtrend. Raising this value demands stronger trends to qualify. ### F. Sensitivity & Cooldown 16. **Sensitivity (0–1)** * **Input type:** Float between 0.0 and 1.0 (default 0.5) * **Description:** A general “mixture” parameter used internally to weight how aggressively the indicator leans into trend versus reversal. In practice, the code uses it to fine-tune exact thresholds for switching between trend and reversal conditions. You can leave it at 0.5 unless you want to bias more heavily toward either regime. 17. **Base Cooldown Bars Between Signals** * **Input type:** Integer (default 5, min 0) * **Description:** Once a long or short signal fires, the indicator will wait at least this many bars before allowing a new signal in the same direction. Prevents “signal flipping” on each bar. A higher number forces fewer, more spaced-out entries. 18. **Trend Confirmation Bars** * **Input type:** Integer (default 3, min 1) * **Description:** After the directional filters (+DI/–DI cross, price vs. SMA), the indicator still requires that price remains on the same side of the long SMA for at least this many consecutive bars before confirming “trend up” or “trend down.” Larger values smooth out false breakouts but may lag signals. ### G. Higher Timeframe Confirmation 19. **Use Higher Timeframe Confirmation** * **Input type:** Boolean (default true) * **Description:** If true, the indicator will request a block of values (SMA, +DI, –DI, ADX) from a higher timeframe (default 60 minutes) and require that the higher timeframe is also in agreement (strong uptrend or strong downtrend) before confirming your current-timeframe trend. This helps filter out lower-timeframe noise. 20. **Higher Timeframe (TF) for Confirmation** * **Input type:** Timeframe (default “60”) * **Description:** The chart timeframe (e.g., 5, 15, 60 minutes) whose trend conditions must also be true. It’s sent through a `request.security(..., lookahead=barmerge.lookahead_off)` call so that it never “paints ahead.” ### H. Dynamic TP/SL Parameters 21. **TP as ATR Multiple** * **Input type:** Float (default 2.0, step 0.1) * **Description:** When a trade is open, the “take-profit” price is determined by looking at the highest high (for longs) or lowest low (for shorts) observed since entry, and then plotting a cross (“X”) at that level when the trend finally flips. This is purely for display. However, separate from that, this parameter can be adapted if you want a strictly ATR–based TP. In the “Minimal” version, TP is ≈ (highest high) once trend inverts, but you could rewrite it to use `entry_price + ATR×TP_Multiplier`. 22. **SL as ATR Multiple** * **Input type:** Float (default 1.0, step 0.1) * **Description:** While in a trade, a trailing SL line is plotted each bar. Its value is always `entry_price ± (ATR × SL_Multiplier)`. When the trend inverts, the SL no longer updates, and you see it on the chart. ### I. Display and Mode Options 23. **Show Debug Lines** * **Input type:** Boolean (default true) * **Description:** When enabled, the indicator will plot all intermediate lines—ATR SMA, ATR Threshold, +DI, –DI, ADX (current and HTF), HTF SMA, etc.—so that you can diagnose exactly what’s happening. Turn this off to hide all debug information and only see entry/exit shapes. 24. **Enable Scalping Mode** * **Input type:** Boolean (default false) * **Description:** If true, many of the “base” parameters are halved (e.g., RSI length becomes 7 instead of 14, ATR length becomes 7 instead of 14, ADX length becomes 7, etc.), and the ADX threshold is multiplied by 0.8. This makes all oscillators and moving averages more reactive, suited for very short-term (scalping) setups. --- ## 2. Core Calculation Blocks Below is a high-level description of each logical block (in code order), translated from Pine into conceptual steps. ### A. Adjust Inputs if “Scalping Mode” Is On If **Scalping Mode** = true, then: * `RSI_Length` becomes `max(1, round(Base_RSI_Length / 2))` * `EMA_Length` becomes `max(1, round(Base_EMA_Length / 2))` * `ATR_Length` becomes `max(1, round(Base_ATR_Length / 2))` * `Price_Change_Period` becomes `max(1, round(Base_Price_Change_Period / 2))` * `SMA_Long_Length`, `SMA_Short1_Length`, and `SMA_Short2_Length` are each halved (minimum 1). * `ADX_Length` = `max(1, round(Base_ADX_Length / 2))` * `ADX_Threshold` = `Base_ADX_Threshold × 0.8` * `Cooldown_Bars` = `max(0, round(Base_Cooldown_Bars / 2))` Otherwise, all adjusted lengths = their base values. ### B. RSI, EMA & “AI Score” on Current Timeframe 1. **Compute RSI:** * Uses the (possibly adjusted) `RSI_Length`. * Denote this as `RSI_Value`. 2. **Compute ATR & Its SMA:** * `ATR_Value` = `ta.atr(ATR_Length)`. * `ATR_SMA` = `ta.sma(ATR_Value, ATR_SMA_Length)`. * Then define `Volatility_Increase` = (`ATR_Value > ATR_SMA`). * If the volatility has increased, the weighting of RSI vs. EMA changes. 3. **Compute Weights:** * If `Volatility_Increase == true`, then: * `RSI_Weight = 0.7` * `EMA_Weight = 0.3` * Otherwise: * `RSI_Weight = 0.3` * `EMA_Weight = 0.7` 4. **RSI Signal Component (`RSI_Sig`):** * If `RSI_Value > RSI_Overbought`, then `RSI_Sig = –1`. * Else if `RSI_Value < RSI_Oversold`, then `RSI_Sig = +1`. * Otherwise, `RSI_Sig = 0`. 5. **EMA Value & Signal Component (`EMA_Sig`):** * `EMA_Value` = `ta.ema(close, EMA_Length)`. * `EMA_Sig = +1` if the current close crosses **above** the EMA; `EMA_Sig = –1` if the current close crosses **below** the EMA; else `0`. 6. **Compute Raw “AI Score”:** $$ Raw\_AI = (RSI\_Sig \times RSI\_Weight)\;+\;(EMA\_Sig \times EMA\_Weight) $$ Then, $$ AI\_Score = \frac{Raw\_AI}{(RSI\_Weight + EMA\_Weight)} $$ (This normalization ensures the score always ranges between –1 and +1 if both weights sum to 1.) ### C. Dynamic ATR Multiplier & Volatility Filter 1. **Volatility Factor:** $$ Volatility\_Factor = \frac{ATR\_Value}{ATR\_SMA} $$ 2. **Dynamic ATR Multiplier:** $$ ATR\_Multiplier = ATR\_Multiplier\_Base \times \sqrt{Volatility\_Factor} $$ 3. **High Volatility Condition (`High_Volatility`):** * If `Disable_Volatility_Filter == true`, then treat `High_Volatility = true` always. * Else, `High_Volatility = (ATR_Value > ATR_SMA × ATR_Multiplier)`. ### D. Price Change Percentage * **Compute Price Change:** $$ Price\_Change = \frac{(Close - Close )}{Close } \times 100 $$ * This is the percent return from `Price_Change_Period` bars ago to now. * For a valid long‐trend signal, we require `Price_Change > 0`; for a short trend, `Price_Change < 0`. ### E. Local SMAs for Trend/Reversal Filters * `SMA_Close_Long` = `ta.sma(close, SMA_Long_Length)`. * `SMA_Close_Short1` = `ta.sma(close, SMA_Short1_Length)`. * `SMA_Close_Short2` = `ta.sma(close, SMA_Short2_Length)`. These three SMAs help define the “local trend” and reversal breakout points: * **Primary Trend Filter:** * Price must be above `SMA_Close_Long` for an uptrend filter, or below `SMA_Close_Long` for a downtrend filter. * **Reversal Filter:** * A bullish reversal is detected if **(RSI < Oversold AND close crosses above EMA)** OR **(RSI < Oversold AND close crosses above SMA\_Close\_Short1)**. * A bearish reversal is detected if **(RSI > Overbought AND close crosses below EMA)** OR **(RSI > Overbought AND close crosses below SMA\_Close\_Short1)**. ### F. Manual +DI, –DI & ADX on Current Timeframe Instead of relying on the built-in `ta.adx`, the script calculates DI and ADX manually. This makes it easier to replicate the exact logic on a higher timeframe via `request.security`. The steps are: 1. **Directional Movement (DM) Components:** * `Up_Move` = `high – high ` * `Down_Move` = `low – low` * `Plus_DM` = `Up_Move` if (`Up_Move > Down_Move` AND `Up_Move > 0`), else `0` * `Minus_DM` = `Down_Move` if (`Down_Move > Up_Move` AND `Down_Move > 0`), else `0` 2. **True Range (TR) Components:** * `TR1` = `high – low` * `TR2` = `abs(high – close )` * `TR3` = `abs(low – close )` * `True_Range` = `max(TR1, TR2, TR3)` 3. **Smoothed Averages (RMA):** * `Sm_TR` = `ta.rma(True_Range, ADX_Length)` * `Sm_Plus` = `ta.rma(Plus_DM, ADX_Length)` * `Sm_Minus`= `ta.rma(Minus_DM, ADX_Length)` 4. **Compute DI%:** $$ Plus\_DI = \frac{Sm\_Plus}{Sm\_TR} \times 100,\quad Minus\_DI = \frac{Sm\_Minus}{Sm\_TR} \times 100 $$ 5. **DX and ADX:** $$ DX = \frac{|Plus\_DI - Minus\_DI|}{Plus\_DI + Minus\_DI} \times 100,\quad ADX = ta.rma(DX, ADX_Length) $$ These values are referred to as `(plus_di, minus_di, adx_val)` for the current timeframe. --- ## 3. Higher Timeframe (HTF) Confirmation Function If **Use Higher Timeframe Confirmation** is enabled, the script calls a single helper (Pine) function `f_htf` with two parameters: the ADX length and the SMA length (both taken from the “base” or “scaled” values). Internally, `f_htf` simply reruns the manual DI/ADX logic (same as above) on the higher timeframe’s bar data, and also includes that timeframe’s closing price and its SMA for trend comparison. * **Request.Security Call:** ``` = request.security( syminfo.tickerid, higher_tf, f_htf(adx_length, sma_long_len), lookahead=barmerge.lookahead_off ) ``` * `lookahead=barmerge.lookahead_off` ensures that no HTF value “paints” early; you always see only confirmed HTF bars. * The returned tuple provides: 1. `ht_close` = HTF closing price 2. `ht_sma` = HTF SMA of length `sma_long_len` 3. `ht_pdi` = HTF +DI percentage 4. `ht_mdi` = HTF –DI percentage 5. `ht_adx` = HTF ADX value --- ## 4. Trend & Reversal Filters (Current & HTF) ### A. Current-Timeframe Trend Filter 1. **Uptrend\_Basic (Current TF)** $$ (plus\_di > minus\_di)\;\land\;(adx\_val > ADX\_Threshold)\;\land\;(close > SMA\_Close\_Long) $$ 2. **Downtrend\_Basic (Current TF)** $$ (minus\_di > plus\_di)\;\land\;(adx\_val > ADX\_Threshold)\;\land\;(close < SMA\_Close\_Long) $$ 3. **Trend Confirmation by Bars:** * `Bars_Since_Below` = number of bars since `close <= SMA_Close_Long`. * `Bars_Since_Above` = number of bars since `close >= SMA_Close_Long`. * If `Uptrend_Basic == true` AND `Bars_Since_Below ≥ Trend_Confirmation_Bars` → mark `Uptrend_Confirm = true`. * If `Downtrend_Basic == true` AND `Bars_Since_Above ≥ Trend_Confirmation_Bars` → mark `Downtrend_Confirm = true`. ### B. Reversal Filters (Current TF) 1. **Bullish Reversal (`Rev_Bullish`):** * If `(RSI < RSI_Oversold AND close crosses above EMA_Value)` OR `(RSI < RSI_Oversold AND close crosses above SMA_Close_Short1)` → then `Rev_Bullish = true`. 2. **Bearish Reversal (`Rev_Bearish`):** * If `(RSI > RSI_Overbought AND close crosses below EMA_Value)` OR `(RSI > RSI_Overbought AND close crosses below SMA_Close_Short1)` → then `Rev_Bearish = true`. ### C. Higher-Timeframe Trend Filter (HTF) 1. **HTF Uptrend (`HT_Uptrend`):** $$ (ht\_pdi > ht\_mdi)\;\land\;(ht\_adx > ADX\_Threshold)\;\land\;(ht\_close > ht\_sma) $$ 2. **HTF Downtrend (`HT_Downtrend`):** $$ (ht\_mdi > ht\_pdi)\;\land\;(ht\_adx > ADX\_Threshold)\;\land\;(ht\_close < ht\_sma) $$ 3. **Combine Current & HTF:** * If **Use\_HTF\_Confirmation == true**, then: * `Uptrend_Confirm := Uptrend_Confirm AND HT_Uptrend` * `Downtrend_Confirm := Downtrend_Confirm AND HT_Downtrend` * Otherwise, just use the current timeframe’s `Uptrend_Confirm` and `Downtrend_Confirm`. 4. **Define `CurrentTrend` (Integer):** * `CurrentTrend = +1` if `Uptrend_Confirm == true`. * `CurrentTrend = –1` if `Downtrend_Confirm == true`. * Otherwise, `CurrentTrend = 0`. 5. **Reset “One Trade Per Trend”:** * There is a persistent variable `LastTradeTrend`. * Every time `CurrentTrend` flips (i.e., `CurrentTrend != CurrentTrend `), the code sets `LastTradeTrend := 0`. * That allows one new entry once the detected trend has changed. --- ## 5. One‐Time “Cooldown” Logic * **`LastSignalBar`** * A persistent integer (initially undefined). * After each confirmed long or short entry, `LastSignalBar` is set to the bar index where that signal fired. * **`Bars_Since_Signal`** * If `LastSignalBar` is undefined, treat as a very large number (so that initial signals are always allowed). * Otherwise, `Bars_Since_Signal = bar_index – LastSignalBar`. * **Cooldown Check:** * A new long (or short) can only be generated if `(Bars_Since_Signal > Signal_Cooldown)`. * This prevents multiple signals in rapid succession. --- ## 6. Entry Conditions (No Repaint) All of the conditions below are calculated “intrabar,” but the script only actually registers a **signal** on **bar close** (`barstate.isconfirmed`) so that signals never repaint. ### A. Trend‐Based “Raw” Conditions 1. **Trend\_Long\_Raw:** $$ (AI\_Score > AI\_Score\_Threshold)\;\land\;Uptrend\_Confirm\;\land\;High\_Volatility\;\land\;(Price\_Change > 0) $$ 2. **Trend\_Short\_Raw:** $$ (AI\_Score < -AI\_Score\_Threshold)\;\land\;Downtrend\_Confirm\;\land\;High\_Volatility\;\land\;(Price\_Change < 0) $$ ### B. Reversal “Raw” Conditions 1. **Rev\_Long\_Raw:** $$ Rev\_Bullish\;\land\;(CurrentTrend \neq +1) $$ 2. **Rev\_Short\_Raw:** $$ Rev\_Bearish\;\land\;(CurrentTrend \neq -1) $$ ### C. Combine Raw Signals * `Raw_Long = Trend_Long_Raw OR Rev_Long_Raw`. * `Raw_Short = Trend_Short_Raw OR Rev_Short_Raw`. ### D. Confirmed Long/Short Signal Flags On each new bar **close** (`barstate.isconfirmed == true`): * **Long\_Signal\_Confirmed** can fire if: 1. `Raw_Long == true` 2. `LastTradeTrend != +1` (we haven’t already taken a long in this same trend) 3. `Bars_Since_Signal > Signal_Cooldown` If all three hold, then on this bar close the code sets: * `Long_Signal = true` * `LastTradeTrend := +1` * `LastSignalBar := bar_index` Otherwise, `Long_Signal := false` on this bar. * **Short\_Signal\_Confirmed** works the same way but with `Raw_Short`, `LastTradeTrend != -1`, etc. If triggered, it sets `Short_Signal = true`, `LastTradeTrend := -1`, and `LastSignalBar := bar_index`. Otherwise `Short_Signal := false`. * **Important:** If the bar is still forming (`else` branch of `barstate.isconfirmed`), then both `Long_Signal` and `Short_Signal` are forced to `false`. This guarantees that no shape or alert appears until the bar actually closes. --- ## 7. Plotting Entry/Exit Shapes 1. **Trend Long Signal (Triangle Up)** * Condition: `Long_Signal == true` **AND** `Trend_Long_Raw == true`. * Appearance: A small, semi-transparent lime green triangle drawn **below** the bar. 2. **Trend Short Signal (Triangle Down)** * Condition: `Short_Signal == true` **AND** `Trend_Short_Raw == true`. * Appearance: A small, semi-transparent maroon triangle drawn **above** the bar. 3. **Reversal Long Signal (Circle)** * Condition: `Long_Signal == true` **AND** `Rev_Long_Raw == true`. * Appearance: A tiny, more transparent green circle drawn **below** the bar. 4. **Reversal Short Signal (Circle)** * Condition: `Short_Signal == true` **AND** `Rev_Short_Raw == true`. * Appearance: A tiny, more transparent red circle drawn **above** the bar. Since `Long_Signal` and `Short_Signal` only ever become true at bar close, these shapes are never repainted or removed once drawn. --- ## 8. Unified Alert Message * As soon as a new bar closes with either `Long_Signal` or `Short_Signal == true`, an alert message is sent: * If `Long_Signal`, then `alert_msg = "action=BUY"`. * If `Short_Signal`, then `alert_msg = "action=SELL"`. * If neither, `alert_msg = ""` (no alert). * The code calls `alert(alert_msg, freq=alert.freq_once_per_bar)` only if `barstate.isconfirmed` and `alert_msg` is non‐empty. This ensures exactly one alert per confirmed bar, no intrabar pops. --- ## 9. Dynamic TP/SL Logic (Minimal Implementation) Once a long or short position is “open,” the script tracks these variables: 1. **Persistent Flags and Prices** (all persist between bars until reset): * `InLong` (Boolean) * `InShort` (Boolean) * `Long_Max` (Float) * `Short_Min` (Float) * `Entry_Price` (Float) 2. **On Bar Close:** * If `Long_Signal == true` → * Set `InLong := true`, * `Entry_Price := close` of that bar, * `Long_Max := high ` (last bar’s high, so that we’re not using “future” data). * If `Short_Signal == true` → * Set `InShort := true`, * `Entry_Price := close`, * `Short_Min := low `. 3. **While `InLong == true`:** * Continuously update `Long_Max = max(Long_Max, current high)` on each bar (intrabar, but finalized each close). * Compute a dynamic SL: $$ SL_{Long} = Entry\_Price - (ATR \times SL\_ATR\_Multiplier). $$ * If **current trend** flips to non-uptrend (`CurrentTrend != +1`), mark `ExitLong = true`. * Then the routine plots `TP_Long = Long_Max` as a cross (“X”) at that level. * Set `InLong := false` so that no further changes to `Long_Max` or `Entry_Price` happen on future bars. 4. **While `InShort == true`:** * Continuously update `Short_Min = min(Short_Min, current low)`. * Compute a dynamic SL: $$ SL_{Short} = Entry\_Price + (ATR \times SL\_ATR\_Multiplier). $$ * If trend flips to non-downtrend (`CurrentTrend != –1`), mark `ExitShort = true`. * Then the routine plots `TP_Short = Short_Min`. * Set `InShort := false` to freeze those values. 5. **Plotting TP/SL if “Show Debug” is On:** * **TP Shapes:** * When `ExitLong == true`, plot a solid lime “X” at `TP_Long` (highest high). * When `ExitShort == true`, plot a solid maroon “X” at `TP_Short` (lowest low). * **SL Lines:** * If still `InLong`, draw a thin red line at `SL_Long` on each bar. * If still `InShort`, draw a thin green line at `SL_Short`. Thus, your charts visually show the highest‐high take-profit cross for longs, the lowest-low take-profit cross for shorts, and a continuously updating trailing SL until the trend flips. Because all of this is triggered on confirmed bars, nothing “jumps around” after the fact. --- ## 10. Debug‐Only Plot Lines (When Enabled) When **Show Debug Lines** = true, the indicator will also plot: 1. **ATR SMA (Orange):** * The simple moving average of ATR over `ATR_SMA_Length`. 2. **ATR Threshold (Yellow):** * `ATR_SMA × ATR_Multiplier` (the dynamically scaled threshold). 3. **+DI & –DI (Current TF):** * +DI plotted as a green line, –DI plotted as a red line (opacity \~70%). 4. **ADX (Current TF, Blue):** * A blue line for the present timeframe’s ADX. 5. **ADX Threshold (Gray):** * A horizontal gray line showing `ADX_Threshold`. 6. **+DI & –DI (HTF, Darker Colors):** * If HTF confirmation is on, “HTF +DI” is a greener but more transparent line; “HTF –DI” is a redder but more transparent line. 7. **ADX (HTF, Blue but Transparent):** * HTF ADX plotted in blue (high transparency). 8. **HTF SMA (Orange, Transparent):** * The higher timeframe’s SMA (same length as `SMA_Long_Length`), drawn in fainter orange. 9. **Volatility Zone Fill (Yellow Tinted Area):** * Fills the area between `ATR_SMA` and `ATR_SMA × ATR_Multiplier`. * Indicates “normal” versus “high‐volatility” regimes. These debug lines are purely visual aids. Disable them if you want a cleaner chart. --- ## 11. Putting It All Together — Step-By-Step Flow 1. **Read Inputs** (RSI lengths, EMA length, ATR settings, etc.). 2. **Optionally Halve All Lengths** if “Scalping Mode” is checked. 3. **Calculate Current TF Indicators:** * RSI, ATR, ATR\_SMA, EMA, price change, various SMAs, DI/ADX. 4. **Compute “AI Score”** (weighted sum of RSI and EMA signals). 5. **Compute Dynamic ATR Multiplier** and decide if “High Volatility” is true. 6. **Compute Raw Trend/Reversal Conditions** on the current timeframe (without triggering yet). 7. **Fetch HTF Values** in one `request.security` call (SMAs, DI/ADX). 8. **Combine Current & HTF Trend Filters** to confirm `Uptrend_Confirm` or `Downtrend_Confirm`. 9. **Check Reversal Conditions** (price crossing EMA or SMA short, in overbought/oversold zones). 10. **Enforce “One Trade Per Trend”** (clear `LastTradeTrend` whenever `CurrentTrend` flips). 11. **Enforce Cooldown** (must wait at least `Signal_Cooldown` bars since the prior signal). 12. **On Bar Close:** * If `Raw_Long` AND not already in a long trend AND cooldown met, then fire `Long_Signal`. * Else if `Raw_Short` AND not already in a short trend AND cooldown met, then fire `Short_Signal`. * Otherwise, no new signal on this bar. 13. **Plot Long/Short Entry Shapes** according to whether it was a Trend signal or a Reversal signal. 14. **Send Alert** (“action=BUY” or “action=SELL”) exactly once per confirmed bar. 15. **If New Long/Short Signal, Set `InLong`/`InShort`, Record Entry Price, Initialize `Long_Max`/`Short_Min`.** 16. **While `InLong` is true:** Update `Long_Max = max(previous Long_Max, current high)`. Compute `SL_Long`. If the current trend flips (no longer uptrend), set `ExitLong = true`, plot a “TP X,” and close the position logic. 17. **While `InShort` is true:** Similarly update `Short_Min`, compute `SL_Short`, and if trend flips, set `ExitShort = true`, plot a “TP X,” and close the position logic. 18. **Optionally Display Debug Lines** (ATR SMA, ATR threshold, DI/ADX, HTF DI/ADX, etc.). --- ## 12. How to Use in TradingView Community When you publish this indicator to the TradingView community—choosing “Protected” or “Invite-only” visibility—you can paste the above description into the “Description” field. Users will see exactly what each input does, how signals are generated, and what the various plotted lines represent, **without ever seeing the script source**. In this way, the code itself remains hidden but the logic is fully documented. 1. **Go to “Create New Indicator”** on TradingView. 2. **Paste Your Pine Code** (the full indicator script) in the Pine editor and save it. 3. **Set Visibility = Protected** (or Invite-only). 4. **In the “Description” Text Box, paste the entirety of this document** (steps 1–11). 5. **Click “Publish Script.”** Users who view your indicator will see its name (“AI Strat Adaptive v3 (NoRepaint)”), a list of all inputs (with default values), and the detailed English description above. They can then load it on any chart, adjust inputs, and see the plotted signals, TP/SL lines, and optional debug overlays—without accessing the underlying Pine code. --- ### Summary of Key Points * **RSI, EMA, ATR, DI/ADX, and “AI Score”** work together to define “trend vs. reversal.” * **Dynamic volatility filter** uses ATR and ATR\_SMA to adapt the weighting of RSI vs. EMA and decide whether “volatility is high enough” to permit a trend trade. * **One trade per detected trend** and a **cooldown period** prevent over‐trading. * **Higher timeframe confirmation** (optional) further filters out noise. * **No-repaint logic**: * All signals only appear at bar close (`barstate.isconfirmed`). * HTF values are fetched with `lookahead=barmerge.lookahead_off`. * **Entry shapes** (triangles and circles) clearly mark trend vs. reversal entries. * **Dynamic TP/SL**: highest‐high (or lowest‐low) since entry is used as TP, ATR×multiplier as SL. * **Debug mode** (optional) shows every intermediate line for full transparency. Use this description verbatim (or adapt it slightly for your personal style) when publishing. That way, your community sees exactly how each component works—inputs, functions, filters—while the Pine source code remains private. Pine Script® Indikatorvon Algo_SystemsAktualisiert 63
AI SuperTrend x Pivot Percentile - Strategy [PresentTrading]█ Introduction and How it is Different The AI SuperTrend x Pivot Percentile strategy is a sophisticated trading approach that integrates AI-driven analysis with traditional technical indicators. Combining the AI SuperTrend with the Pivot Percentile strategy highlights several key advantages: 1. Enhanced Accuracy in Trend Prediction: The AI SuperTrend utilizes K-Nearest Neighbors (KNN) algorithm for trend prediction, improving accuracy by considering historical data patterns. This is complemented by the Pivot Percentile analysis which provides additional context on trend strength. 2. Comprehensive Market Analysis: The integration offers a multi-faceted approach to market analysis, combining AI insights with traditional technical indicators. This dual approach captures a broader range of market dynamics. BTC 6H L/S Performance Local █ Strategy: How it Works - Detailed Explanation 🔶 AI-Enhanced SuperTrend Indicators 1. SuperTrend Calculation: - The SuperTrend indicator is calculated using a moving average and the Average True Range (ATR). The basic formula is: - Upper Band = Moving Average + (Multiplier × ATR) - Lower Band = Moving Average - (Multiplier × ATR) - The moving average type (SMA, EMA, WMA, RMA, VWMA) and the length of the moving average and ATR are adjustable parameters. - The direction of the trend is determined based on the position of the closing price in relation to these bands. 2. AI Integration with K-Nearest Neighbors (KNN): - The KNN algorithm is applied to predict trend direction. It uses historical price data and SuperTrend values to classify the current trend as bullish or bearish. - The algorithm calculates the 'distance' between the current data point and historical points. The 'k' nearest data points (neighbors) are identified based on this distance. - A weighted average of these neighbors' trends (bullish or bearish) is calculated to predict the current trend. For more please check: Multi-TF AI SuperTrend with ADX - Strategy 🔶 Pivot Percentile Analysis 1. Percentile Calculation: - This involves calculating the percentile ranks for high and low prices over a set of predefined lengths. - The percentile function is typically defined as: - Percentile = Value at (P/100) × (N + 1)th position - Where P is the desired percentile, and N is the number of data points. 2. Trend Strength Evaluation: - The calculated percentiles for highs and lows are used to determine the strength of bullish and bearish trends. - For instance, a high percentile rank in the high prices may indicate a strong bullish trend, and vice versa for bearish trends. For more please check: Pivot Percentile Trend - Strategy 🔶 Strategy Integration 1. Combining SuperTrend and Pivot Percentile: - The strategy synthesizes the insights from both AI-enhanced SuperTrend and Pivot Percentile analysis. - It compares the trend direction indicated by the SuperTrend with the strength of the trend as suggested by the Pivot Percentile analysis. 2. Signal Generation: - A trading signal is generated when both the AI-enhanced SuperTrend and the Pivot Percentile analysis agree on the trend direction. - For instance, a bullish signal is generated when both the SuperTrend is bullish, and the Pivot Percentile analysis shows strength in bullish trends. 🔶 Risk Management and Filters - ADX and DMI Filter: The strategy uses the Average Directional Index (ADX) and the Directional Movement Index (DMI) as filters to assess the trend's strength and direction. - Dynamic Trailing Stop Loss: Based on the SuperTrend indicator, the strategy dynamically adjusts stop-loss levels to manage risk effectively. This strategy stands out for its ability to combine real-time AI analysis with established technical indicators, offering traders a nuanced and responsive tool for navigating complex market conditions. The equations and algorithms involved are pivotal in accurately identifying market trends and potential trade opportunities. █ Usage To effectively use this strategy, traders should: 1. Understand the AI and Pivot Percentile Indicators: A clear grasp of how these indicators work will enable traders to make informed decisions. 2. Interpret the Signals Accurately: The strategy provides bullish, bearish, and neutral signals. Traders should align these signals with their market analysis and trading goals. 3. Monitor Market Conditions: Given that this strategy is sensitive to market dynamics, continuous monitoring is crucial for timely decision-making. 4. Adjust Settings as Needed: Traders should feel free to tweak the input parameters to suit their trading preferences and to respond to changing market conditions. █Default Settings and Their Impact on Performance 1. Trading Direction (Default: "Both") Effect: Determines whether the strategy will take long positions, short positions, or both. Adjusting this setting can align the strategy with the trader's market outlook or risk preference. 2. AI Settings (Neighbors: 3, Data Points: 24) Neighbors: The number of nearest neighbors in the KNN algorithm. A higher number might smooth out noise but could miss subtle, recent changes. A lower number makes the model more sensitive to recent data but may increase noise. Data Points: Defines the amount of historical data considered. More data points provide a broader context but may dilute recent trends' impact. 3. SuperTrend Settings (Length: 10, Factor: 3.0, MA Source: "WMA") Length: Affects the sensitivity of the SuperTrend indicator. A longer length results in a smoother, less sensitive indicator, ideal for long-term trends. Factor: Determines the bandwidth of the SuperTrend. A higher factor creates wider bands, capturing larger price movements but potentially missing short-term signals. MA Source: The type of moving average used (e.g., WMA - Weighted Moving Average). Different MA types can affect the trend indicator's responsiveness and smoothness. 4. AI Trend Prediction Settings (Price Trend: 10, Prediction Trend: 80) Price Trend and Prediction Trend Lengths: These settings define the lengths of weighted moving averages for price and SuperTrend, impacting the responsiveness and smoothness of the AI's trend predictions. 5. Pivot Percentile Settings (Length: 10) Length: Influences the calculation of pivot percentiles. A shorter length makes the percentile more responsive to recent price changes, while a longer length offers a broader view of price trends. 6. ADX and DMI Settings (ADX Length: 14, Time Frame: 'D') ADX Length: Defines the period for the Average Directional Index calculation. A longer period results in a smoother ADX line. Time Frame: Sets the time frame for the ADX and DMI calculations, affecting the sensitivity to market changes. 7. Commission, Slippage, and Initial Capital These settings relate to transaction costs and initial investment, directly impacting net profitability and strategy feasibility.Pine Script® Strategievon PresentTrading1717 4.4 K
AI's Opinion Trading System V21. Complete Summary of the Indicator Script AI’s Opinion Trading System V2 is an advanced, multi-factor trading tool designed for the TradingView platform. It combines several technical indicators (moving averages, RSI, MACD, ADX, ATR, and volume analysis) to generate buy, sell, and hold signals. The script features a customizable AI “consensus” engine that weighs multiple indicator signals, applies user-defined filters, and outputs actionable trade instructions with clear stop loss and take profit levels. The indicator also tracks sentiment, volume delta, and allows for advanced features like pyramiding (adding to positions), custom stop loss/take profit prices, and flexible signal confirmation logic. All key data and signals are displayed in a dynamic, color-coded table on the chart for easy review. 2. Full Explanation of the Table The table is a real-time dashboard summarizing the indicator’s logic and recommendations for the most recent bars. It is color-coded for clarity and designed to help traders quickly understand market conditions and AI-driven trade signals. Columns (from left to right): Column Name What it Shows Bar The time context: “Now” for the current bar, then “Bar -1”, “Bar -2”, etc. for previous bars. Raw Consensus The raw AI consensus for each bar: “Buy”, “Sell”, or “-” (neutral). Up Vol The amount of volume on up (rising) bars. Down Vol The amount of volume on down (falling) bars. Delta The difference between up and down volume. Green if positive, red if negative, gray if neutral. Close The closing price for each bar, color-coded by price change. Sentiment Diff The difference between the close and average sentiment price (a custom sentiment calculation). Lookback The number of bars used for sentiment calculation (if enabled). ADX The ADX value (trend strength). ATR The ATR value (volatility measure). Vol>Avg “Yes” (green) if volume is above average, “No” (red) otherwise. Confirm Whether the AI signal is confirmed over the required bars. Logic Output The AI’s interpreted signal after applying user-selected logic: “Buy”, “Sell”, or “-”. Final Action The final signal after all filters: “Buy”, “Sell”, or “-”. Trade Instruction A plain-English instruction: Buy/Sell/Add/Hold/No Action, with price, stop loss, and take profit. Color Coding: Green: Positive/bullish values or signals Red: Negative/bearish values or signals Gray: Neutral or inactive Blue background: For all table cells, for visual clarity White text: Default, except for color-coded cells 3. Full User Instructions for Every Input/Style Option Below are plain-language instructions for every user-adjustable option in the indicator’s input and style pages: Inputs Table Location What it does: Sets where the summary table appears on your chart. How to use: Choose from 9 positions (Top Left, Top Center, Top Right, etc.) to avoid overlapping with other chart elements. Decimal Places What it does: Controls how many decimal places prices and values are displayed with. How to use: Increase for assets with very small prices (e.g., SHIB), decrease for stocks or forex. Show Sentiment Lookback? What it does: Shows or hides the “Lookback” column in the table, which displays how many bars are used in the sentiment calculation. How to use: Turn off if you want a simpler table. AI View Mode What it does: Selects the logic for how the AI combines signals from different indicators. Majority: Follows the most common signal among all indicators. Weighted: Uses custom weights for each type of signal. Custom: Lets you define your own logic (see below). How to use: Pick the logic style that matches your trading philosophy. AI Consensus Weight / Vol Delta Weight / Sentiment Weight What they do: When using “Weighted” AI View Mode, these let you set how much influence each factor (indicator consensus, volume delta, sentiment) has on the final signal. How to use: Increase a weight to make that factor more important in the AI’s decision. Custom AI View Logic What it does: Lets advanced users write their own logic for when the AI should signal a trade (e.g., “ai==1 and delta>0 and sentiment>0”). How to use: Only use if you understand basic boolean logic. Use Custom Stop Loss/Take Profit Prices? What it does: If enabled, you can enter your own fixed stop loss and take profit prices for buys and sells. How to use: Turn on to override the auto-calculated SL/TP and enter your desired prices below. Custom Buy/Sell Stop Loss/Take Profit Price What they do: If custom SL/TP is enabled, these fields let you set exact prices for stop loss and take profit on both buy and sell trades. How to use: Enter your preferred price, or leave at 0 for auto-calculation. Sentiment Lookback What it does: Sets how many bars the sentiment calculation should look back. How to use: Increase to smooth out sentiment, decrease for faster reaction. Max Pyramid Adds What it does: Limits how many times you can add to an existing position (pyramiding). How to use: Set to 1 for no adds, higher for more aggressive scaling in trends. Signal Preset What it does: Quick-sets a group of signal parameters (see below) for “Robust”, “Standard”, “Freedom”, or “Custom”. How to use: Pick a preset, or select “Custom” to adjust everything manually. Min Bars for Signal Confirmation What it does: Sets how many bars a signal must persist before it’s considered valid. How to use: Increase for more robust, less frequent signals; decrease for faster, but possibly less reliable, signals. ADX Length What it does: Sets the period for the ADX (trend strength) calculation. How to use: Longer = smoother, shorter = more sensitive. ADX Trend Threshold What it does: Sets the minimum ADX value to consider a trend “strong.” How to use: Raise for stricter trend confirmation, lower for more trades. ATR Length What it does: Sets the period for the ATR (volatility) calculation. How to use: Longer = smoother volatility, shorter = more reactive. Volume Confirmation Lookback What it does: Sets how many bars are used to calculate the average volume. How to use: Longer = more stable volume baseline, shorter = more sensitive. Volume Confirmation Multiplier What it does: Sets how much current volume must exceed average volume to be considered “high.” How to use: Increase for stricter volume filter. RSI Flat Min / RSI Flat Max What they do: Define the RSI range considered “flat” (i.e., not trending). How to use: Widen to be stricter about requiring a trend, narrow for more trades. Style Page Most style settings (such as plot colors, label sizes, and shapes) are preset in the script for visual clarity. You can adjust plot visibility and colors (for signals, stop loss, take profit) in the TradingView “Style” tab as with any indicator. Buy Signal: Shows as a green triangle below the bar when a buy is triggered. Sell Signal: Shows as a red triangle above the bar when a sell is triggered. Stop Loss/Take Profit Lines: Red and green lines for SL/TP, visible when a trade is active. SL/TP Labels: Small colored markers at the SL/TP levels for each trade. How to use: Toggle visibility or change colors in the Style tab if you wish to match your chart theme or preferences. In Summary This indicator is highly customizable—you can tune every aspect of the AI logic, risk management, signal filtering, and table display to suit your trading style. The table gives you a real-time, comprehensive view of all relevant signals, filters, and trade instructions. All inputs are designed to be intuitive—hover over them in TradingView for tooltips, or refer to the explanations above for details.Pine Script® Indikatorvon ChalkBoardAnalyticsAktualisiert 69
Moving Average Ribbon(AI mode,high volume,strat base S/R filter)# AI-Powered Moving Average Ribbon & Smart Filters ## Overview This script presents a next-generation approach to trend following by combining adaptive "AI" logic with advanced price action and volume filtering. Unlike traditional indicators that rely on static settings, the **AI Mode** in this script dynamically self-adjusts its parameters in real-time to align with the changing market conditions. ## Key Features ### 🧠 AI Mode (Adaptive Intelligence) The core of this indicator is the AI engine. When enabled, it overrides manual settings and analyzes the market structure across higher timeframes. - **Dynamic Sensitivity:** It automatically tightens the Moving Average ribbon during strong trends to capture early entries and widens it during noise/chop to reduce false signals. - **Trend & Volatility Analysis:** The algorithm continuously monitors trend strength and volatility, adjusting the number of MA lines and their spacing (step) to provide the most relevant visual support/resistance zones. ### 🛡️ Smart Signal Filtering To further enhance reliability, the script incorporates two powerful filtering layers. Signals are only generated when these confluence factors align: 1. **High Volume filter:** Identifies critical support and resistance levels based on significant volume anomalies. The script visualizes these zones with dynamic concentric circles, helping you see where "smart money" has previously interacted. 2. **Strat S/R:** Utilizes price action logic (Inside/Outside bars) to pinpoint structural pivots. This ensures that trades are taken in alignment with key market structure levels. ### 📊 Visual Enhancements - **Dynamic Ribbon:** Color-coded for Bullish (Green), Bearish (Red), and Choppy (Gray) market states. - **Chop Zone:** Visually highlights periods of consolidation, helping you stay out of low-probability environments. - **Signal Labels:** Clear BUY and SELL labels appear only when the Ribbon flips *and* all selected filters are satisfied. ## Usage - **AI Toggle:** Switch "AI Mode" ON in the settings to let the script handle the tuning. - **Manual Control:** Disable AI Mode to use your preferred Moving Average Type (SMA, EMA, HMA, etc.) and custom lengths. - **Filter Customization:** You can independently toggle the HVP and Strat filters to suit your trading style. --- **⚠️ Disclaimer** This script is for **educational purposes only**. Trading financial markets involves significant risk, and this tool does not guarantee profits. Past performance is not indicative of future results. Use this script at your own risk. **🔒 Access** For trial access, please send a DM.Pine Script® Indikatorvon Awesome_Trader_6662
AI Astra Pro - Options Intelligence by Pooja📘 AI Astra Pro – Options Intelligence by Pooja Invite-Only • Option Premium–Focused • Rule-Based Intelligence System 🔔 IMPORTANT (PLEASE READ FIRST) AI Astra Pro is designed exclusively for OPTION PREMIUM charts. This indicator will not work on index or equity charts. It internally calculates approximate option Greeks (Delta, Gamma, Theta, Vega) using option premium behavior and underlying index price. For safety and correctness, the script automatically restricts usage to option premium symbols only. 🔍 What AI Astra Pro Does (Purpose) AI Astra Pro is an advanced intraday options intelligence indicator designed to help option traders: Reduce false entries Avoid over-trading Filter out low-energy and sideways market conditions Trade only when multiple independent confirmations align Instead of producing frequent signals, this indicator focuses on signal quality, confirmation, and controlled re-entries, making it suitable for serious intraday option traders. ⚙️ Core Features (Explained Clearly) 🔹 1. Option-Only Safety System Script runs only on option premium charts Prevents incorrect usage on index or equity charts Ensures Greeks and premium logic remain valid 🔹 2. Confirmed BUY & SELL Signals (No Repainting) Signals appear only after candle close No intrabar repainting or blinking signals Suitable for live trading and automation alerts 🔹 3. Dual RSI Engine (Buy & Sell Separation) Separate RSI + RSI-MA logic for BUY and SELL Minimum RSI-MA distance filter Directional slope validation Prevents mixed or contradictory signals ➡️ This avoids the common issue where one RSI controls both sides incorrectly. 🔹 4. RSI 60 / 40 Momentum Filter BUY signals allowed only in bullish momentum SELL signals allowed only in bearish momentum ➡️ Blocks trades during unclear or weak momentum phases. 🔹 5. ADX + ATR Strength & Volatility Filter ADX confirms trend strength ATR confirms sufficient intraday volatility ➡️ Prevents entries during sideways or low-energy markets where options decay faster. 🔹 6. EMA + VWAP Trend Alignment BUY signals only when price is above EMA & VWAP SELL signals only when price is below EMA & VWAP ➡️ Avoids counter-trend option entries, reducing drawdowns. 🔹 7. Strategy-2 Positional Re-Entry Logic Re-entries allowed only after proper pullback Price must cross and re-accept EMA/VWAP Prevents repeated signals without real retracement ➡️ Controls over-trading in strong trends. 🔹 8. Trendline-Based Structure Filter Dynamic trendlines from swing highs/lows Multiple slope calculation modes (ATR / Stdev / Linear Regression) Signals aligned with structural zones ➡️ Helps avoid chasing overextended moves. 🔹 9. Pivot Points for Context Traditional pivot levels Multi-timeframe support Optional price labels ➡️ Used for context only, not direct signal generation. 🔹 10. Option Greeks Intelligence Dashboard (Approximate) The dashboard displays approximate option Greeks, derived from option premium behavior: Delta Sensitivity – responsiveness of premium to index movement Approx. Delta Projection – estimated premium movement for a 100-point index move Gamma Activity – rate of delta change Theta Status – time decay behavior Vega / IV State – implied volatility expansion or compression ⚠️ These are approximate analytical values, not exchange-provided Greeks. 11. 🔹 Session Filter Optional disabling of signals during selected intraday time windows (e.g. noisy market open). 🧩 Why This Is NOT a Simple Indicator Merge AI Astra Pro is not a basic combination of RSI, EMA, VWAP, or Supertrend. Instead, it uses a state-driven architecture, where different indicator logics work as independent filters, not as simple triggers. Key architectural differences: Independent BUY and SELL logic engines No shared oscillator state between buy & sell Reset-based signal eligibility Sequential condition validation Anti-overtrading enforcement Oscillators and Non Oscillators Combination Filters for more Accuracy. Option Dashboard with Option Greeks Status which really make it unique. This structure makes the script original and structurally different from common indicator combinations. 🧠 What “AI” Means in This Indicator This script does NOT use machine learning, neural networks, or predictive models. The term “AI” refers to a rule-based decision intelligence system, where: Multiple market conditions are evaluated together Signals are allowed only after sequential validation Internal state logic decides when a signal is allowed or blocked Signals trigger only on confirmed candle close This approach mimics disciplined decision-making rather than prediction. Different kinds of Filters like adx, atr, Rsi slope which helps you to filter fake breakout and help to reduce overtrading. 🔔 Alerts & Automation BUY / SELL alerts on confirmed signals only Webhook-compatible Suitable for Telegram, Tradetron, or other platforms No repaint behavior 👤 Who This Indicator Is For ✔️ Intraday option buyers ✔️ Intraday option sellers ✔️ Option premium–based directional traders ✔️ Traders who prefer quality over quantity ✔️ Rule-based and confirmation-driven setups ✔️ Traders who want discipline, not over-signals ❌ Not suitable for: Equity delivery trading Long-term investing Index chart analysis without option premium 🔒 Why Invite-Only This script includes: Internal state tracking Reset logic Independent signal engines Option-specific intelligence logic Source access is restricted to protect the originality and structure of the implementation. ⚠️ Disclaimer This indicator is provided for educational and analytical purposes only. It does not provide financial advice, investment recommendations, or profit guarantees. All trading decisions and risk management remain the sole responsibility of the user. All option dashboard values are approximate and derived using option pricing and option Greeks–based formulas.Pine Script® Indikatorvon financegurupoojaAktualisiert 2211
AI-JX Strategy### 🤖 Core Features AI-JX v3.3 is an AI-powered comprehensive trading strategy system developed with PineScript v6, integrating multiple advanced technical analysis tools and machine learning algorithms. ### 📊 Main Functional Modules 1. AI Learning System - Adaptive Parameter Optimization : Automatically learns and adjusts trading parameters - Three Strategy Modes : Conservative (ranging markets), Aggressive (trending markets), Balanced (universal) - Dynamic Weight Adjustment : Intelligently allocates weights to different strategies based on market conditions - Learning Memory Mechanism : Records historical trading data for continuous strategy optimization 2. Technical Indicator System - SuperTrend Indicator : ATR-based trend following system - Heikin Ashi Smoothing : Reduces market noise for clearer trend signals - Standard Deviation Channels : Multi-level support and resistance analysis - Trend Distribution Profile : Visualizes price distribution and trend strength - Multi-Timeframe Analysis : Comprehensive analysis across 5m, 15m, and 1h timeframes 3. Intelligent Signal Generation - Traditional Signals : Classic buy/sell signals based on SuperTrend - AI Smart Signals : Comprehensive scoring system combining RSI, MACD, and ATR - False Breakout Detection : Identifies and filters fake breakout signals - Price Confirmation Mechanism : Ensures signal validity and reliability 4. Risk Management System - Dynamic Stop Loss/Take Profit : Long 3% TP/1.5% SL, Short 2:1 risk-reward ratio - Slippage Monitoring : Real-time market slippage risk assessment - Volatility Filtering : Adjusts trading strategy based on ATR - Position Management : Smart capital allocation and risk control 5. Visualization Panels - Statistics Panel : Displays key data like trade count, win rate, current strategy - AI Learning Panel : Shows strategy weights and learning progress - Prediction Panel : Real-time AI analysis and trading recommendations - Chart Markers : Clear buy/sell signals and trend line displays 6. Alert System - Multiple Alert Types : Buy, sell, take profit, and stop loss notifications - Personalized Messages : Fun "WangWang" themed alert messages - Real-time Notifications : Precise alerts with maximum one per bar frequency ### 🎯 Key Advantages - AI-Driven : Machine learning optimization for better performance - Multi-Strategy : Adapts to different market conditions automatically - Risk-Controlled : Comprehensive risk management with dynamic adjustments - User-Friendly : Intuitive interface with detailed visualization panels - Highly Customizable : Extensive parameter settings for different trading stylesPine Script® Strategievon shaw_gaoAktualisiert 24
AI x Meme Impulse Tracker [QuantraSystems]AI x Meme Impulse Tracker Quantra Systems guarantees that the information created and published within this document and on the Tradingview platform is fully compliant with applicable regulations, does not constitute investment advice, and is not exclusively intended for qualified investors. Important Note! The system equity curve presented here has been generated as part of the process of testing and verifying the methodology behind this script. Crucially, it was developed after the system was conceptualized, designed, and created, which helps to mitigate the risk of overfitting to historical data. In other words, the system was built for robustness, not for simply optimizing past performance. This ensures that the system is less likely to degrade in performance over time, compared to hyper-optimized systems that are tailored to past data. No tweaks or optimizations were made to this system post-backtest. Even More Important Note!! The nature of markets is that they change quickly and unpredictably. Past performance does not guarantee future results - this is a fundamental rule in trading and investing. While this system is designed with broad, flexible conditions to adapt quickly to a range of market environments, it is essential to understand that no assumptions should be made about future returns based on historical data. Markets are inherently uncertain, and this system - like all trading systems - cannot predict future outcomes. Introduction The AI x Meme Impulse Tracker is a cutting-edge, fast-acting rotational algorithm designed to capitalize on the strength of assets within pre-selected categories. Using a custom function built on top of the RSI Pulsar, the system measures momentum through impulses rather than traditional trend following methods. This allows for swifter reallocations based on short bursts of strength. This system focuses on precision and agility - making it highly adaptable in volatile markets. The strategy is built around three independent asset categories - with allocations only made to the strongest asset in each - ensuring that capital movement (in particular between blockchains) is kept to a minimum for efficiency purposes while maintaining exposure to the highest performing tokens. Legend Token Inputs: The Impulse Tracker is designed with dynamic asset selection - allowing traders to customize the inputs for each category. This feature enables flexible system management, as the number of active tokens within each category can be adjusted at any time. Whether the user chooses the default of 13 tokens per category, or fewer, the system will automatically recalibrate. This ensures that all calculations, from relative strength to individual performance assessments, adjust as required. Disabled tokens are treated by the system as if they don’t exist - seamlessly updating performance metrics and the Impulse Tracker’s allocation behavior to maintain the highest level of efficiency and accuracy. System Equity Curve: The Impulse Tracker plots both the rotational system’s equity and the Buy-and-Hold (or ‘HODL’) benchmark of Bitcoin for comparison. While the HODL approach allocates the entire portfolio to Bitcoin and functions as an index to compare to, the Impulse Tracker dynamically allocates based on strength impulses within the chosen tokens and categories. The system equity curve is representative of adding an equal capital split between the strongest assets of each category. The relative strength system does handle ‘ties’ of strength - in this situation multiple tokens from a single category can be included in the final equity curve, with the allocated weight to that category split between the tied assets. TABLES: Equity Stats: This table is held in Quantra System's typical UI design language. It offers a comprehensive snapshot of the system’s performance, with key metrics organized to help traders quickly assess both short-term and cumulative results. The left side provides details on individual asset performance, while the right side presents a comparison of the system’s risk-adjusted metrics against a simple BTC Hodl strategy. The leftmost column of the Equity Stats table showcases performance indicators for the system’s current allocations. This provides quick identification of the current strongest tokens, based on confirmed and non-repainting data as soon as the current opens and the last bar closes. The right-hand side compares the performance differences between the system and Hodl profits, both on a cumulative basis and analyzing only the previous bar. The total number of position changes is also tracked in this table - an important metric when calculating total slippage and should be used to determine how ‘hands-on’ the strategy will be on the current timeframe. The lower part of the table highlights a direct comparison of the AI x Memes Impulse strategy with buy-and-hold Bitcoin. The risk adjusted performance ratios, Sharpe, Sortino and Omega, are shown side by side, as well as the maximum drawdown experienced by both strategies within the set testing window. Screener Table: This table provides a detailed breakdown of the performance for each asset that has been the strongest in its category at some point and thus received an allocation. The table tracks several key metrics for each asset - including returns, volatility, Sharpe ratio, Sortino ratio, Omega ratio, and maximum drawdown. It also displays the signals for both current and previous periods, as well as the assets weight in the theoretical portfolio. Assets that have never received a signal are also included, giving traders an overview of which assets have contributed to the portfolio's performance and which have not played a role so far. The position changes cell also offers important insights, as it shows the frequency of not just total position changes, but also rebalancing events. Detailed Slippage Table: The Detailed Slippage Table provides a comprehensive breakdown of the calculated slippage and fees incurred throughout the strategy’s operations. It contains several key metrics that give traders a granular view of the costs associated with executing the system: Selected Slippage - Displays the current slippage rate, as defined in the input menu. Removal Slippage - This accounts for any slippage or fees incurred when removing an allocation from a token. Reallocation Slippage - Tracks the slippage or fees when reallocating capital to existing positions. Addition Slippage - Measures the slippage or fees incurred when allocating capital to new tokens. Final Slippage - Is the sum of all the individual slippage points and provides a quick view of the total slippage accounted for by the system. The table is also divided into two columns: Last Transaction Slippage + Fees - Displays any slippage or fees incurred based on position changes within the current bar. Total Slippage + Fees - Shows the cumulative slippage and fees incurred since the portfolio’s selected start date. Visual Customization: Several customizable features are included within the input menu to enhance user experience. These include custom color palettes, both preloaded and user-selectable. This allows traders to personalize the visual appearance of the tables, ensuring clarity and consistency with their preferred interface themes and background coloring. Additionally, users can adjust both the position and sizes of all the tables - enabling complete tailoring to the trader’s layout and specific viewing preferences and screen configurations. This level of customization ensures a more intuitive and flexible interaction with the system’s data. Core Features and Methodologies Advanced Risk Management - A Unique Filtering Approach: The Equity Curve Activation Filter introduces an innovative way to dynamically manage capital allocation, aligning with periods of market trend strength. This filter is rooted in the understanding that markets move cyclically - altering between periods trending and mean-reverting periods. This cycle is especially pronounced in the crypto markets, where strong uptrends are often followed by prolonged periods of sideways movements or corrections as participants take profits and momentum fades. The Cyclical Nature of Markets and Trend Following: Financial markets do not trend indefinitely. Each uptrend or downtrend, whether over high and low timeframes, tends to culminate in a phase where momentum exhausts - leading to the sideways or corrective phases. This cycle results from the natural dynamics of market participants: during extended trends, more participants jump in, riding the momentum until profit taking causes the trend to slow down or reverse. This cyclical behavior occurs across all timeframes and in all markets - making it essential to adapt trading strategies in attempt to minimize losses during less favorable conditions. In a trend following system, profitability often mirrors this cyclical pattern. Trend following strategies thrive when markets are moving directionally, capturing gains as price moves with strength in a single direction. However in phases where the market chops sideways, trend following strategies will usually experience drawdowns and reduced returns due to the impersistent nature of any trends. This fluctuation in trend following profitability can actually serve as one of the best coincident indicators of broader market regime change - when profitability begins to fade, it often signals a transition to drawn out unfavorable trend trading conditions. The Equity Curve as a Market Signal Within the Impulse Tracker, a continuous equity curve is calculated based upon the system's allocation to the strongest tokens. This equity curve effectively tracks the system’s performance under all market conditions. However, instead of solely relying on the direct performance of the selected tokens, the system applies additional filters to analyze the trend strength of this equity curve itself. In the same way you only want to purchase an asset that is moving up in price, you only want to allocate capital to a strategy whose equity curve is trending upwards! The Equity Curve Activation Filter consistently monitors the trend of this equity curve through various filter indicators, such as the “Wave Pendulum Trend”, the “Quasar QSM” and the “MAQSM” (an aggregate of multiple types of averages). These filters help determine whether the equity curve is trending upwards, signaling a favorable period for trend following. When the equity curve is in a positive trend, capital is allocated to the system as normal - allowing it to capture gains during favorable market conditions, Conversely, when the trend weakens and the equity curves begins to stagnate or decline, the activation filter shifts the system into a “cash” positions - temporarily halting allocations in order to prevent market exposure during choppy or mean reverting phases. Timing Allocation With Market Conditions This unique filtering approach ensures that the system is primarily active during periods when market trends are most supportive. By aligning capital allocations with the uptrend in trend following profitability, the system is designed to enter during periods of strong momentum and move to cash when momentum with the equity curve wanes. This approach reduces the risk of overtrading in less favorable conditions and preserves capital for the next favorable trend. In essence the Equity Curve Allocation Filter serves as a dynamic risk management layer that leverages the cyclicality of trend following profitability in order to navigate shifting market phases. Sensitivity and Signal Responsiveness: The Quasar Sensitivity Setting allows users to fine-tune the system’s responsiveness to asset signals. High sensitivity settings lead to quicker position changes, making the system highly reactive to short term strength impulses. This is especially useful in fast moving markets where token strength can shift rapidly. The Sensitive setting might be more applicable to higher volatility or lower market cap assets - as the increased volatility increases the necessity of faster position cutting in order to front run the crowd. Of course - a balanced approach is ideal, as if the signals are too fast there will be too many whips and false signals. (And extra fees + slippage!) The benefit of this script is because of the advanced slippage calculations, false signals are sufficiently punished (unlike systems without fees or slippage) - so it will become immediately apparent if the false signals have a significantly detrimental impact on the system’s equity curve. Asset specific signals within each category are re-evaluated after the close of each bar to ensure that capital is always allocated to the highest performing asset. If a token’s momentum begins to fade the system swiftly reallocates to the next strongest asset within that category. Category Filter - Allocates only to the Strongest Asset per group One of the core innovations of the AI x Meme Impulse Tracker is the customizable Category Filter, which ensures that only the strongest-performing asset within each predefined group receives capital allocation. This approach not only increases the precision of asset selection but also allows traders to tailor the system to specific token narratives or categories. Sectors can include trending themes such as high-attention meme tokens, AI-driven tokens, or even categorize assets by blockchain ecosystems like Ethereum, Solana, or Base chain. This flexibility enables users to align their strategies with the latest market narratives or to optimize for specific groups, focusing on high-beta tokens within well defined sectors for a more targeted exposure. By keeping the focus on category leaders, the system avoids diluting its impact across underperforming assets, thereby maximizing capital efficiency and reducing unnecessary trading costs. Dynamic Asset Reallocation: Dynamic reallocation ensures that the system remains nimble and adapts to changing market conditions. Unlike slower systems, the Quasar method continually monitors for changes in asset strength and reallocates capital accordingly - ensuring that the system is always positioned in the highest performing assets within each category. Position Changes and Slippage: The Impulse Tracker places a strong emphasis on realistic simulation, prioritizing accuracy over inflated backtest results. This approach ensures that slippage is accounted for in a more aggressive manner than what may be experienced in real-world execution. Each position change within the system - whether it’s buying, selling, reallocating, or rebalancing between assets - incurs slippage. Slippage is applied to both ends of every transaction: when a position is entered and exited, and when reallocating capital from one token to another. This dynamic behavior is further enhanced by a customizable slippage/fees input, allowing users to simulate realistic transaction costs based on their own market conditions and execution behaviors. The slippage model works by applying a weighted slippage to the equity curve, taking into account the actual amount of capital being moved. Slippage is not applied in a blanket manner but rather in proportion to the allocation changes. For example, if the system reallocates from a single 100% position to two 50% allocations, slippage will be applied to the 50% removed from the first asset and the 50% added to the new asset, resulting in a 1x slippage multiplier. This process becomes more granular when multiple assets are involved. For instance, if reallocating from two 50% positions to three 33% positions, slippage will be incurred on each of the changes, but at a reduced rate (⅔ x slippage), reflecting the smaller percentage of portfolio equity being moved. The slippage model accounts for all types of allocation shifts, whether increasing or decreasing the number of tokens held, providing a realistic assessment of system costs. Here are some detailed examples to illustrate how slippage is calculated based on different scenarios: 100% → 50% / 50%: 1x slippage applied to both position changes (2 allocation changes). 50% / 50% → 33% / 33% / 33%: ⅔ x slippage multiplier applied across 3 allocation changes. 33% / 33% / 33% → 100%: 4/3 x slippage multiplier applied across 3 allocation changes. In practice, not every position change will be rebalanced perfectly, leading to a lower number of transactions and lower costs in practice. Additionally, with the use of limit orders, a trader can easily reduce the costs of entering a position, as well as ensuring a competitive entry price. By simulating slippage in this granular manner, the system captures the absolute maximum level of fees and slippage, in order to ensure that backtest results lean towards an underrepresentation - opposed to inflated results compared with practical execution. A Special Note on Slippage In the image above, the system has been applied to four different timeframes - 20h, 15h, 10h, and 5h - using identical settings and a selected slippage amount of 2%. By isolating a recent trend leg, we can illustrate an important concept: while the 15h timeframe is more profitable than the 20h timeframe, this difference stems from a core trading principle. Lower timeframes typically provide more data points and allow for quicker entries and exits in a robust system. This often results in reduced downside and compounding of gains. However, slippage, fees, and execution constraints are limiting factors, especially in volatile, low-cap cryptocurrencies. Although lower timeframes can improve performance by increasing trade frequency, each trade incurs heavy slippage costs that accumulate - impacting the portfolio’s capital at a compounding rate. In this example, the chosen slippage rate of 2% per trade is designed to reflect the realistic trading costs, emphasizing how lower timeframe trading comes at the cost of increased slippage and fees Finding the optimal balance between timeframe and slippage impact requires careful consideration of factors such as portfolio size, liquidity of selected tokens, execution speed, and the fee rate of the exchange you execute trades on. Equity Curve and Performance Calculations To provide a benchmark, the script also generates a Buy-and-Hold (or "HODL") equity curve that represents a complete allocation to Bitcoin. This allows users to easily compare the performance of the dynamic rotation system with that more traditional benchmark strategy. The script tracks key performance metrics for both the dynamic portfolio and the HODL strategy, including: Sharpe Ratio The Sharpe Ratio is a key metric that evaluates a portfolio’s risk-adjusted return by comparing its ‘excess’ return to its volatility. Traditionally, the Sharpe Ratio measures returns relative to a risk-free rate. However, in our system’s calculation, we omit the risk-free rate and instead measure returns above a benchmark of 0%. This adjustment provides a more universal comparison, especially in the context of highly volatile assets like cryptocurrencies, where a traditional risk-free benchmark, such as the usual 3-month T-bills, is often irrelevant or too distant from the realities of the crypto market. By using 0% as the baseline, we focus purely on the strategy's ability to generate raw returns in the face of market risk, which makes it easier to compare performance across different strategies or asset classes. In an environment like cryptocurrency, where volatility can be extreme, the importance of relative return against a highly volatile backdrop outweighs comparisons to a risk-free rate that bears little resemblance to the risk profile of digital assets. Sortino Ratio The Sortino Ratio improves upon the Sharpe Ratio by specifically targeting downside risk and leaves the upside potential untouched. In contrast to the Sharpe Ratio (which penalizes both upside and downside volatility), the Sortino Ratio focuses only on negative return deviations. This makes it a more suitable metric for evaluating strategies like the AI x Meme Impulse Tracker - that aim to minimize drawdowns without restricting upside capture. By measuring returns relative to a 0% baseline, the Sortino ratio provides a clearer assessment of how well the system generates gains while avoiding substantial losses in highly volatile markets like crypto. Omega Ratio The Omega Ratio is calculated as the ratio of gains to losses across all return thresholds, providing a more complete view of how the system balances upside and downside risk even compared to the Sortino Ratio. While it achieves a similar outcome to the Sortino Ratio by emphasizing the system's ability to capture gains while limiting losses, it is technically a mathematically superior method. However, we include both the Omega and Sortino ratios in our metric table, as the Sortino Ratio remains more widely recognized and commonly understood by traders and investors of all levels. Usage Summary: While the backtests in this description are generated as if a trader held a portfolio of just the strongest tokens, this was mainly designed as a method of logical verification and not a recommended investment strategy. In practice, this system can be used in multiple ways. It can be used as above, or as a factor in forming part of a broader asset selection system, or even a method of filtering tokens by strength in order to inform a day trader which tokens might be optimal to look for long-only trading setups on an intrabar timeframe. Final Summary: The AI x Meme Impulse Tracker is a powerful algorithm that leverages a unique strength and impulse based approach to asset allocation within high beta token categories. Built with a robust risk management framework, the system’s Equity Curve Activation Filter dynamically manages capital exposure based on the cyclical nature of market trends, minimizing exposure during weaker phases. With highly customizable settings, the Impulse Tracker enables precise capital allocation to only the strongest assets, informed by real-time metrics and rigorous slippage modeling in order to provide the best view of historical profitability. This adaptable design, coupled with advanced performance analytics, makes it a versatile tool for traders seeking an edge in fast moving and volatile crypto markets. Pine Script® Indikatorvon CryptosystemsAktualisiert 22123
AI Moving Average (Expo)█ Overview The AI Moving Average indicator is a trading tool that uses an AI-based K-nearest neighbors (KNN) algorithm to analyze and interpret patterns in price data. It combines the logic of a traditional moving average with artificial intelligence, creating an adaptive and robust indicator that can identify strong trends and key market levels. █ How It Works The algorithm collects data points and applies a KNN-weighted approach to classify price movement as either bullish or bearish. For each data point, the algorithm checks if the price is above or below the calculated moving average. If the price is above the moving average, it's labeled as bullish (1), and if it's below, it's labeled as bearish (0). The K-Nearest Neighbors (KNN) is an instance-based learning algorithm used in classification and regression tasks. It works on a principle of voting, where a new data point is classified based on the majority label of its 'k' nearest neighbors. The algorithm's use of a KNN-weighted approach adds a layer of intelligence to the traditional moving average analysis. By considering not just the price relative to a moving average but also taking into account the relationships and similarities between different data points, it offers a nuanced and robust classification of price movements. This combination of data collection, labeling, and KNN-weighted classification turns the AI Moving Average (Expo) Indicator into a dynamic tool that can adapt to changing market conditions, making it suitable for various trading strategies and market environments. █ How to Use Dynamic Trend Recognition The color-coded moving average line helps traders quickly identify market trends. Green represents bullish, red for bearish, and blue for neutrality. Trend Strength By adjusting certain settings within the AI Moving Average (Expo) Indicator, such as using a higher 'k' value and increasing the number of data points, traders can gain real-time insights into strong trends. A higher 'k' value makes the prediction model more resilient to noise, emphasizing pronounced trends, while more data points provide a comprehensive view of the market direction. Together, these adjustments enable the indicator to display only robust trends on the chart, allowing traders to focus exclusively on significant market movements and strong trends. Key SR Levels Traders can utilize the indicator to identify key support and resistance levels that are derived from the prevailing trend movement. The derived support and resistance levels are not just based on historical data but are dynamically adjusted with the current trend, making them highly responsive to market changes. █ Settings k (Neighbors): Number of neighbors in the KNN algorithm. Increasing 'k' makes predictions more resilient to noise but may decrease sensitivity to local variations. n (DataPoints): Number of data points considered in AI analysis. This affects how the AI interprets patterns in the price data. maType (Select MA): Type of moving average applied. Options allow for different smoothing techniques to emphasize or dampen aspects of price movement. length: Length of the moving average. A greater length creates a smoother curve but might lag recent price changes. dataToClassify: Source data for classifying price as bullish or bearish. It can be adjusted to consider different aspects of price information dataForMovingAverage: Source data for calculating the moving average. Different selections may emphasize different aspects of price movement. ----------------- Disclaimer The information contained in my Scripts/Indicators/Ideas/Algos/Systems does not constitute financial advice or a solicitation to buy or sell any securities of any type. I will not accept liability for any loss or damage, including without limitation any loss of profit, which may arise directly or indirectly from the use of or reliance on such information. All investments involve risk, and the past performance of a security, industry, sector, market, financial product, trading strategy, backtest, or individual's trading does not guarantee future results or returns. Investors are fully responsible for any investment decisions they make. Such decisions should be based solely on an evaluation of their financial circumstances, investment objectives, risk tolerance, and liquidity needs. My Scripts/Indicators/Ideas/Algos/Systems are only for educational purposes! Pine Script® Indikatorvon ZeiiermanAktualisiert 1616 4 K
AI Brahmastra with SMC by Pooja V22🚀 AI Brahmastra with SMC by Pooja v22 Invite-Only | Rule-Based Market Structure & Momentum Indicator 📌 What this indicator is (clear definition) AI Brahmastra with SMC v22 is a closed-source, rule-based technical analysis indicator designed to filter low-quality market conditions and highlight high-probability structural and momentum alignment. It is not a strategy, does not execute trades, and does not provide fixed targets or stop-losses. The indicator functions strictly as a decision-support tool, where signals appear only after all predefined rules are satisfied on a confirmed candle close. The primary objective is signal validation and rejection, not signal frequency. 🎯 Intended Use & Markets Designed for traders who focus on: Market structure (SMC) Trend alignment Momentum & volatility confirmation Intraday and positional analysis Optimised for: Indian equity markets Index derivatives (NIFTY, BANKNIFTY, FINNIFTY) NSE stocks Futures & commodities 🧠 What “AI” means in this indicator (important clarification) The term “AI” does NOT refer to machine learning, prediction, or data fitting. In this script, AI refers to a rule-driven decision engine that: Evaluates multiple independent conditions simultaneously Uses state-based logic (past signal state affects future eligibility) Actively rejects signals unless context, momentum, volatility, and structure align In short: 👉 The script decides whether a signal is allowed or blocked, instead of blindly triggering on single conditions. 🔗 Why multiple indicators are combined (not a mashup) Each component has a non-overlapping role. No indicator is used to “confirm itself”. EMA (Trend Bias) Defines directional market bias Blocks counter-trend signals early VWAP (Fair-Price Filter) Ensures entries are aligned with institutional mean price Prevents chasing overextended moves Supertrend (Trend Continuation Context) Confirms directional persistence Helps avoid premature reversals RSI + RSI-MA (Momentum Quality) RSI direction alone is not enough RSI-MA distance filters weak momentum RSI-MA slope filters flat / sideways conditions ADX (Market Energy) Confirms whether the market has sufficient strength Blocks signals in low-energy or sideways phases ATR (Volatility Context) Confirms whether price movement is meaningful Helps avoid signals during compressed ranges 👉 No single indicator can generate a signal independently. Signals are allowed only when these components agree together. 🧱 Market Structure Engine (SMC Logic) BOS — Break of Structure Detected using swing-based pivot highs and lows Confirms continuation of the prevailing structure Evaluated only after candle close CHoCH — Change of Character Detects structural shift against the prior trend Used as early contextual information CHoCH remains valid for a limited number of bars ⚠️ BOS and CHoCH are contextual structure references, not standalone trade signals. ⚡ Partial Signal System (Context, not entries) Instead of showing only final Buy/Sell signals, the indicator provides partial signals that reflect setup development: B1 / S1 → CHoCH + RSI B2 / S2 → EMA + VWAP + Supertrend + RSI B3 / S3 → EMA + VWAP + RSI B4 / S4 → Breakout alignment (RSI intentionally excluded) Each partial type: Represents a specific rule-set Can be enabled or disabled independently Does not imply trade execution 🛡 Noise & Fake-Breakout Protection (Core Design Goal) The script is specifically engineered to avoid false breakouts by using: Candle-close confirmation (non-repainting) RSI-MA minimum distance & slope filtering Optional ADX strength filter with recovery (grace) window Optional RSI divergence blocking Optional session-time exclusion Low-volatility, sideways, or unstable market conditions are intentionally filtered out. ⚙ Trading Modes (Different internal logic) Intraday Mode Direction resets at the start of each trading day Prevents repeated same-side entries Optional momentum-based reset logic Positional Mode Direction remains active until an opposite signal appears No daily reset Suitable for swing and higher-timeframe analysis These modes use different internal state handling, not cosmetic toggles. 📍 Traditional Pivot Points (Support & Resistance Context) Built-in Traditional Pivot Levels include: Auto / Daily / Weekly / Monthly anchoring Multi-year support (Quarterly, Yearly, etc.) Optional price labels Historical plotting control Pivot levels are never used to generate signals. They serve only as contextual support & resistance references. 📋 Trend Dashboard (Visual Aid) An optional dashboard displays: Trend state across multiple timeframes Bullish / Bearish / Neutral classification The dashboard is informational only and does not generate signals. 🔔 Alerts Supports: Confirmed signal alerts Partial signal alerts JSON-formatted webhook alerts All alerts trigger only on confirmed candle close. 🔐 Why Invite-Only & Closed-Source This script uses: Stateful signal control Multi-stage rule validation Structure persistence logic Partial-to-confirmed signal flow Source access is restricted solely to protect these internal mechanisms, not for promotion. ⚠ Disclaimer This indicator is provided for educational and analytical purposes only. It does not constitute financial advice and does not guarantee results. All trading decisions and risk management remain the user’s responsibility.Pine Script® Indikatorvon financegurupoojaAktualisiert 35
AI Probabilistic OrderFlow Scalper⭐ Main Name AI Probabilistic OrderFlow Scalper ⭐Description: 📌 AI Probabilistic OrderFlow Scalper — Predictive Auction Theory Model for Futures This script combines Order Flow, Auction Market Theory, Volume Imbalance, Market Structure (HH/LL), RSI bias filtering, and a probability-based direction model inspired by AI and Revenue Management. It produces high-precision scalping entries designed for fast markets such as Nasdaq Futures (NQ), while remaining compatible with all markets (indices, crypto, forex, metals). This is not a typical indicator — it is a probabilistic predictive model engineered to provide sniper entries, a tick-based Take Profit, a volatility-adaptive ATR Stop Loss, and optional Value Area levels (VAH/VAL/POC). ⭐ Main Features 🔥 Directional probability model (AI-style weighted scoring) 📊 Order Flow imbalance (delta-like logic) 📈 HH/LL market structure detection 🎯 Smart RSI bias filter 🚀 One signal per trend shift (anti-spam) 🎯 Tick-based Take Profit (perfect for NQ / futures) 🛡️ ATR-based dynamic Stop Loss 📉 Value Area display: VAH, VAL, POC 🔊 Volume confirmation filter 📡 Directional probability plot ✔️ Works for Futures, Crypto, Forex, Indices 🧠 Probabilistic AI Approach The model uses a 3-factor scoring system: Order Flow imbalance Market structure (HH/LL) RSI trend bias Each validated condition = 1 point. The total score is converted into Buy/Sell probabilities, and the higher-probability direction is selected. When probability exceeds the threshold (e.g. 80%), the system triggers a high-confidence sniper signal. This mirrors Hight probability decision: → Only take a decision when probability of success is maximized. 🎯 Buy/Sell Signals (Sniper Entries) 🔵 Green triangle under the candle = high-probability Buy 🔴 Red triangle above the candle = high-probability Sell ✔️ Only one signal per directional shift ✔️ Signals appear only when all strict filters are satisfied 📌 Automatic TP / SL TP: fixed tick-based (e.g. 100 ticks for NQ scalping) SL: ATR-based, adapts to volatility TP/SL display can be enabled or disabled Perfectly calibrated for high-speed scalping. 📘 How to Use Use any timeframe Adjust probability threshold (75–90 recommended) Enable strict mode for maximum precision Let the model filter entries automatically Choose a TP suitable for your market Optionally display VAH/VAL/POC for Auction Theory context Always test using backtesting before going live 🏆 Advantages Extremely fast for scalping High win-rate potential via probabilistic filtering Clean signals (no noise or spam) Combines the strongest trading frameworks: Order Flow Market Structure Statistical modeling Volume profiling Automated risk management Pine Script® Indikatorvon mounir438Aktualisiert 81
AI-Powered ScalpMaster Pro [By TraderMan]🧠 AI-Powered ScalpMaster Pro How It Works 📊 What Is the Indicator and What Does It Do? 🧠 AI-Powered ScalpMaster Pro is a powerful technical analysis tool designed for scalping (short-term, fast-paced trading) in financial markets such as forex, crypto, or stocks. It combines multiple technical indicators (RSI, MACD, Stochastic, Momentum, EMA, SuperTrend, CCI, and OBV) to identify market trends and generate AI-driven buy (🟢) or sell (🔴) signals. The goal is to help traders seize profitable scalping opportunities with quick and precise decisions. 🚀 Key Features: 🧠 AI-Driven Logic: Analyzes signals from multiple indicators to produce reliable trend signals. 📈 Signal Strength: Displays buy (bull) and sell (bear) signal strength as percentages. ✅ Success Rate: Tracks the performance of the last 5 trades and calculates the success rate. 🎯 Entry, TP, and SL Levels: Automatically sets entry points, take profit (TP), and stop loss (SL) levels. 📏 EMA Zone: Analyzes price movement around the EMA 200 to confirm trend direction. ⚙️ How Does It Work? The indicator uses a scoring system by combining the following technical indicators: RSI (14): Evaluates whether the price is in overbought or oversold zones. MACD (12, 26, 9): Analyzes trend direction and momentum. Stochastic (%K): Measures the speed of price movement. Momentum: Checks the price change over the last 10 bars. EMA 200: Determines the long-term trend direction. SuperTrend: Tracks trends based on volatility. CCI (20): Measures price deviation from its normal range. OBV ROC: Analyzes volume changes. Each indicator generates a buy (bull) or sell (bear) signal. If 6 or more indicators align in the same direction (e.g., bullScore >= 6 for buy), the indicator produces a strong trend signal: 📈 Strong Buy Signal: bullScore >= 6 and bullScore > bearScore. 📉 Strong Sell Signal: bearScore >= 6 and bearScore > bullScore. 🔸 Neutral: No dominant direction. Additionally, the EMA Zone feature confirms the trend based on the price’s position relative to a zone around the EMA 200: Price above the zone and sufficiently distant → Uptrend (UP). 🟢 Price below the zone and sufficiently distant → Downtrend (DOWN). 🔴 Price within the zone → Neutral. 🔸 🖥️ Display on the Chart Table: A table in the top-right corner shows the status of all indicators (✅ Buy / ❌ Sell), signal strength (as %), success rate, and results of the last 5 trades. Lines and Labels: 🎯 Entry Level: A gray line at the price level when a new signal is generated. 🟢 TP (Take Profit): A green line showing the take-profit level. 🔴 SL (Stop Loss): A red line showing the stop-loss level. EMA Zone: The EMA 200 and its surrounding colored zone visualize the trend direction (green: uptrend, red: downtrend, gray: neutral). 📝 How to Use It? Platform Setup: Add the indicator to the TradingView platform. Customize settings as needed (e.g., EMA length, risk/reward ratio). Monitoring Signals: Check the table: Look for 📈 STRONG BUY or 📉 STRONG SELL signals to prepare for a trade. AI Text: Trust signals more when it says "🧠 FULL CONFIDENCE" (success rate ≥ 50%). Be cautious if it says "⚠️ LOW CONFIDENCE." Entering a Position: 🟢 Buy Signal: Table shows "📈 STRONG BUY" and bullScore >= 6. Price is above the EMA Zone (green zone). Entry: Current price (🎯 entry line). TP: 2% above the entry price (🟢 TP line). SL: 1% below the entry price (🔴 SL line). 🔴 Sell Signal: Table shows "📉 STRONG SELL" and bearScore >= 6. Price is below the EMA Zone (red zone). Entry: Current price (🎯 entry line). TP: 2% below the entry price (🟢 TP line). SL: 1% above the entry price (🔴 SL line). Position Management: If the price hits TP, the trade closes profitably (✅ Successful). If the price hits SL, the trade closes with a loss (❌ Failed). Results are updated in the "Last 5 Trades" section of the table. Risk Management: Default risk/reward ratio is 1:2 (1% risk, 2% reward). Always adjust position size based on your capital. Consider smaller lot sizes for "⚠️ LOW CONFIDENCE" signals. 💡 Tips Timeframe: Use 1-minute, 5-minute, or 15-minute charts for scalping. Market Selection: Works best in volatile markets (e.g., BTC/USD, EUR/USD). Confirmation: Ensure the EMA Zone trend aligns with the signal. Discipline: Stick to TP and SL levels, avoid emotional decisions. ⚠️ Warnings No indicator is 100% accurate. Always use additional analysis (e.g., support/resistance). Be cautious during high-volatility periods (e.g., news events). The success rate is based on past performance and does not guarantee future results.Pine Script® Indikatorvon Traderman_199333343
AI Chakra for Global Markets by Pooja🔮 AI Chakra for Global Markets — by Pooja Invite-Only | Rule-Based Market Structure & Momentum Indicator 🔹 What this indicator actually does AI Chakra is a rule-based indicator that generates Auto Buy / Auto Sell signals only when predefined rules across trend, momentum, volatility and structure are satisfied together. It is not a simple RSI, EMA or SMC indicator, and it is not a visual mash-up. Each component has a fixed role, and no signal is allowed unless all required rules pass. 🟢 AUTO BUY / 🔴 AUTO SELL — How signals are generated BUY signal is allowed ONLY when ALL rules below are true on candle close: Trend Rule Price above EMA trend structure EMA alignment confirms bullish bias Fair-Price Rule Price above VWAP (no buy below VWAP) Momentum Rule RSI above its moving average RSI–RSI-MA distance above minimum threshold RSI-MA slope positive (flat momentum blocked) Volatility Rule ADX confirms market strength ATR confirms sufficient price movement Low-energy / sideways markets are ignored Structure Rule Market structure is valid (BOS or active CHoCH context) No buy allowed against recent structure shift Candle Confirmation Rule Signal triggers only after candle close No intrabar or repaint signals If any single rule fails → NO BUY SIGNAL. SELL signal follows the same rules in the opposite direction. 🧠 What “AI” means here (no hype, no prediction) “AI” in this indicator does NOT mean machine learning or prediction. It refers to: Multi-rule decision logic State-based signal control Conditional signal rejection Context-aware validation instead of single-condition triggers 👉 The indicator decides whether a signal is allowed or rejected, similar to a rule engine. 📉 Fake Breakout Protection (Core Purpose) This indicator is specifically designed to avoid fake breakouts. Fake signals are blocked using: RSI distance + slope filter ADX strength validation ATR volatility requirement VWAP position filter Structure (BOS / CHoCH) alignment Low-volume, sideways and weak momentum moves are intentionally ignored. 🧱 Market Structure (SMC) — How it is used Break of Structure (BOS) Detected using swing highs / lows Confirms continuation of current trend Used as structure validation, not as a trade trigger Change of Character (CHoCH) Detected when price breaks previous structure Marks possible trend shift Remains valid only for limited bars ⚠️ BOS / CHoCH do not generate trades alone. They only allow or block signals from the main engine. 🔁 Partial Signals — Why they exist Instead of only final Buy/Sell, the indicator shows Partial Signals: CHoCH + RSI EMA + VWAP + RSI EMA + VWAP + Supertrend + RSI Breakout structure (RSI intentionally excluded) Partial signals: Do not mean trade entry Show which rules are already satisfied Help traders track setup development 📍 Support & Resistance (Context Only) Traditional Pivot Points Multi-timeframe calculation (Daily / Weekly / Monthly) Optional price labels Pivot levels: Never generate signals Used only as support / resistance reference 📐 Trendline Module (Optional) Trendlines drawn from swing points ATR / Std-Dev / Regression-based slope Extended forward for interaction zones Trendlines are contextual, not breakout triggers. ⚙️ Trading Modes (Different rule handling) Intraday Mode Direction resets daily Prevents repeated same-side signals in one session Positional Mode Direction stays active until opposite structure appears No daily reset Logic is different internally — not cosmetic. 🔔 Alerts Auto Buy / Auto Sell alerts Partial alerts available Candle-close only Non-repainting Webhook compatible 🔒 Why Invite-Only The script uses: Stateful signal logic Multi-rule validation Structure-based filters Partial-to-confirmed signal flow Source is restricted to protect these mechanisms. ⚠️ Disclaimer This indicator is for educational and analytical use only. It does not provide financial advice or trade recommendations. Risk management is the user’s responsibility.Pine Script® Indikatorvon financegurupoojaAktualisiert 10
AI Intraday Astra by Pooja v27📘 AI Intraday Astra v27 Invite-Only Intraday Indicator for Option Traders 🔍 What this indicator does (Purpose) AI Intraday Astra v27 is a rule-based intraday signal-filtering indicator designed to reduce false breakouts, repeated entries, and low-energy trades commonly faced by option traders. Unlike traditional indicators that generate frequent signals, this script focuses on signal validation and rejection, producing trades only when multiple market conditions align on the same confirmed candle. ⭐ What makes this indicator ORIGINAL This script is not a simple combination of indicators. It uses a state-based decision architecture, where signals are allowed only after passing multiple sequential checks and internal reset rules. Key originality points: Independent BUY and SELL engines (no shared oscillator state) State tracking to control signal eligibility Reset-based logic after every signal Multi-layer filtering instead of single-condition triggers This design differentiates it from standard RSI, EMA, or Supertrend-based scripts. ⚙️ Core Features (Explained Clearly) 🔹 Auto BUY / SELL Signals (Confirmed Only) Signals trigger only after candle close and only when all filters align. No intrabar repainting or blinking signals. 🔹 Dual RSI Engine (Buy & Sell Separation) Separate RSI + RSI-MA logic for Buy and Sell Minimum RSI-MA distance filter Directional slope validation Signal gap control ➡️ Prevents mixed or weak momentum signals. 🔹 ADX + ATR Volatility Filter ADX confirms directional strength ATR confirms sufficient intraday volatility ➡️ Blocks signals during sideways or low-energy markets. 🔹 EMA + VWAP Trend Alignment BUY only above EMA & VWAP SELL only below EMA & VWAP ➡️ Avoids counter-trend option entries. 🔹 Trendline-Based Structure Filter Dynamic trendlines derived from swing highs/lows Optional slope modes (ATR / Stdev / Linear Regression) Signals allowed only near relevant structure ➡️ Prevents chasing overextended prices. 🔹 Pivot Points (Support & Resistance Context) Traditional pivot levels Multi-timeframe calculation Optional price labels ➡️ Used for context, not direct signal generation. 🔹 Reset & Anti-Overtrading Logic After a signal: Price must break and re-accept across EMA Minimum bars enforced between same-side signals ➡️ Controls over-trading in strong trends. 🔹 Session Filter Optional disabling of signals during selected intraday time windows (e.g. noisy market open). 🧠 About “AI” This script does not use machine learning or prediction models. “AI” refers to a rule-based decision system that evaluates multiple market conditions together and allows a signal only when all rules remain valid until candle close. 🔔 Alerts BUY / SELL alerts on confirmed signals only Webhook-compatible No repaint behavior 👤 Who this is for Intraday option traders Traders who prefer quality over quantity Rule-based and confirmation-driven setups 🔒 Why Invite-Only The script contains internal state management, reset logic, and independent signal engines that go beyond standard indicator combinations. Source access is restricted to protect this implementation. ⚠️ Disclaimer This indicator is for educational and analytical purposes only. It does not provide financial advice or profit guarantees. Users are responsible for their own risk management.Pine Script® Indikatorvon financegurupoojaAktualisiert 10
AI Probabilistic OrderFlow Scalper⭐ Description: 📌 AI Probabilistic OrderFlow Scalper This script combines Order Flow, Auction Market Theory, Volume Imbalance, Market Structure (HH/LL), RSI bias filtering, and a probability-based direction model inspired by AI and statistics. It produces high-precision scalping entries designed for fast markets such as Futures, while remaining compatible with all markets (indices, crypto, forex, metals). This is not a typical indicator — it is a probabilistic predictive model engineered to provide sniper entries, a tick-based Take Profit, a volatility-adaptive ATR Stop Loss, and optional Value Area levels (VAH/VAL/POC). ⭐ Main Features: 🔥 Directional probability model (AI-style weighted scoring) 📊 Order Flow imbalance (delta-like logic) 📈 HH/LL market structure detection 🎯 Smart RSI bias filter 🚀 One signal per trend shift (anti-spam) 🎯 Tick-based Take Profit (perfect for NQ / futures) 🛡️ ATR-based dynamic Stop Loss 📉 Value Area display: VAH, VAL, POC 🔊 Volume confirmation filter 📡 Directional probability plot ✔️ Works for Futures, Crypto, Forex, Indices 🧠 Probabilistic AI Approach The model uses a 3-factor scoring system: Order Flow imbalance Market structure (HH/LL) RSI trend bias Each validated condition = 1 point. The total score is converted into Buy/Sell probabilities, and the higher-probability direction is selected. When probability exceeds the threshold (e.g. 80%), the system triggers a high-confidence sniper signal. This mirrors Revenue Management logic: → Only take a decision when probability of success is maximized. 🎯 Buy/Sell Signals (Sniper Entries) 🔵 Green triangle under the candle = high-probability Buy 🔴 Red triangle above the candle = high-probability Sell ✔️ Only one signal per directional shift ✔️ Signals appear only when all strict filters are satisfied 📌 Automatic TP / SL TP: fixed tick-based (e.g. 100 ticks for NQ scalping) SL: ATR-based, adapts to volatility TP/SL display can be enabled or disabled Perfectly calibrated for high-speed scalping. 📘 How to Use Use on every timeframe Adjust probability threshold (75–90 recommended) Enable strict mode for maximum precision Let the model filter entries automatically Choose a TP suitable for your market Optionally display VAH/VAL/POC for Auction Theory context Always test using backtesting before going live 🏆 Advantages Extremely fast for scalping High win-rate potential via probabilistic filtering Clean signals (no noise or spam) Combines the strongest trading frameworks: Order Flow Market Structure Statistical modeling Volume profiling Automated risk managementPine Script® Indikatorvon mounir438Aktualisiert 157
AI Trend Signal + Auto TrendLines [NinjADeviL]📈 AI Trend Signal + Auto TrendLines The AI Trend Signal + Auto TrendLines indicator combines smart automatic trendline detection with AI-based market structure analysis to deliver precise real-time entry and exit signals. 🧠 Key Features: 🔹 Automatically detects upward and downward trendlines based on dynamic swing analysis. 🔹 Highlights breakout zones with clear visual alerts. 🔹 Built-in AI engine to forecast early trend reversals. 🔹 Integrates Smart Money Concepts (BOS / CHoCH). 🔹 Dynamic background and color-coded visualization for bullish/bearish trends. 🔹 Works across all timeframes and asset classes — stocks, forex, indices, and crypto. ⚙️ Fully Customizable: Adjust colors, sensitivity, line styles, and alerts to fit your personal trading strategy and chart style. 💡 Perfect For: Traders looking to identify high-probability breakouts, trend reversals, and key structural points in the market with clarity and accuracy.Pine Script® Indikatorvon NinjaDeviL179