In den Scripts nach "KELTNER" suchen

Keltner Channel + RSIKeltner Channel and RSI use together. They tell us when the trend will turn.
Fave fun!!
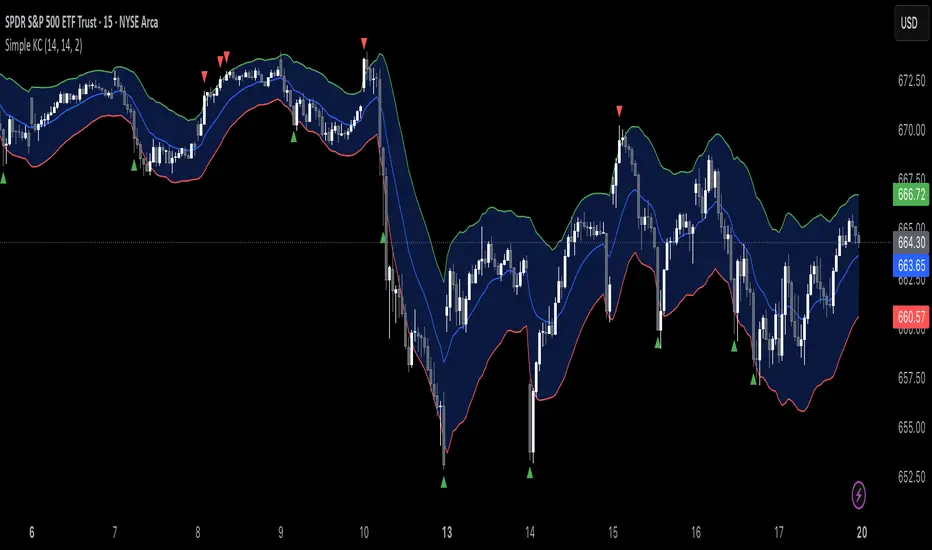
Simple Keltner ChannelsThis script is just a fun little project I decided to do. It serves as a way for me to practice my coding and was not made with the intent of making money.
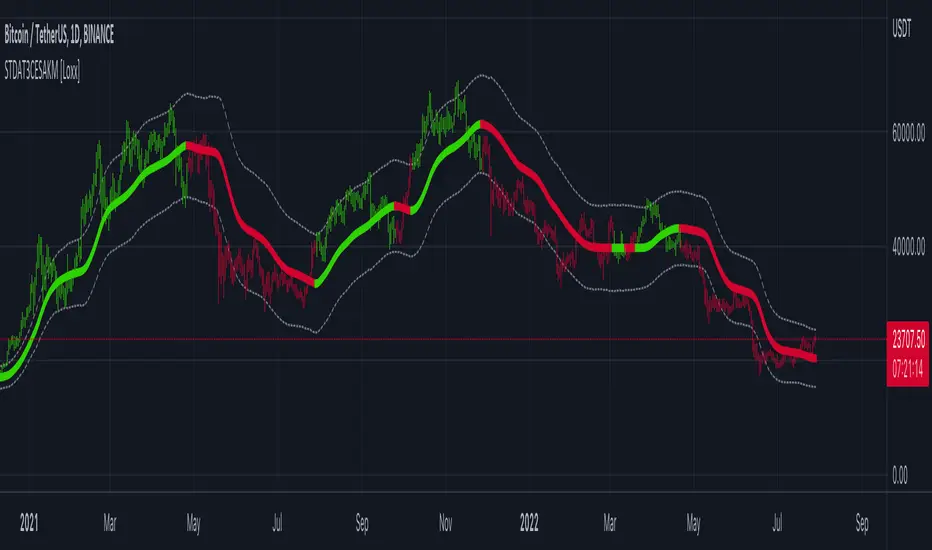
STD-Adaptive T3 Channel w/ Ehlers Swiss Army Knife Mod. [Loxx]STD-Adaptive T3 Channel w/ Ehlers Swiss Army Knife Mod. is an adaptive T3 indicator using standard deviation adaptivity and Ehlers Swiss Army Knife indicator to adjust the alpha value of the T3 calculation. This helps identify trends and reduce noise. In addition. I've included a Keltner Channel to show reversal/exhaustion zones.
What is the Swiss Army Knife Indicator?
John Ehlers explains the calculation here: www.mesasoftware.com
What is the T3 moving average?
Better Moving Averages Tim Tillson
November 1, 1998
Tim Tillson is a software project manager at Hewlett-Packard, with degrees in Mathematics and Computer Science. He has privately traded options and equities for 15 years.
Introduction
"Digital filtering includes the process of smoothing, predicting, differentiating, integrating, separation of signals, and removal of noise from a signal. Thus many people who do such things are actually using digital filters without realizing that they are; being unacquainted with the theory, they neither understand what they have done nor the possibilities of what they might have done."
This quote from R. W. Hamming applies to the vast majority of indicators in technical analysis . Moving averages, be they simple, weighted, or exponential, are lowpass filters; low frequency components in the signal pass through with little attenuation, while high frequencies are severely reduced.
"Oscillator" type indicators (such as MACD , Momentum, Relative Strength Index ) are another type of digital filter called a differentiator.
Tushar Chande has observed that many popular oscillators are highly correlated, which is sensible because they are trying to measure the rate of change of the underlying time series, i.e., are trying to be the first and second derivatives we all learned about in Calculus.
We use moving averages (lowpass filters) in technical analysis to remove the random noise from a time series, to discern the underlying trend or to determine prices at which we will take action. A perfect moving average would have two attributes:
It would be smooth, not sensitive to random noise in the underlying time series. Another way of saying this is that its derivative would not spuriously alternate between positive and negative values.
It would not lag behind the time series it is computed from. Lag, of course, produces late buy or sell signals that kill profits.
The only way one can compute a perfect moving average is to have knowledge of the future, and if we had that, we would buy one lottery ticket a week rather than trade!
Having said this, we can still improve on the conventional simple, weighted, or exponential moving averages. Here's how:
Two Interesting Moving Averages
We will examine two benchmark moving averages based on Linear Regression analysis.
In both cases, a Linear Regression line of length n is fitted to price data.
I call the first moving average ILRS, which stands for Integral of Linear Regression Slope. One simply integrates the slope of a linear regression line as it is successively fitted in a moving window of length n across the data, with the constant of integration being a simple moving average of the first n points. Put another way, the derivative of ILRS is the linear regression slope. Note that ILRS is not the same as a SMA ( simple moving average ) of length n, which is actually the midpoint of the linear regression line as it moves across the data.
We can measure the lag of moving averages with respect to a linear trend by computing how they behave when the input is a line with unit slope. Both SMA (n) and ILRS(n) have lag of n/2, but ILRS is much smoother than SMA .
Our second benchmark moving average is well known, called EPMA or End Point Moving Average. It is the endpoint of the linear regression line of length n as it is fitted across the data. EPMA hugs the data more closely than a simple or exponential moving average of the same length. The price we pay for this is that it is much noisier (less smooth) than ILRS, and it also has the annoying property that it overshoots the data when linear trends are present.
However, EPMA has a lag of 0 with respect to linear input! This makes sense because a linear regression line will fit linear input perfectly, and the endpoint of the LR line will be on the input line.
These two moving averages frame the tradeoffs that we are facing. On one extreme we have ILRS, which is very smooth and has considerable phase lag. EPMA has 0 phase lag, but is too noisy and overshoots. We would like to construct a better moving average which is as smooth as ILRS, but runs closer to where EPMA lies, without the overshoot.
A easy way to attempt this is to split the difference, i.e. use (ILRS(n)+EPMA(n))/2. This will give us a moving average (call it IE /2) which runs in between the two, has phase lag of n/4 but still inherits considerable noise from EPMA. IE /2 is inspirational, however. Can we build something that is comparable, but smoother? Figure 1 shows ILRS, EPMA, and IE /2.
Filter Techniques
Any thoughtful student of filter theory (or resolute experimenter) will have noticed that you can improve the smoothness of a filter by running it through itself multiple times, at the cost of increasing phase lag.
There is a complementary technique (called twicing by J.W. Tukey) which can be used to improve phase lag. If L stands for the operation of running data through a low pass filter, then twicing can be described by:
L' = L(time series) + L(time series - L(time series))
That is, we add a moving average of the difference between the input and the moving average to the moving average. This is algebraically equivalent to:
2L-L(L)
This is the Double Exponential Moving Average or DEMA , popularized by Patrick Mulloy in TASAC (January/February 1994).
In our taxonomy, DEMA has some phase lag (although it exponentially approaches 0) and is somewhat noisy, comparable to IE /2 indicator.
We will use these two techniques to construct our better moving average, after we explore the first one a little more closely.
Fixing Overshoot
An n-day EMA has smoothing constant alpha=2/(n+1) and a lag of (n-1)/2.
Thus EMA (3) has lag 1, and EMA (11) has lag 5. Figure 2 shows that, if I am willing to incur 5 days of lag, I get a smoother moving average if I run EMA (3) through itself 5 times than if I just take EMA (11) once.
This suggests that if EPMA and DEMA have 0 or low lag, why not run fast versions (eg DEMA (3)) through themselves many times to achieve a smooth result? The problem is that multiple runs though these filters increase their tendency to overshoot the data, giving an unusable result. This is because the amplitude response of DEMA and EPMA is greater than 1 at certain frequencies, giving a gain of much greater than 1 at these frequencies when run though themselves multiple times. Figure 3 shows DEMA (7) and EPMA(7) run through themselves 3 times. DEMA^3 has serious overshoot, and EPMA^3 is terrible.
The solution to the overshoot problem is to recall what we are doing with twicing:
DEMA (n) = EMA (n) + EMA (time series - EMA (n))
The second term is adding, in effect, a smooth version of the derivative to the EMA to achieve DEMA . The derivative term determines how hot the moving average's response to linear trends will be. We need to simply turn down the volume to achieve our basic building block:
EMA (n) + EMA (time series - EMA (n))*.7;
This is algebraically the same as:
EMA (n)*1.7-EMA( EMA (n))*.7;
I have chosen .7 as my volume factor, but the general formula (which I call "Generalized Dema") is:
GD (n,v) = EMA (n)*(1+v)-EMA( EMA (n))*v,
Where v ranges between 0 and 1. When v=0, GD is just an EMA , and when v=1, GD is DEMA . In between, GD is a cooler DEMA . By using a value for v less than 1 (I like .7), we cure the multiple DEMA overshoot problem, at the cost of accepting some additional phase delay. Now we can run GD through itself multiple times to define a new, smoother moving average T3 that does not overshoot the data:
T3(n) = GD ( GD ( GD (n)))
In filter theory parlance, T3 is a six-pole non-linear Kalman filter. Kalman filters are ones which use the error (in this case (time series - EMA (n)) to correct themselves. In Technical Analysis , these are called Adaptive Moving Averages; they track the time series more aggressively when it is making large moves.
Included:
Bar coloring
Signals
Alerts
Loxx's Expanded Source Types
Keltner Hull Suite [QuantAlgo]🟢 Overview
The Keltner Hull Suite combines Hull Moving Average positioning with double-smoothed True Range banding to identify trend regimes and filter market noise. The indicator establishes upper and lower volatility bounds around the Hull MA, with the trend line conditionally updating only when price violates these boundaries. This mechanism distinguishes between genuine directional shifts and temporary price fluctuations, providing traders and investors with a systematic framework for trend identification that adapts to changing volatility conditions across multiple timeframes and asset classes.
🟢 How It Works
The calculation foundation begins with the Hull Moving Average, a weighted moving average designed to minimize lag while maintaining smoothness:
hullMA = ta.hma(priceSource, hullPeriod)
The indicator then calculates true range and applies dual exponential smoothing to create a volatility measure that responds more quickly to volatility changes than traditional ATR implementations while maintaining stability through the double-smoothing process:
tr = ta.tr(true)
smoothTR = ta.ema(tr, keltnerPeriod)
doubleSmooth = ta.ema(smoothTR, keltnerPeriod)
deviation = doubleSmooth * keltnerMultiplier
Dynamic support and resistance boundaries are constructed by applying the multiplier-scaled volatility deviation to the Hull MA, creating upper and lower bounds that expand during volatile periods and contract during consolidation:
upperBound = hullMA + deviation
lowerBound = hullMA - deviation
The trend line employs a conditional update mechanism that prevents premature trend reversals. The system maintains the current trend line until price action violates the respective boundary, at which point the trend line snaps to the violated bound:
if upperBound < trendLine
trendLine := upperBound
if lowerBound > trendLine
trendLine := lowerBound
Directional bias determination compares the current trend line value against its previous value, establishing bullish conditions when rising and bearish conditions when falling. Signal generation occurs on state transitions, triggering alerts when the trend state shifts from neutral or opposite direction:
trendUp = trendLine > trendLine
trendDown = trendLine < trendLine
longSignal = trendState == 1 and trendState != 1
shortSignal = trendState == -1 and trendState != -1
The visualization layer creates a trend band by plotting both the current trend line and a two-bar shifted version, with the area between them filled to create a visual channel that reinforces directional conviction.
🟢 How to Use This Indicator
▶ Long and Short Signals: The indicator generates long/buy signals when the trend state transitions to bullish (trend line begins rising) and short/sell signals when transitioning to bearish (trend line begins falling). These state changes represent structural shifts in momentum where price has broken through the adaptive volatility bands, confirming directional commitment.
▶ Trend Band Dynamics: The spacing between the main trend line and its shifted counterpart creates a visual band whose width reflects trend strength and momentum consistency. Expanding bands indicate accelerating directional movement and strong trend persistence, while contracting or flattening bands suggest decelerating momentum, potential trend exhaustion, or impending consolidation. Monitoring band width provides early warning of regime transitions from trending to range-bound conditions.
▶ Preconfigured Presets: Three optimized parameter sets accommodate different trading styles and timeframes. Default (14, 20, 2.0) provides balanced trend identification suitable for daily charts and swing trading, Fast Response (10, 14, 1.5) delivers aggressive signal generation optimized for intraday scalping and momentum trading on 1-15 minute timeframes, while Smooth Trend (18, 30, 2.5) offers conservative trend confirmation ideal for position trading on 4-hour to daily charts with enhanced noise filtration.
▶ Built-in Alerts: Three alert conditions enable automated monitoring - Bullish Trend Signal triggers on long setup confirmation, Bearish Trend Signal activates on short setup confirmation, and Trend Change alerts on any directional transition. These notifications allow you to respond to regime shifts without continuous chart monitoring.
▶ Color Customization: Five visual themes (Classic, Aqua, Cosmic, Ember, Neon, plus Custom) accommodate different chart backgrounds and display preferences, ensuring optimal contrast and visual clarity across trading environments.

Keltner Channels Linda RaschkeThis channel is a second version designed by the famous american analyst Linda Raschke; it allows you to find the main trend and to implement a trend-following strategy. You can open a new long/short position when the price cross up the basis and the upper/lower band (jointly with other indicators).

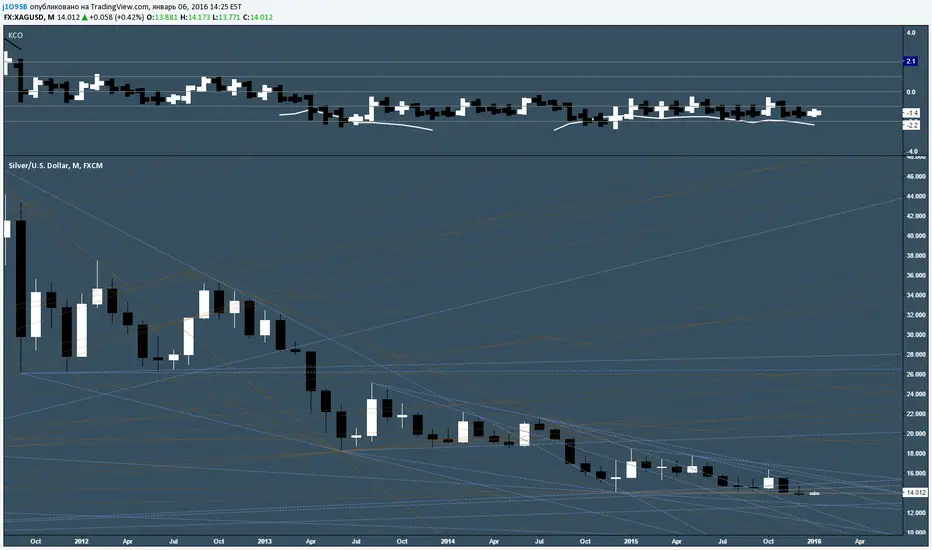
Keltner Channels Oscillator v3V2 with Bollinger Bands
Planning to make an STO/KCO hybrid and a model strategy for an all-in-one indicator.
Keltner Channel+EMA with Buy/Sell SignalsIndicator Name: Double Keltner Channel with EMA (Buy/Sell Signals)
Description:
This indicator is designed to help traders identify potential trend reversals and generate buy/sell signals in volatile markets. It combines two Keltner Channels with different sensitivities (multipliers of 2.6 and 3.8) to visualize dynamic support and resistance levels. The addition of a 20-period EMA helps confirm trend direction and filter out potential false signals.
How the Indicator Works:
• Keltner Channels: These bands dynamically adjust to changing market volatility, offering a visual representation of potential price ranges. The 2.6 multiplier Keltner Channel (KC) is more sensitive to price changes, potentially highlighting short-term reversals, while the 3.8 multiplier KC focuses on broader trend shifts.
• 20-period EMA: This widely used trend indicator helps smooth out price fluctuations and identify the underlying direction of the market.
• Buy Signals: Generated when a candle's low touches or crosses below either Keltner Channel's lower band, and within the next 6 candles, that same candle closes above the 20 EMA. This combination suggests a potential rejection of lower prices (support) and a possible resumption of the uptrend.
• Sell Signals: Mirror the buy signal logic but are triggered when the candle's high touches or crosses above either Keltner Channel's upper band and then closes below the 20 EMA within the next 6 candles. This indicates a potential rejection of higher prices (resistance) and a possible shift to a downtrend.
How to Use the Indicator:
1. Identify the Trend: Use the 20 EMA to determine the overall trend direction. Look for buy signals primarily in uptrends and sell signals in downtrends.
2. Confirm with RSI : While not included in this indicator, consider using a separate Relative Strength Index (RSI) with a length of 10, SMA type, MA length of 14, and standard deviation of 2. Look for oversold conditions (RSI below 20) to confirm buy signals and overbought conditions (RSI above 80) to confirm sell signals.
3.Apply Risk Management: Always use appropriate risk management techniques, such as stop-loss orders, to protect your capital.
Key Points:
• This indicator is most effective in trending markets.
• It is not a standalone trading system and should be used in conjunction with other analysis tools and confirmation.
• The Keltner Channel multiplier values can be adjusted to suit your trading style and risk tolerance.
Important Disclaimer:
This indicator is a modification of the original Keltner Channel code and is intended for educational and informational purposes only.
It does not constitute financial advice. Always conduct your own research and consult with a qualified financial advisor before making any investment decisions.

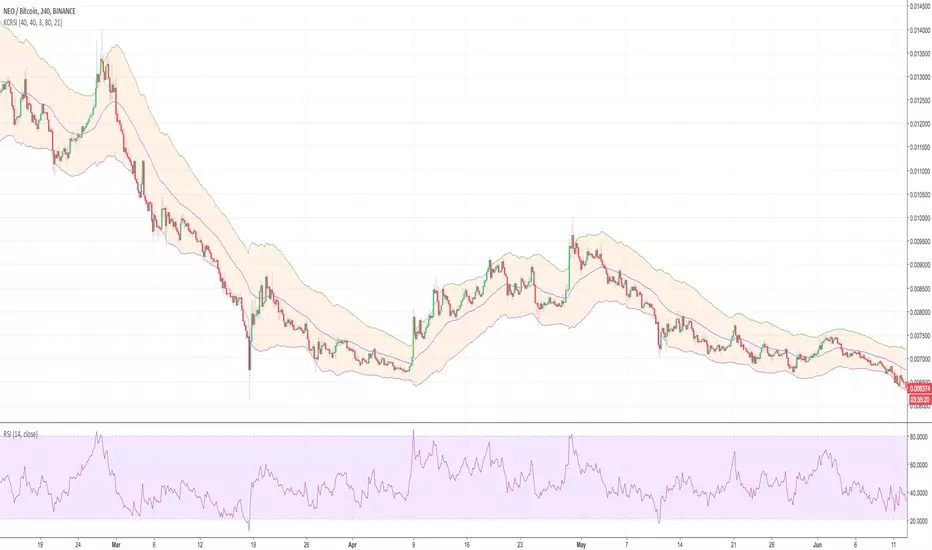
Keltner + RSI Bitcoin Futures Trading [luca_badoer]This indicator combines the power of the Keltner channel with the power of the Relative Strength Indicator (RSI). It can help understand when the market is entering a bullish or a bearish trend.
Normally a Keltner channel would reference an Exponential Moving Average (EMA) of the price. In this case the Keltner Channel in the "Keltner + RSI Bitcoin Futures Trading " references the EMA of the 14-day RSI (white line). On top of that it overlays a 7-day RSI line (blue line). This produces some signals that are particularly useful in 2h, 4h and 1 day charts. The signals consist in the 7-day RSI line (blue line) crossing the upper (green) or lower (red) Keltner channels as well as the middle (white) line. Depending on the direction of the crossing (up or down) and the RSI level (from 0 to 100) at which the crossing takes place this produces bullish or bearish signals.
Examples:
- Bullish crossing: 7-day RSI (blue) crosses both the lower (red) and middle (white) lines upwards at a low to neutral RSI level (<70%)
- Bearish crossing: 7-day RSI (blue) cross both the upper (green) and middle (white) lines downwards at a high to neutral RSI (>30%)
Recommendations:
- Better to use it in 2h, 4h, and 1-day charts, thought it can also be used in lower timeframes. Confirmations of crossings in higher time-frames provide more certainty about the direction of the move.
- Use in combination with Heikin Ashi candles and volume indicators.

Keltner Channel Volatility FilterOVERVIEW
The Keltner Channel Volatility Filter indicator is a technical indicator that gauges the amount of volatility currently present in the market. The purpose of this indicator is to filter out with-trend signals during ranging/non-trending/consolidating conditions.
CONCEPTS
This indicator assists traders in capitalizing on the assumption that trends are more likely to start during periods of high volatility compared to periods of low volatility . This is because high volatility indicates that there are bigger players currently in the market, which is necessary to begin a sustained trending move.
So, to determine whether the current volatility in the market is low, the KCVF will grey out all bars whose average price is within the Keltner Channels.
If the average price breaks out of the Keltner Channels , it is reasonable to assume we are in a high-volatility period. Thus, this is the ideal time to enter a trending trade due to the assumption that trends are more likely to start during these high-volatility periods.
HOW DO I READ THIS INDICATOR
When the candles are greyed out, don't take any trend trades since the current volatility is less than the usual volatility experienced in the market.
When the candles aren't greyed out, take all valid with-trend trades since the current volatility is greater than the usual volatility experienced in the market.

Keltner+Bollinger Squeeze [kingthies_]Keltner-Bollinger-Combo Squeeze
As you likely know, the bollinger squeeze comes from the bband indicator, a classic indicator in all forms of technical analysis, effectively measuring volatility of a given assets price movement.
There are different forms of the squeeze here on tradingview, and I've combined the Bollinger band indicator in my own strategy, to the alternative and similar appearing Keltner channels. The two work incredibly well together and I've used them in my analysis for years now as my core approach to understanding the technical side of the markets.
This tool will show users the result that i typically look for when assessing for potential volatile moves in the near future for an asset, and will highlight the chart + send an alert when the chart is something to look at and the indicator suggests incoming volatility may be in the near future.
The users will still need to assess themselves whether the squeeze they see is a bullish or bearish leaning, but the overall idea is to set it and forget it with the alert clause thats added in.
Personally i enjoy this with Heikin ashi inputs but use whichever preference you have, and all timeframes + tickers should apply here.
Cheers

Keltner Channel %KIndicator display where price is in relation to the bands of Keltner Channel (20,2)
A. Keltner Channe Info
1. Basis = EMA(close,20)
2. Upper Band = Basis + 2 x ATR(14)
3. Lower Band = Basis - 2 x ATR(14)
B. %K Info
1. %K Above 1 = Price is Above the Upper Band
2. %K Below 0 = Price is Below the Lower Band
3. %K Above 0.8 = Price is Nearing the Upper Band
4. %K Below 0.2 = Price is Nearing the Lower Band


Keltner Multi-Res TrendThis is an extension of the Keltner Trend indicator by jaggedsoft. I have added a some features including an EMA / SMA option, horizontal and vertical offsets, and the addition of a second instance of the trendicator of a higher timeframe. If you want to change any timeframe, just open the code and update that section of the script. Thanks, and I hope you find it useful or interesting at least.
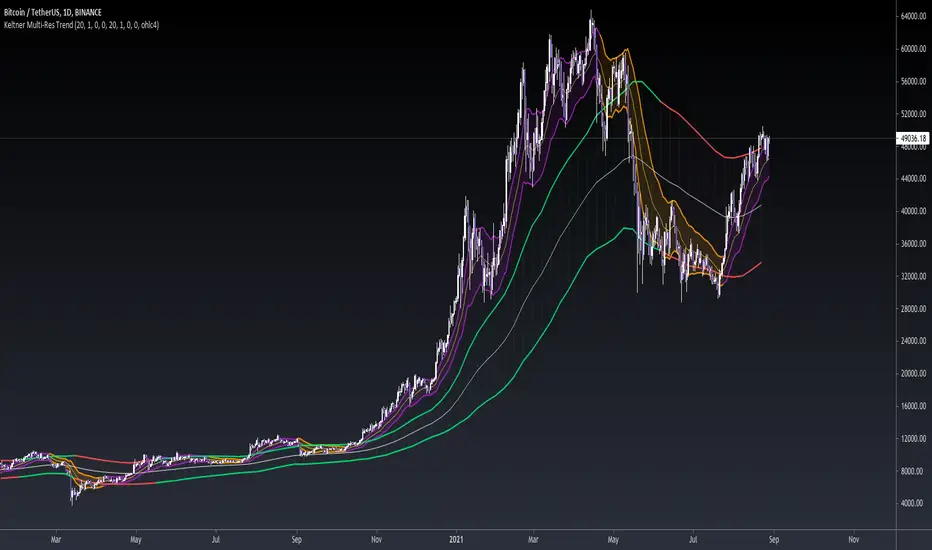
Keltner TrendThis indicator takes the concept of Keltner Channels and uses them as a trend following system by using a deviation band of 1 ATR, such that when the price closes above the upper band a bull trend is predicted to follow, and when the price closes below the lower band the start of a bear trend is assumed.
Only 1 band is plotted at all times depending on the bias of the trend.
Default settings are a 21 EMA as a centerline with a 13 period ATR.
Enjoy!


Keltner Channels Color BarsAnother tweak to a classic built-in script. Simply replacing the Keltner Channels overlay plot with color bars.

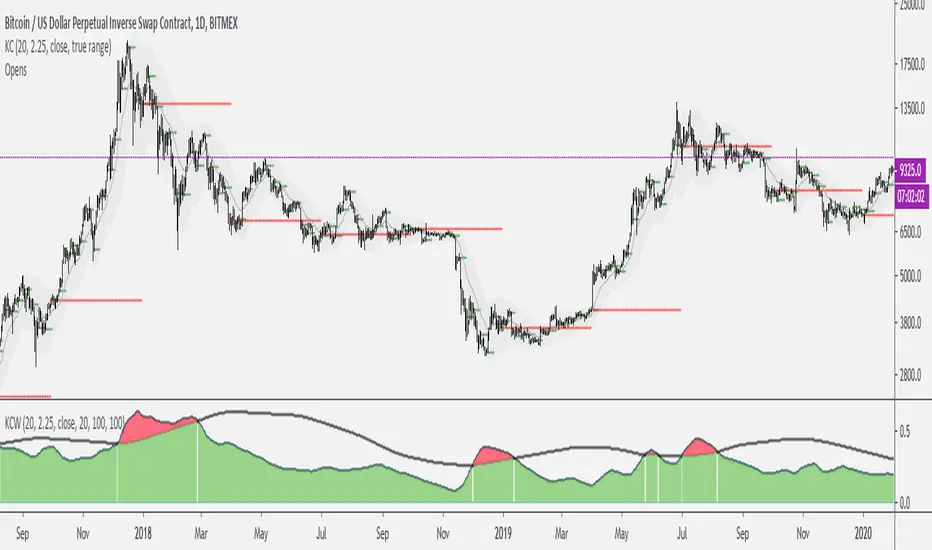
Keltner Channels WidthSimilar to bollinger bands width, but for keltner channels, designed to recognize when a move is exhausted and contraction is to be expected.
Would use it as a filter to stay out of any trades if the indicator peaks (red color).
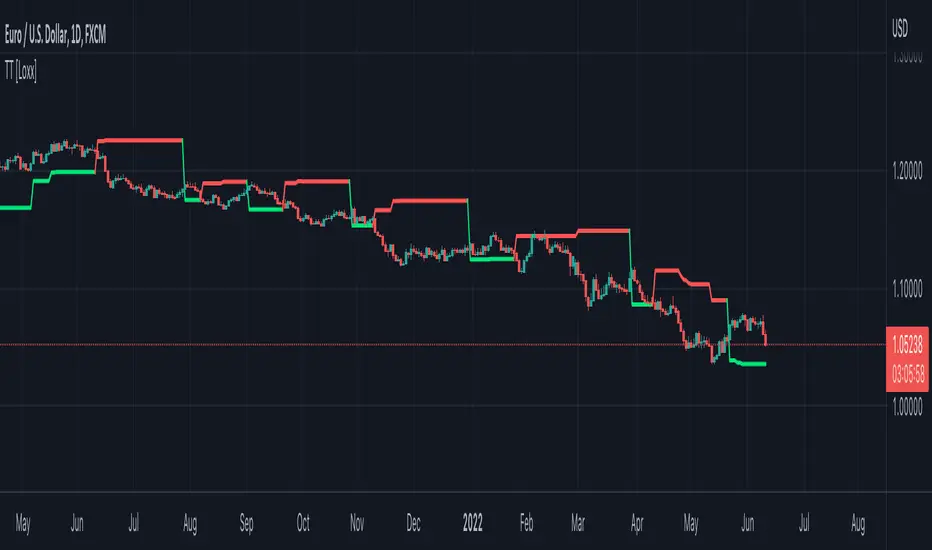
Top Trend [Loxx]Top Trend is a trend following indicator that signals breakouts and plots dynamic support and resistance levels.
Included:
-Calculation of Top Trend using either Bollinger Bands and Keltner Channels
This is an exact clone of the "TopTrend" for MT4 indicator
Volatility Compression BreakoutThe Volatility Compression Breakout indicator is designed to identify periods of low volatility followed by potential breakout opportunities in the market. It aims to capture moments when the price consolidates within a narrow range, indicating a decrease in volatility, and anticipates a subsequent expansion in price movement. This indicator can be applied to any financial instrument and timeframe.
When the close price is above both the Keltner Middle line and the Exponential Moving Average (EMA), the bars are colored lime green, indicating a potential bullish market sentiment. When the close price is positioned above the Keltner Middle but below the EMA, or below the Keltner Middle but above the EMA, the bars are colored yellow, signifying a neutral or indecisive market condition. Conversely, when the close price falls below both the Keltner Middle and the EMA, the bars are colored fuchsia, suggesting a potential bearish market sentiment.
Additionally, the coloration of the Keltner Middle line and the EMA provides further visual cues for assessing the trend. When the close price is above the Keltner Middle, the line is colored lime green, indicating a bullish trend. Conversely, when the close price is below the Keltner Middle, the line is colored fuchsia, highlighting a bearish trend. Similarly, the EMA line is colored lime green when the close price is above it, representing a bullish trend, and fuchsia when the close price is below it, indicating a bearish trend.
Parameters
-- Compression Period : This parameter determines the lookback period used to calculate the volatility compression. A larger value will consider a longer historical period for volatility analysis, potentially capturing broader market conditions. Conversely, a smaller value focuses on more recent price action, providing a more responsive signal to current market conditions.
-- Compression Multiplier : The compression multiplier is a factor applied to the Average True Range (ATR) to determine the width of the Keltner Channels. Increasing the multiplier expands the width of the channels, allowing for a larger price range before a breakout is triggered. Decreasing the multiplier tightens the channels and requires a narrower price range for a breakout signal.
-- EMA Period : This parameter sets the period for the Exponential Moving Average (EMA), which acts as a trend filter. The EMA helps identify the overall market trend and provides additional confirmation for potential breakouts. Adjusting the period allows you to capture shorter or longer-term trends, depending on your trading preferences.
How Changing Parameters Can Be Beneficial
Modifying the parameters allows you to adapt the indicator to different market conditions and trading styles. Increasing the compression period can help identify broader volatility patterns and major market shifts. On the other hand, decreasing the compression period provides more precise and timely signals for short-term traders.
Adjusting the compression multiplier affects the width of the Keltner Channels. Higher multipliers increase the breakout threshold, filtering out smaller price movements and providing more reliable signals during significant market shifts. Lower multipliers make the indicator more sensitive to smaller price ranges, generating more frequent but potentially less reliable signals.
The EMA period in the trend filter helps you align your trades with the prevailing market direction. Increasing the EMA period smoothes out the trend, filtering out shorter-term fluctuations and focusing on more sustained moves. Decreasing the EMA period allows for quicker responses to changes in trend, capturing shorter-term price swings.
Potential Downsides
While the Volatility Compression Breakout indicator can provide valuable insights into potential breakouts, it's important to note that no indicator guarantees accuracy or eliminates risk. False breakouts and whipsaw movements can occur, especially in volatile or choppy market conditions. It is recommended to combine this indicator with other technical analysis tools and consider fundamental factors to validate potential trade opportunities.
Making It Work for You
To maximize the effectiveness of the Volatility Compression Breakout indicator, consider the following:
-- Combine it with other indicators : Use complementary indicators such as trend lines, oscillators, or support and resistance levels to confirm signals and increase the probability of successful trades.
-- Practice risk management : Set appropriate stop-loss levels to protect your capital in case of false breakouts or adverse price movements. Consider implementing trailing stops or adjusting stop-loss levels as the trade progresses.
-- Validate with price action : Analyze the price action within the compression phase and look for signs of building momentum or weakening trends. Support your decisions by observing candlestick patterns and volume behavior during the breakout.
-- Backtest and optimize : Test the indicator's performance across different timeframes and market conditions. Optimize the parameters based on historical data to find the most suitable settings for your trading strategy.
Remember, no single indicator can guarantee consistent profitability, and it's essential to use the Volatility Compression Breakout indicator as part of a comprehensive trading plan. Regularly review and adapt your strategy based on market conditions and your trading experience. Monitor the indicator's performance and make necessary adjustments to parameter values if the market dynamics change.
By adjusting the parameters and incorporating additional analysis techniques, you can customize the indicator to suit your trading style and preferences. However, it is crucial to exercise caution, conduct thorough analysis, and practice proper risk management to increase the likelihood of successful trades. Remember that no indicator can guarantee profits, and continuous learning and adaptation are key to long-term trading success.

Cycle-Synced Channel Breakout📌 Cycle-Synced Channel Breakout – Detect Breakouts Confirmed by Candles and Momentum Cycles
📖 Overview
The Cycle-Synced Channel Breakout indicator is a precision breakout detection tool that combines the power of:
• Adaptive Keltner Channels
• Dominant Cycle Period Analysis (Ehlers-inspired)
• Candlestick Pattern Recognition (Engulfing)
This multi-layered approach helps identify true breakout opportunities by filtering out noise and false signals, making it ideal for swing traders and intraday traders seeking high-probability directional moves.
⚙️ How It Works
1. Keltner Channel Envelope
A dynamic volatility channel based on the EMA and ATR defines the upper and lower bounds of price movement.
2. Engulfing Candle Detection
The script detects strong bullish and bearish engulfing patterns, which often signal trend reversals or momentum continuations.
3. Dominant Cycle Momentum (Ehlers-inspired)
Using a smoothed power oscillator derived from a detrended price series, the indicator assesses whether momentum is accelerating during the breakout — filtering out weak moves.
4. Signal Confirmation Logic
A signal is only shown when:
• An engulfing pattern is detected, and
• Price breaks out of the Keltner Channel, and
• Momentum (cycle power) is rising
5. Visual Feedback
• Breakout signals are plotted with “BUY” or “SELL” labels
• Faded green/red background highlights confirmed breakouts
• Optional display of engulfing candles with triangle markers
⸻
🛠️ Key Features
• ✅ Adaptive Keltner Channels
• ✅ Bullish/Bearish Engulfing Candle Recognition
• ✅ Ehlers-style Cycle Momentum Confirmation
• ✅ Background highlights for confirmed breakouts
• ✅ Optional candle pattern visualization
• ✅ Lightweight and Pine v6 compatible
⸻
🧪 Inputs
• Keltner Length – EMA period for channel basis
• Multiplier – Multiplied with ATR to determine band width
• Cycle Lookback – Used to calculate smoothed cycle power
• Show Engulfing Candles? – Toggles candlestick signals
• Show Breakout Signals? – Toggles breakout labels and backgrounds
⸻
🧠 How to Use
• Look for “BUY” or “SELL” labels when:
• An engulfing candle breaks through the Keltner Channel
• Cycle momentum confirms strength behind the move
• The background color will faintly highlight the breakout direction.
• Use in combination with other trend or volume indicators for added confluence.
🔒 Notes
• This indicator is not repainting.
• It is designed for educational and research purposes only.
• Works across all timeframes and asset classes (stocks, crypto, forex, etc.)

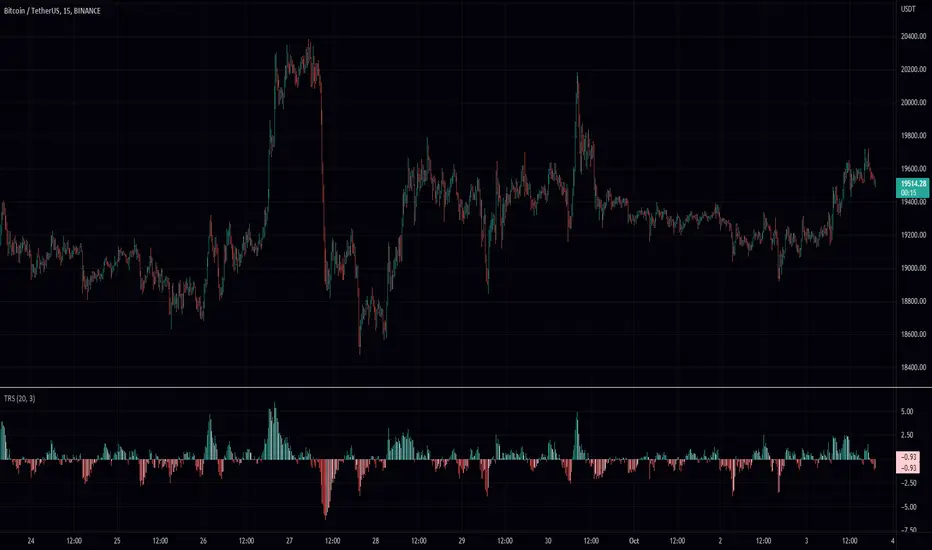
True Range ScoreTrue Range Score:
This study transforms the price similar to how z-score works. Instead of using the standard deviation to divide the difference of the source and the mean to determine the sources deviation from the mean we use the true range. This results in a score that directly relates to what multiplier you would be using with the Keltner Channel. This is useful for many applications.
One is the fact that it shows you the momentum of the price and how strong the price movement is. This is also a great metric of volatility. With this you can make a smart Keltner channel by multiplying the mean by the average true range 75th percentile of this score. I in fact do this in my automatic Keltner channel script. I hope this script is useful for you. Thank you for checking this out.
(Source - Mean)/True Range instead of (Source - Mean)/Standard Deviation
+ Magic Carpet BandsFun name for an indicator, eh? Well, it is true, I think; they look like magic carpets. They're actually pretty simple actually. They're Keltner Channels smoothed with a moving average. If you go down to the lookback period for the bands and set it to 1, you'll recognize them immediately.
Digging a bit deeper you see there are four magic carpets on the chart. The inner ones are set to a multiplier of 2, and the outer to a multiplier of 4. Each "carpet" is composed of two smoothed upper or lower Keltner Channels bounds, both with an optional offset, one of which is set to 13, and the other to 0 by default; and an optional color fill between these. There is also a color fill between the outer and inner carpets which gives them an interesting 3-dimensional aspect at times. They can look a bit like tunnels by default.
My thinking around the idea of using an offset with the bands is that if we assume these things to provide a dynamic support and resistance, and previous support and resistance maintains status as support and resistance until proven otherwise, then by putting an offset to past data we are creating a more obvious visual indication of that support or resistance in the present. The default offset is set to 13 bars back, so if price found resistance at some point around 13 bars ago, and price is currently revisiting it we assume it is still resistance, and that offset band is there to give us a strong visual aid. Obviously it's not foolproof, but nothing is.
Beyond that most interesting part of the indicator you have a nice selection of moving averages which the bands are calculated off of. By default it's set to my UMA. The bands themselves also have a selection of moving averages for how the keltner channels are smoothed. And a note: because the UMA and RDMA are averages of different length MAs, they can not be adjusted other than via the multiplier that sets the distance from the moving average.
The indicator is multi-timeframe, and the moving average can be colored based on a higher timeframe as well.
I popped in the divergence indicator here too. You can choose from RSI and OBV, and the divergences will be plotted on the chart. Working on finding a way to be able to have the bands/MA set to a higher timeframe while plotting the divergences on the chart timeframe, but don't have an answer to that yet.
Alerts for moving average crosses, band touches, and divergences.
I like this one a lot. Enjoy!
Pictures below.
s3.tradingview.com
One interesting thing about this indicator is that band twists often occur at areas of support or resistance. Simply drawing horizontal lines from previous twisted points can provide places from which you may look for strength or weakness to enter into a trade, or which you might use as targets for taking profits. The vertical lines are just showing the point on the chart when the cross occurred.
s3.tradingview.com
Above is a Jurik MA with a bunch of adjustments made to the bands, and the moving average itself. Everything is super adjustable, so you can play around and have fun with them quite a bit.
s3.tradingview.com
Just a different MA and bands.
s3.tradingview.com
