Gold GC Renko Strategy Futures MGC MicrosRENKO SET UP FOR GC (1 CONTRACT)
TRADITIONAL
BOX SIZE 1
CHART TIMEFRAME 1 MINUTE
__________________________
REGULAR CANDLE SETUP FOR MGC (2 MICROS)
15 MIN TIMEFRAME
__________________________
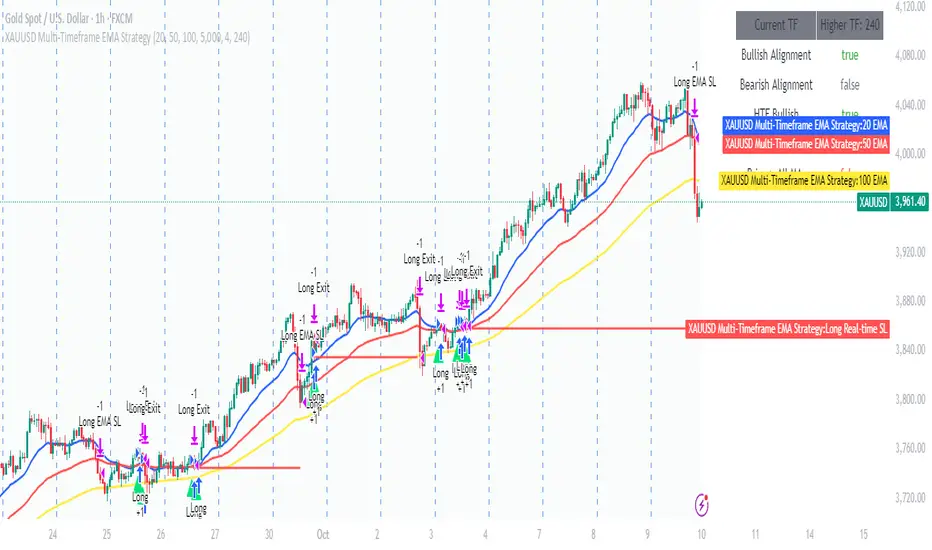
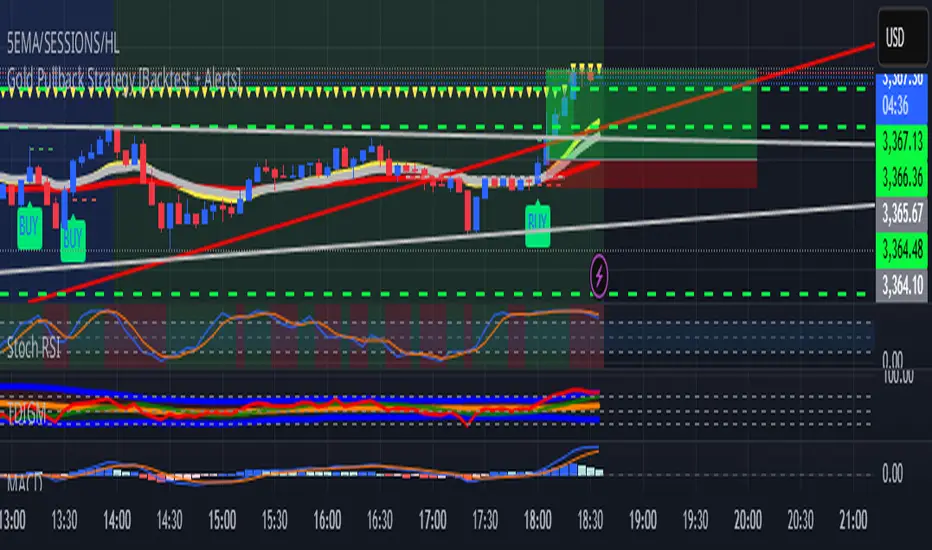
This strategy trades pullbacks within a trend, using two EMAs (fast/slow) to define uptrends and downtrends. It waits for a volatility “squeeze” , then looks for momentum ignition to go long, while shorts require a cross and optional band break/downtrend confirmation. Risk is handled with fixed dollar profit target and stop-loss values (converted to ticks), with exits placed immediately after entries and an automatic flat-at-session-close (New York time). Signals and risk lines are plotted.
In den Scripts nach "GOLD" suchen

nadia
Gold ramon strategy based on 50 candles and atr of 12
You enter the maximum of 50 candles once the most bearish starts to rise, we expect 10 candles, if you don't go up in 10 candles, you don't enter, if you go up before 10 candles, you enter.
When is TP? Enough with 5 candles
The temporality is 1 hour. It can be adjusted to 1 minute temporality for scalping.
It is never lost, because it always exceeds the previous maximums.

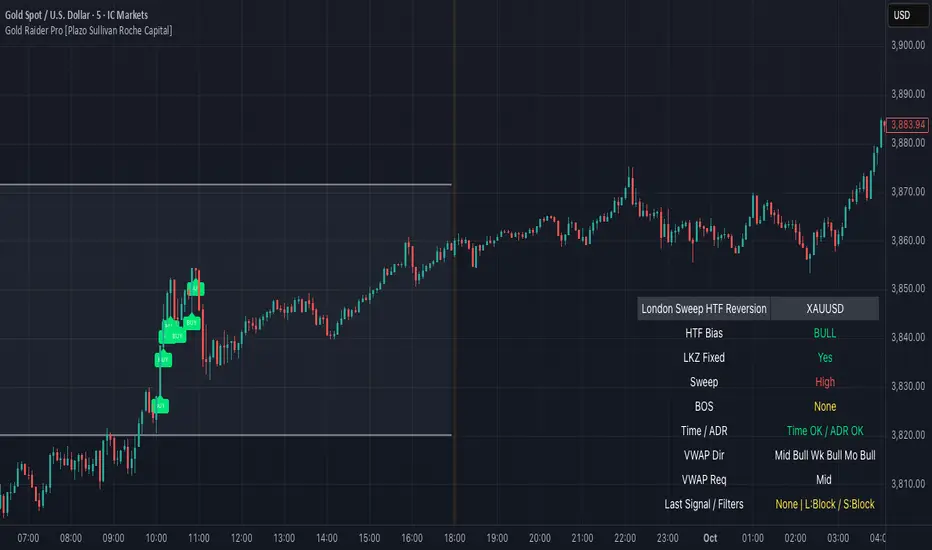
Gold Raider Pro [Plazo Sullivan Roche Capital]Core logic
During the London kill-zone, the script locks in the session high/low (LKZ).
After London ends, it looks for a liquidity sweep (price pokes beyond LKZ high/low) then a BOS (break of the first opposing swing) to confirm reversal.
Trades are only valid with higher-timeframe bias (D1 & H4 above/below EMA-50 in agreement).
Optional filters block weak signals: time gate (NY cutoff), ADR (skip if the day’s move is already stretched), and VWAP alignment (Midnight/Weekly/Monthly).
Output is a unified signal: BUY after low sweep + BOS in bull HTF, SELL after high sweep + BOS in bear HTF; labels + dashboard summarize state and reasons.
Best setup & usage
Chart & broker: XAUUSD on a high-liquidity feed (ICMarkets/FXPro/OANDA). Use 2m–5m for executions; confirm with 15m market structure.
Session: Set timezone to America/New_York. Default London kill-zone 02:30–04:30 NY; stop taking new signals after 11:00 NY (toggle in inputs).
HTF bias: Keep EMA length = 50 on D & H4 (default). Only toggle off bias if you’re deliberately testing counter-trend sweeps (not recommended live).
Structure/BOS: Use Swing Length = 3. Leave “Require BOS after the sweep” = ON for the cleanest signals; turn “Require close back inside LKZ” ON only if you want ultra-conservative entries.
VWAP filters: Keep Midnight VWAP = ON; add Weekly/Monthly only on trend days to avoid over-filtering range sessions.
ADR guardrail: Enable ADR filter once you go live; start with ADR Threshold = 0.9 and Lookback 14. This blocks chasing extended moves.
Execution playbook:
BUY: Wait for low sweep of LKZ → BOS up → dashboard shows BULL bias, Time/ADR OK, VWAP pass. Enter on the next pullback or at close; SL below BOS invalidation (or fixed 0.5–0.8× ADR14 of XAU).
SELL: Mirror logic after a high sweep in BEAR bias; SL above BOS invalidation.
TP: Scale at 1R, leave runner to 2–3R or to Midnight/Weekly VWAP touch; hard exit by NY lunchtime or on bias flip.
Risk: 0.25–0.5% per trade (XAU is spiky). One trade per direction per session; if ADR block triggers post-entry, manage to BE or flatten if structure weakens.
Alerts & dashboard: Turn on runtime alerts once parameters are set. Read the Last Signal / Filters row; only act when it shows your direction and “L:OK / S:OK” for your side.
Validation & tuning: Forward-test 3–4 weeks. If over-filtered, relax VWAP Weekly/Monthly first; if too chatty, enforce close-back-inside and keep NY cutoff tight.
Don’ts: Don’t trade during major news spikes, don’t counter the D1/H4 agreement, and don’t enter before BOS—sweeps without structure confirmation are bait.
Eng. Jaycob 💰It will show you where are the prices that may get reverse from them.
Numbers will be updated daily on the chart.


Gold NY Session Key TimesJust showing to us that news come out, open market, close bond for NY Session Time For Indonesia


Gold Master Indicator [Improved Signals]this indicater help you buy sans sell abobe and below the blue line.

GOLDEN SCALP DEXDescription:
This tool is designed for traders who want to capture momentum shifts that occur within larger timeframe structures. The strategy identifies unique breakout opportunities inside the HTF cycle and provides precise entry and exit signals without cluttering the chart.
The system focuses on:
Pinpointing immediate momentum breakouts
Clean chart visualization with intuitive buy/sell markers
Full backtesting capability through TradingView’s Strategy Tester
Customizable position sizing for futures, forex, and crypto traders
It is especially useful for traders who prefer fast, rule-based signals during high-impact intraday moves.
⚠️ Disclaimer: This is a trading tool, not financial advice. Results may vary depending on market conditions, and proper risk management is essential.

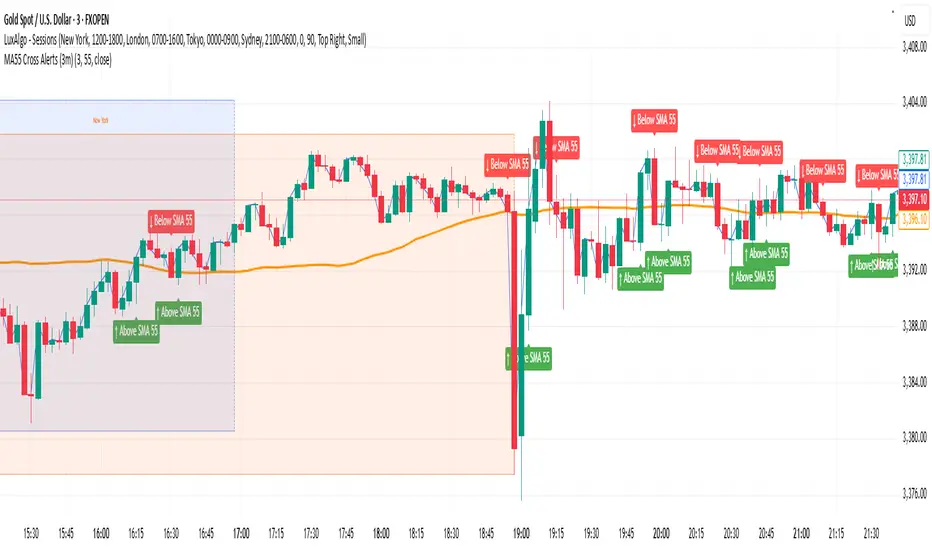
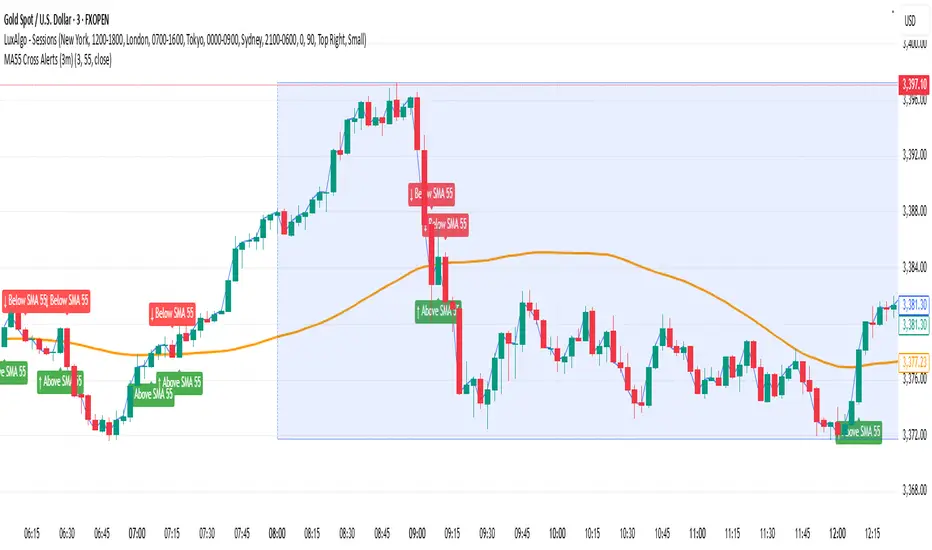
Gold MA55 Cross Alerts (3m) NavThis helps to find the best setup under the London and New York sessions.

Gold Pullback Strategy [Backtest + Alerts]XAU USD M5 M15 TP1-1
BUY Pull black EMA 21
Storsi oversold
Golden Lines[MedAlgo]## Overview
This custom TradingView indicator applies Fibonacci retracement and extension levels to logarithmic price scales, providing more accurate analysis for assets that exhibit exponential growth patterns. By utilizing logarithmic axes instead of linear ones, the indicator offers more relevant support and resistance zones for volatile assets like cryptocurrencies, high-growth stocks, and commodities that frequently move in percentage-based increments rather than absolute price movements.
## Key Features
- **Logarithmic Fibonacci Placement**: Automatically calculates Fibonacci levels based on logarithmic price distribution rather than linear values
- **Dynamic Level Adjustment**: Adjusts Fibonacci levels in real-time as prices move through logarithmic space
- **Custom Ratio Support**: Includes both traditional Fibonacci ratios (0.236, 0.382, 0.5, 0.618, 0.786, 1.0, 1.618, 2.618) and extended logarithmic-optimized ratios
- **Multi-timeframe Analysis**: Works across all timeframes while maintaining logarithmic consistency
- **Visual Alerts**: Color-coded zones show strength of price reactions at critical Fibonacci boundaries
- **Historical Backtesting**: Highlights how previous price action respected logarithmic Fibonacci levels
## How to Use
1. **IMPORTANT**: Ensure logarithmic scale is activated on your chart by clicking the "Log" button (marked as "L") in the bottom right corner of your chart
2. Add the indicator to your chart from the indicator menu
3. After adding the indicator, you'll be prompted to select:
- A high point (click on a significant peak)
- A low point (click on a significant trough)
4. The indicator will automatically draw all Fibonacci levels based on these two points
5. Lines will be drawn automatically on the chart, calculating the proper logarithmic Fibonacci ratios
6. No additional configuration is needed - the indicator automatically adapts to the logarithmic scaling
## Technical Explanation
The indicator transforms price data using natural logarithms before applying Fibonacci calculations. This approach acknowledges that percentage-based price movements appear as equal distances on logarithmic charts, making Fibonacci levels more relevant for identifying psychological and technical barriers in markets that move exponentially.
Unlike standard Fibonacci tools, this indicator:
1. Converts price to logarithmic values
2. Calculates Fibonacci sequences in log space
3. Maps these levels back to price chart display
4. Tracks reaction strength at each level
## Usage Guide
1. Select high and low points for your Fibonacci analysis
2. The indicator automatically draws the levels on logarithmic scale
3. Monitor price action as it approaches key logarithmic Fibonacci levels
4. Use color intensity to gauge the historical significance of each level
5. Set alerts for when price approaches logarithmic Fibonacci zones
## Interpretation
- **Strong Bounces**: When price strongly reacts at a logarithmic Fibonacci level, it often indicates a significant psychological barrier in percentage terms
- **Minimal Reaction**: Levels that show little price reaction may indicate logarithmic zones with less market interest
- **Confluence Areas**: Where multiple logarithmic Fibonacci levels converge from different timeframes, expect stronger support/resistance
- **Breakout Confirmation**: Price decisively moving through a significant logarithmic Fibonacci level often signals a strong trend continuation
## Best Applications
This indicator is particularly effective for:
- Cryptocurrency analysis
- High-growth technology stocks
- Commodities during trending markets
- Any asset that historically moves in percentage terms rather than absolute price
## Troubleshooting
- If Fibonacci levels appear distorted, verify that logarithmic scale is activated (check for highlighted "L" button)
- For best results, select major swing highs and lows that represent significant market turning points
- The indicator may need recalibration during extreme volatility events
Disclaimer
This indicator is provided for informational purposes only and should not be considered financial advice. Past performance is not indicative of future results. The signals generated are based on historical patterns and technical analysis, which may not always predict future market movements accurately. Trading involves substantial risk of loss. Always use proper risk management and consider using this indicator as part of a comprehensive trading strategy rather than as a standalone system. Test thoroughly before using with real capital.

GOLD Volume-Based Entry StrategyShort Description:
This script identifies potential long entries by detecting two consecutive bars with above-average volume and bullish price action. When these conditions are met, a trade is entered, and an optional profit target is set based on user input. This strategy can help highlight momentum-driven breakouts or trend continuations triggered by a surge in buying volume.
How It Works
Volume Moving Average
A simple moving average of volume (vol_ma) is calculated over a user-defined period (default: 20 bars). This helps us distinguish when volume is above or below recent averages.
Consecutive Green Volume Bars
First bar: Must be bullish (close > open) and have volume above the volume MA.
Second bar: Must also be bullish, with volume above the volume MA and higher than the first bar’s volume.
When these two bars appear in sequence, we interpret it as strong buying pressure that could drive price higher.
Entry & Profit Target
Upon detecting these two consecutive bullish bars, the script places a long entry.
A profit target is set at current price plus a user-defined fixed amount (default: 5 USD).
You can adjust this target, or you can add a stop-loss in the script to manage risk further.
Visual Cues
Buy Signal Marker appears on the chart when the second bar confirms the signal.
Green Volume Columns highlight the bars that fulfill the criteria, providing a quick visual confirmation of high-volume bullish bars.
Works fine on 1M-2M-5M-15M-30M. Do not use it on higher TF. Due the lack of historical data on lower TF, the backtest result is limited.

GOLDEN BULLETCandlestick Pattern Finder
Bullish Hammer
Bearish Hammer
Bullish Engulfing
Bearish Engulfing
Bullish Harami
Bearish Harami

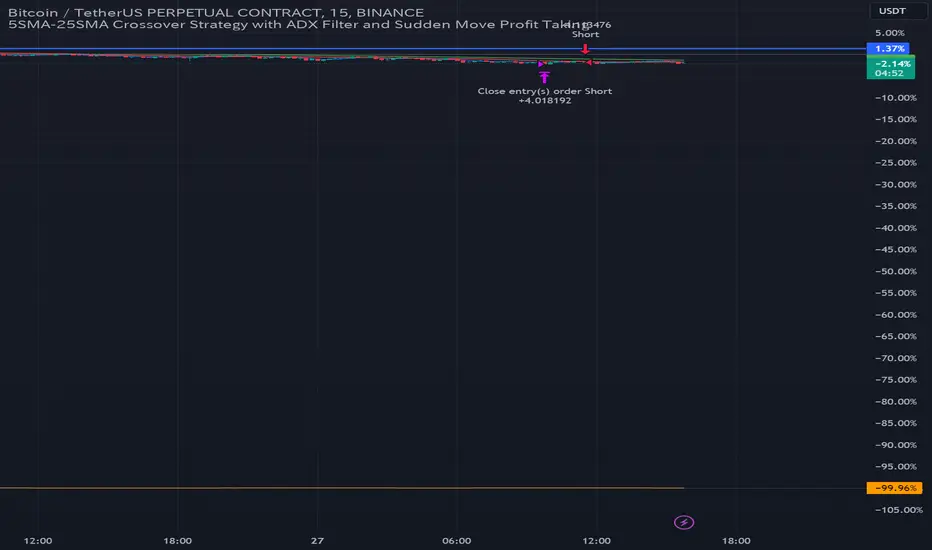
Golden Cross Strategy with Trend FilterHere's the English translation:
**Entry for Long Position:** Enter a long position only when the 5SMA crosses above the 25SMA and the current price is above the 75SMA.
**Entry for Short Position:** Enter a short position only when the 5SMA crosses below the 25SMA and the current price is below the 75SMA.
**Exit Position:** Hold the long position until a short signal is generated, and hold the short position until a long signal is generated.
By using the 75SMA to confirm the trend direction and taking positions only in alignment with that trend, you can enhance trading accuracy and potentially improve the profit factor.
Gold & EUR/USD LTF liquidity Sweep + Market structure shift on a lower time frame for sniper entries

Gold Option Signals with EMA and RSIIndicators:
Exponential Moving Averages (EMAs): Faster to respond to recent price changes compared to simple moving averages.
RSI: Measures the magnitude of recent price changes to evaluate overbought or oversold conditions.
Signal Generation:
Buy Call Signal: Generated when the short EMA crosses above the long EMA and the RSI is not overbought (below 70).
Buy Put Signal: Generated when the short EMA crosses below the long EMA and the RSI is not oversold (above 30).
Plotting:
EMAs: Plotted on the chart to visualize trend directions.
Signals: Plotted as shapes on the chart where conditions are met.
RSI Background Color: Changes to red for overbought and green for oversold conditions.
Steps to Use:
Add the Script to TradingView:
Open TradingView, go to the Pine Script editor, paste the script, save it, and add it to your chart.
Interpret the Signals:
Buy Call Signal: Look for green labels below the price bars.
Buy Put Signal: Look for red labels above the price bars.
Customize Parameters:
Adjust the input parameters (e.g., lengths of EMAs, RSI levels) to better fit your trading strategy and market conditions.
Testing and Validation
To ensure that the script works as expected, you can test it on historical data and validate the signals against known price movements. Adjust the parameters if necessary to improve the accuracy of the signals.

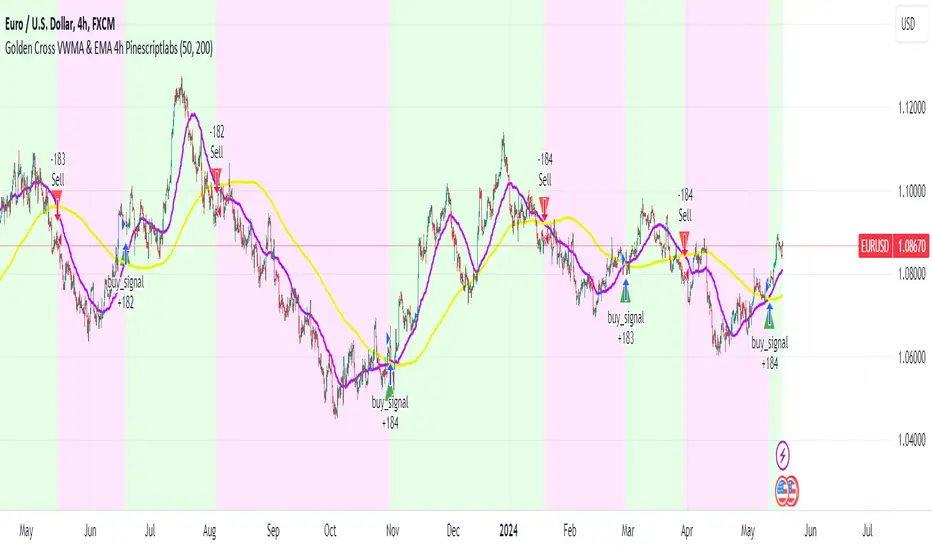
Golden Cross VWMA & EMA 4h PinescriptlabsThis strategy combines the 50-period Volume-Weighted Moving Average (VWMA) on the current timeframe with a 200-period Simple Moving Average (SMA) on the 4-hour timeframe. This combination of indicators with different characteristics and time horizons aims to identify strong and sustained trends across multiple timeframes.
The VWMA is a variant of the moving average that assigns greater weight to periods of higher volatility, helping to avoid misleading signals. On the other hand, the 4-hour SMA is used as an additional trend filter in a shorter-term horizon. By combining these two indicators, the strategy can leverage the strength of the VWMA to capture the main trend, but only when confirmed by the SMA in the lower timeframe.
Buy signals are generated when the VWMA crosses above the 4-hour SMA, indicating a potential bullish trend aligned in both timeframes. Sell signals occur on a bearish cross, suggesting a possible reversal of the main trend.
The default parameters are a 50-period VWMA and a 200-period 4-hour SMA. It is recommended to adjust these lengths according to the traded instrument and the desired timeframe. It is also crucial to use stop losses and profit targets to properly manage risk.
By combining indicators of different types and timeframes, this strategy aims to provide a more comprehensive view of trend strength.
Español:
Esta estrategia combina la Volume-Weighted Moving Average (VWMA) de 50 períodos en el timeframe actual con una Simple Moving Average (SMA) de 200 períodos en el timeframe de 4 horas. Esta combinación de indicadores de distinta naturaleza y horizontes temporales busca identificar tendencias fuertes y sostenidas en múltiples timeframes.
La VWMA es una variante de la media móvil que asigna mayor ponderación a los períodos de mayor volatilidad, lo que ayuda a evitar señales engañosas. Por otro lado, la SMA de 4 horas se utiliza como un filtro adicional de tendencia en un horizonte de corto plazo. Al combinar estos dos indicadores, la estrategia puede aprovechar la fortaleza de la VWMA para capturar la tendencia principal, pero sólo cuando es confirmada por la SMA en el timeframe menor.
Las señales de compra se generan cuando la VWMA cruza al alza la SMA de 4 horas, indicando una potencial tendencia alcista alineada en ambos horizontes temporales. Las señales de venta ocurren en el cruce bajista, sugiriendo una posible reversión de la tendencia principal.
Los parámetros predeterminados son: VWMA de 50 períodos y SMA de 4 horas de 200 períodos. Se recomienda ajustar estas longitudes según el instrumento operado y el horizonte temporal deseado. También es crucial utilizar stops y objetivos de ganancias para controlar adecuadamente el riesgo.
Al combinar indicadores de diferentes tipos y timeframes, esta estrategia busca brindar una visión más completa de la fuerza de la tendencia.
Golden Point IndicatorThe Spring Strategy, a well-regarded technique, is employed by skilled traders to detect potential shifts in market trends. This methodology is particularly effective in identifying instances where prices appear to breach critical support or resistance levels, only to dramatically rebound in the opposite direction, creating what is known as a "spring" pattern or a false breakout. This distinctive pattern serves as a harbinger of diminishing trend momentum and an imminent reversal in market direction.
In a bearish market context, the Spring Strategy materializes when an asset's price plunges below a vital support level. This prompts a wave of selling activity as traders react, leading to a further decline in price. However, this selling pressure eventually subsides, and the price experiences a sharp recovery, springing back above the support level. This resurgence presents a compelling opportunity for traders to enter the market at a more favorable price point.
Conversely, during bullish market conditions, the Spring Strategy is observed when an asset's price surges beyond a significant resistance level. This stimulates widespread buying interest among traders, propelling the price even higher. Nevertheless, this buying fervor abates, and the price retraces, springing back below the resistance level. This dip creates an advantageous selling opportunity, enabling traders to short the market with a potentially favorable risk-reward profile.
How to use or benefit from script:
For Long position :
Add script to chart for any time frame. script will calculate and look for any candle with fake break out. When detected it will wait until detecting a new candle closing higher than the high of fake break out candle. a buy alert is sent and shown. So traders can go long and specify risk / reward target.
For short position :
Add script to chart for any time frame. script will calculate and look for any candle with fake break out. When detected it will wait until detecting a new candle closing lower than the low of fake break out candle. a sell alert is sent and shown. So traders can go short and specify risk / reward target.
Advantages of Embracing the Spring Strategy
The Spring Strategy bestows traders with the advantage of identifying potential buying and selling scenarios while mitigating associated risks. By strategically awaiting the "spring back" to the initial breakout level, traders can avoid premature market entry and thereby reduce the likelihood of incurring losses.
Application and Implementation
Traders adeptly harness the Spring Strategy to decipher impending reversals. Should this pattern manifest following an uptrend, traders may opt to exit their long positions or initiate short positions, anticipating a transition towards a downtrend. Conversely, if the Spring Strategy unfolds post a downtrend, traders might liquidate their short positions or embark on long positions, foretelling an eventual shift to an uptrend.
Deconstructing the Consolidation Strategy
To begin, traders should pinpoint a period marked by price consolidation or a trading range. Within this phase, prices oscillate within a confined range over an extended duration. At the core of the Spring Strategy lies an abrupt, decisive movement—either above or below the confines of the trading range. This movement is often accompanied by heightened trading volume.
However, rather than perpetuating the momentum in the same direction, prices promptly recoil and re-enter the trading range. This swift and resolute recovery signifies the "spring" phase of the pattern, signifying market rejection of the transient price movement and the amplification of buying or selling pressure.
Traders may use the Spring Strategy as a cue to enter buy or sell positions, indicative of robust demand or supply for the asset near the upper or lower price threshold. It's imperative, however, to complement this strategy with supplementary indicators and manage risk judiciously to curtail potential losses.
Disclaimer
The content within my Scripts, Indicators, Ideas, Algorithms, and Systems is not intended as financial advice or an invitation to trade or invest in any securities. I disclaim liability for any losses or damages, including loss of profit, arising directly or indirectly from reliance on the information provided.
All investments entail risks, and past performance of securities, industries, sectors, markets, financial products, trading strategies, backtests, or individual trading does not guarantee future outcomes or returns. Traders bear full responsibility for their investment choices, predicated on their financial circumstances, objectives, risk tolerance, and liquidity requirements.
My Scripts, Indicators, Ideas, Algorithms, and Systems are purely for educational purposes!

Golden Swing Strategy - Souradeep DeyThis strategy is developed by Mr. Souradeep Dey. Strategy is based on RSI, Stoch, BB & Supertrend.
Coding by Rajkumar
