Dual Zigzag [Trendoscope®]🎲 Dual Zigzag indicator is built on recursive zigzag algorithm. It is very similar to other zigzag indicators published by us and other authors. However, the key point here is, the indicator draws zigzag on both price and any other plot based indicator on separate layouts.
Before we get into the indicator, here are some brief descriptions of the underlying concepts and key terminologies
🎯 Zigzag
Zigzag indicator breaks down price or any input series into a series of Pivot Highs and Pivot Lows alternating between each other. Zigzags though shows pivot high and lows, should not be used for buying at low and selling at high. The main application of zigzag indicator is for the visualisation of market structure and this can be used as basic building block for any pattern recognition algorithms.
🎯 Recursive Zigzag Algorithm
Recursive zigzag algorithm builds zigzag on multiple levels and each level of zigzag is based on the previous level pivots. The level zero zigzag is built on price. However, for level 1, instead of price level 0 zigzag pivots are used. Similarly for level 2, level 1 zigzag pivots are used as base.
🎲 Components Dual Zigzag Indicator
Here are the components of Dual zigzag indicator
Built in Oscillator - Indicator has built in oscillator options for plotting RSI (Relative Strength Index), MFI (Money Flow Index), cci (Commodity Channel Index) , CMO (Chande Momentum Oscillator), COG (Center of Gravity), and ROC (Rate of Change). Apart from the given built in oscillators, users can also use a custom external output as base. The oscillators are not printed on the price pane. But, printed on a separate indicator overlay.
Zigzag On Oscillator - Recursive zigzag is calculated and printed on the oscillator series. Each pivot high and pivot low also prints a label having the retracement ratios, and price levels at those points. Zigzag on the oscillator is also printed on the indicator overlay pane.
Zigzag on Price - Recursive zigzag calculated based on price and printed on the price pane. This is made possible by using force_overlay option present in the drawing objects. At each zigzag pivot levels, the label having price retracement ratios, and oscillator values are printed.
It is called dual zigzag because, the indicator calculates the zigzag on both price and oscillator series of values and prints them separately on different panes on the chart.
🎲 Indicator Settings
Settings include
Theme display settings to get the right colour combination to match the background.
Zigzag settings to be used for zigzag calculation and display
Oscillator settings to chose the oscillator to be used as base for 2nd zigzag
🎲 Applications
Useful in spotting divergences with both indicator and price having their own zigzag to highlight pivots
Spotting patterns in indicators/oscillators and correlate them with the patterns on price
🎲 Using External Input
If users want to use an external indicator such as OBV instead of the built in oscillators, then can do so by using the custom option.
Here is how this can be done.
Step1. Add both Dual Zigzag and the intended indicator (in this case OBV) on the chart. Notice that both OBV and Dual zigzag appear on different panes.
Step2. Edit the indicator settings of Dual zigzag and set custom indicator by selecting "custom" as oscillator name and then by setting the custom external indicator name and input.
Step 3. You would notice that the zigzag in Dual Zigzag indictor pane is already showing the zigzag pivots based on the OBV indicator and the price pivots display obv values at the pivot points. We can leave this as is.
Step 4. As an additional step, you can also merge the OBV pane and the Dual zigzag indicator pane into one by going into OBV settings and moving the indicator to above pane. Merge the scales so that there is no two scales on the same pane and the entire scale appear on the right.
At the end, you should see two panes - one with price and other with OBV and both having their zigzag plotted.
In den Scripts nach "CCI" suchen

Strength of Divergence Across Multiple Indicators (+CMF&VWMACD)Modified Version of Strength of Divergence Across Multiple Indicators by reees
Purpose:
This Pine Script indicator is designed to identify and evaluate the strength of bullish and bearish divergences across multiple technical indicators. Divergences occur when the price of an asset is moving in one direction while a technical indicator is moving in the opposite direction, potentially signaling a trend reversal.
Key Features:
1. Multiple Indicator Support: The script now analyzes divergences for the following indicators:
* RSI (Relative Strength Index)
* OBV (On-Balance Volume)
* MACD (Moving Average Convergence/Divergence)
* STOCH (Stochastic Oscillator)
* CCI (Commodity Channel Index)
* MFI (Money Flow Index)
* AO (Awesome Oscillator)
* CMF (Chaikin Money Flow) - Newly added
* VWMACD (Volume-Weighted MACD) - Newly added
2. Customizable Divergence Parameters:
* Bullish/Bearish: Enable or disable the detection of bullish and bearish divergences independently.
* Regular/Hidden: Detect both regular and hidden divergences (hidden divergences can indicate trend continuation).
* Broken Trendline Exclusion: Optionally ignore divergences where the trendline connecting price pivots is broken by an intermediate pivot.
* Pivot Lookback Periods: Adjust the number of bars used to identify valid pivot highs and lows for divergence calculations.
* Weighting: Assign different weights to regular vs. hidden divergences and to the relative change in price vs. the indicator.
3. Indicator-Specific Settings:
* Weight: Each indicator can be assigned a weight, influencing its contribution to the overall divergence strength calculation.
* Extreme Value: Define a threshold above which an indicator's divergence is considered "extreme," giving it a higher strength rating.
4. Divergence Strength Calculation:
* For each indicator, the script calculates a divergence "degree" based on the magnitude of the divergence and the user-defined weightings.
* The total divergence strength is the sum of the individual indicator divergence degrees.
* Strength is categorized as "Extreme," "Very strong," "Strong," "Moderate," "Weak," or "Very weak."
5. Visualization:
* Divergence Lines: The script draws lines on the chart connecting the price and indicator pivots that form a divergence (optional, with customizable transparency).
* Labels: Labels display the total divergence strength and a breakdown of each indicator's contribution. The size and visibility of labels are based on the strength.
6. Alerts:
* The script can generate alerts when the total divergence strength exceeds a user-defined threshold.
New Indicators (CMF and VWMACD):
* Chaikin Money Flow (CMF):
* Purpose: Measures the buying and selling pressure by analyzing the relationship between price, volume, and the accumulation/distribution line.
* Divergence: A bullish CMF divergence occurs when the price makes a lower low, but the CMF makes a higher low (suggesting increasing buying pressure). A bearish divergence is the opposite.
* Volume-Weighted MACD (VWMACD):
* Purpose: Similar to the standard MACD but uses volume-weighted moving averages instead of simple moving averages, giving more weight to periods with higher volume.
* Divergence: Divergences are interpreted similarly to the standard MACD, but the VWMACD can be more sensitive to volume changes.
How It Works (Simplified):
1. Pivot Detection: The script identifies pivot highs and lows in both price and the selected indicators using the specified lookback periods.
2. Divergence Check: For each indicator:
* It checks if a series of pivots in price and the indicator are diverging (e.g., price makes a lower low, but the indicator makes a higher low for a bullish divergence).
* It calculates the divergence degree based on the difference in price and indicator values, weightings, and whether it's a regular or hidden divergence.
3. Strength Aggregation: The script sums up the divergence degrees of all enabled indicators to get the total divergence strength.
4. Visualization and Alerts: It draws lines and labels on the chart to visualize the divergences and generates alerts if the total strength exceeds the set threshold.
Benefits:
* Comprehensive Divergence Analysis: By considering multiple indicators, the script provides a more robust assessment of potential trend reversals.
* Customization: The many adjustable parameters allow traders to fine-tune the script to their specific trading style and preferences.
* Objective Strength Evaluation: The divergence strength calculation and categorization offer a more objective way to evaluate the significance of divergences.
* Early Warning System: Divergences can often precede significant price movements, making this script a valuable tool for anticipating potential trend changes.
* Volume Confirmation: The inclusion of CMF and VWMACD add volume-based confirmation to the divergence signals, potentially increasing their reliability.
Limitations:
* Lagging Indicators: Most of the indicators used are lagging, meaning they are based on past price data. Divergences may sometimes occur after a significant price move has already begun.
* False Signals: No indicator is perfect, and divergences can sometimes produce false signals, especially in choppy or ranging markets.
* Subjectivity: While the script aims for objectivity, some settings (like weightings and extreme values) still involve a degree of subjective judgment.

taLibrary "ta"
Collection of all custom and enhanced TA indicators
ma(source, maType, length)
returns custom moving averages
Parameters:
source (float) : Moving Average Source
maType (simple string) : Moving Average Type : Can be sma, ema, hma, rma, wma, vwma, swma, highlow, linreg, median
length (simple int) : Moving Average Length
Returns: moving average for the given type and length
atr(maType, length)
returns ATR with custom moving average
Parameters:
maType (simple string) : Moving Average Type : Can be sma, ema, hma, rma, wma, vwma, swma, highlow, linreg, median
length (simple int) : Moving Average Length
Returns: ATR for the given moving average type and length
atrpercent(maType, length)
returns ATR as percentage of close price
Parameters:
maType (simple string) : Moving Average Type : Can be sma, ema, hma, rma, wma, vwma, swma, highlow, linreg, median
length (simple int) : Moving Average Length
Returns: ATR as percentage of close price for the given moving average type and length
bb(source, maType, length, multiplier, sticky)
returns Bollinger band for custom moving average
Parameters:
source (float) : Moving Average Source
maType (simple string) : Moving Average Type : Can be sma, ema, hma, rma, wma, vwma, swma, highlow, linreg, median
length (simple int) : Moving Average Length
multiplier (float) : Standard Deviation multiplier
sticky (simple bool) : - sticky boundaries which will only change when value is outside boundary.
Returns: Bollinger band with custom moving average for given source, length and multiplier
bbw(source, maType, length, multiplier, sticky)
returns Bollinger bandwidth for custom moving average
Parameters:
source (float) : Moving Average Source
maType (simple string) : Moving Average Type : Can be sma, ema, hma, rma, wma, vwma, swma, highlow, linreg, median
length (simple int) : Moving Average Length
multiplier (float) : Standard Deviation multiplier
sticky (simple bool) : - sticky boundaries which will only change when value is outside boundary.
Returns: Bollinger Bandwidth for custom moving average for given source, length and multiplier
bpercentb(source, maType, length, multiplier, sticky)
returns Bollinger Percent B for custom moving average
Parameters:
source (float) : Moving Average Source
maType (simple string) : Moving Average Type : Can be sma, ema, hma, rma, wma, vwma, swma, highlow, linreg, median
length (simple int) : Moving Average Length
multiplier (float) : Standard Deviation multiplier
sticky (simple bool) : - sticky boundaries which will only change when value is outside boundary.
Returns: Bollinger Percent B for custom moving average for given source, length and multiplier
kc(source, maType, length, multiplier, useTrueRange, sticky)
returns Keltner Channel for custom moving average
Parameters:
source (float) : Moving Average Source
maType (simple string) : Moving Average Type : Can be sma, ema, hma, rma, wma, vwma, swma, highlow, linreg, median
length (simple int) : Moving Average Length
multiplier (float) : Standard Deviation multiplier
useTrueRange (simple bool) : - if set to false, uses high-low.
sticky (simple bool) : - sticky boundaries which will only change when value is outside boundary.
Returns: Keltner Channel for custom moving average for given souce, length and multiplier
kcw(source, maType, length, multiplier, useTrueRange, sticky)
returns Keltner Channel Width with custom moving average
Parameters:
source (float) : Moving Average Source
maType (simple string) : Moving Average Type : Can be sma, ema, hma, rma, wma, vwma, swma, highlow, linreg, median
length (simple int) : Moving Average Length
multiplier (float) : Standard Deviation multiplier
useTrueRange (simple bool) : - if set to false, uses high-low.
sticky (simple bool) : - sticky boundaries which will only change when value is outside boundary.
Returns: Keltner Channel Width for custom moving average
kpercentk(source, maType, length, multiplier, useTrueRange, sticky)
returns Keltner Channel Percent K Width with custom moving average
Parameters:
source (float) : Moving Average Source
maType (simple string) : Moving Average Type : Can be sma, ema, hma, rma, wma, vwma, swma, highlow, linreg, median
length (simple int) : Moving Average Length
multiplier (float) : Standard Deviation multiplier
useTrueRange (simple bool) : - if set to false, uses high-low.
sticky (simple bool) : - sticky boundaries which will only change when value is outside boundary.
Returns: Keltner Percent K for given moving average, source, length and multiplier
dc(length, useAlternateSource, alternateSource, sticky)
returns Custom Donchian Channel
Parameters:
length (simple int) : - donchian channel length
useAlternateSource (simple bool) : - Custom source is used only if useAlternateSource is set to true
alternateSource (float) : - Custom source
sticky (simple bool) : - sticky boundaries which will only change when value is outside boundary.
Returns: Donchian channel
dcw(length, useAlternateSource, alternateSource, sticky)
returns Donchian Channel Width
Parameters:
length (simple int) : - donchian channel length
useAlternateSource (simple bool) : - Custom source is used only if useAlternateSource is set to true
alternateSource (float) : - Custom source
sticky (simple bool) : - sticky boundaries which will only change when value is outside boundary.
Returns: Donchian channel width
dpercentd(length, useAlternateSource, alternateSource, sticky)
returns Donchian Channel Percent of price
Parameters:
length (simple int) : - donchian channel length
useAlternateSource (simple bool) : - Custom source is used only if useAlternateSource is set to true
alternateSource (float) : - Custom source
sticky (simple bool) : - sticky boundaries which will only change when value is outside boundary.
Returns: Donchian channel Percent D
oscillatorRange(source, method, highlowLength, rangeLength, sticky)
oscillatorRange - returns Custom overbought/oversold areas for an oscillator input
Parameters:
source (float) : - Osillator source such as RSI, COG etc.
method (simple string) : - Valid values for method are : sma, ema, hma, rma, wma, vwma, swma, highlow, linreg, median
highlowLength (simple int) : - length on which highlow of the oscillator is calculated
rangeLength (simple int) : - length used for calculating oversold/overbought range - usually same as oscillator length
sticky (simple bool) : - overbought, oversold levels won't change unless crossed
Returns: Dynamic overbought and oversold range for oscillator input
oscillator(type, length, shortLength, longLength, source, highSource, lowSource, method, highlowLength, sticky)
oscillator - returns Choice of oscillator with custom overbought/oversold range
Parameters:
type (simple string) : - oscillator type. Valid values : cci, cmo, cog, mfi, roc, rsi, stoch, tsi, wpr
length (simple int) : - Oscillator length - not used for TSI
shortLength (simple int) : - shortLength only used for TSI
longLength (simple int) : - longLength only used for TSI
source (float) : - custom source if required
highSource (float) : - custom high source for stochastic oscillator
lowSource (float) : - custom low source for stochastic oscillator
method (simple string) : - Valid values for method are : sma, ema, hma, rma, wma, vwma, swma, highlow, linreg, median
highlowLength (simple int) : - length on which highlow of the oscillator is calculated
sticky (simple bool) : - overbought, oversold levels won't change unless crossed
Returns: Oscillator value along with dynamic overbought and oversold range for oscillator input

ADM Indicator [CHE] Comprehensive Description of the Three Market Phases for TradingView
Introduction
Financial markets often exhibit patterns that reflect the collective behavior of participants. Recognizing these patterns can provide traders with valuable insights into potential future price movements. The ADM Indicator is designed to help traders identify and capitalize on these patterns by detecting three primary market phases:
1. Accumulation Phase
2. Manipulation Phase
3. Distribution Phase
This indicator places labels on the chart to signify these phases, aiding traders in making informed decisions. Below is an in-depth explanation of each phase, including how the ADM Indicator detects them.
1. Accumulation Phase
Definition
The Accumulation Phase is a period where informed investors or institutions discreetly purchase assets before a potential price increase. During this phase, the price typically moves within a confined range between established highs and lows.
Characteristics
- Price Range Bound: The asset's price stays within the previous high and low after a timeframe change.
- Low Volatility: Minimal price movement indicates a balance between buyers and sellers.
- Steady Volume: Trading volume may remain relatively constant or show slight increases.
- Market Sentiment: General market interest is low, as the accumulation is not yet apparent to the broader market.
Detection with ADM Indicator
- Criteria: An accumulation is detected when the price remains within the previous high and low after a timeframe change.
- Indicator Action: At the end of the period, if accumulation has occurred, the indicator places a label "Accumulation" on the chart.
- Visual Cues: A yellow semi-transparent background highlights the accumulation phase, enhancing visual recognition.
Implications for Traders
- Entry Opportunity: Consider preparing for potential long positions before a possible upward move.
- Risk Management: Use tight stop-loss orders below the support level due to the defined trading range.
2. Manipulation Phase
Definition
The Manipulation Phase, also known as the Shakeout Phase, occurs when dominant market players intentionally move the price to trigger stop-loss orders and create panic among less-informed traders. This action generates liquidity and better entry prices for large positions.
Characteristics
- False Breakouts: The price moves above the previous high or below the previous low but quickly reverses.
- Increased Volatility: Sharp price movements occur without fundamental reasons.
- Stop-Loss Hunting: The price targets common stop-loss areas, triggering them before reversing.
- Emotional Trading: Retail traders may react impulsively, leading to poor trading decisions.
Detection with ADM Indicator
- Manipulation Up:
- Criteria: Detected when the price rises above the previous high and then falls back below it.
- Indicator Action: Places a label "Manipulation Up" on the chart at the point of detection.
- Manipulation Down:
- Criteria: Detected when the price falls below the previous low and then rises back above it.
- Indicator Action: Places a label "Manipulation Down" on the chart at the point of detection.
- Visual Cues:
- Manipulation Up: Blue background highlights the phase.
- Manipulation Down: Orange background highlights the phase.
Implications for Traders
- Caution Advised: Be wary of false signals and avoid overreacting to sudden price changes.
- Preparation for Next Phase: Use this phase to anticipate potential distribution and adjust strategies accordingly.
3. Distribution Phase
Definition
The Distribution Phase occurs when the institutions or informed investors who accumulated positions start selling to the general market at higher prices. This phase often follows a Manipulation Phase and may signal an impending trend reversal.
Characteristics
- Price Reversal: The price moves in the opposite direction of the prior manipulation.
- High Trading Volume: Increased selling activity as large players offload positions.
- Trend Weakening: The previous trend loses momentum, indicating a potential shift.
- Market Sentiment Shift: Optimism fades, and uncertainty or pessimism may emerge.
Detection with ADM Indicator
- Distribution Up:
- Criteria: Detected after a verified Manipulation Up when the price subsequently falls below the previous low.
- Indicator Action: Places a label "Distribution Up" on the chart.
- Distribution Down:
- Criteria: Detected after a verified Manipulation Down when the price subsequently rises above the previous high.
- Indicator Action: Places a label "Distribution Down" on the chart.
- Visual Cues:
- Distribution Up: Purple background highlights the phase.
- Distribution Down: Maroon background highlights the phase.
Implications for Traders
- Exit Signals: Consider closing long positions if in a Distribution Up phase.
- Short Selling Opportunities: Potential to enter short positions anticipating a downtrend.
Using the ADM Indicator on TradingView
Indicator Overview
The ADM Indicator automates the detection of Accumulation, Manipulation, and Distribution phases by analyzing price movements relative to previous highs and lows on a selected timeframe. It provides visual cues and labels on the chart, helping traders quickly identify the current market phase.
Features
- Multi-Timeframe Analysis: Choose from auto, multiplier, or manual timeframe settings.
- Visual Labels: Clear labeling of market phases directly on the chart.
- Background Highlighting: Distinct background colors for each phase.
- Customizable Settings: Adjust colors, styles, and display options.
- Period Separators: Optional separators delineate different timeframes.
Interpreting the Indicator
1. Accumulation Phase
- Detection: Price stays within the previous high and low after a timeframe change.
- Label: "Accumulation" placed at the period's end if detected.
- Background: Yellow semi-transparent color.
- Action: Prepare for potential long positions.
2. Manipulation Phase
- Detection:
- Manipulation Up: Price rises above previous high and then falls back below.
- Manipulation Down: Price falls below previous low and then rises back above.
- Labels: "Manipulation Up" or "Manipulation Down" placed at detection.
- Background:
- Manipulation Up: Blue color.
- Manipulation Down: Orange color.
- Action: Exercise caution; avoid impulsive trades.
3. Distribution Phase
- Detection:
- Distribution Up: After a Manipulation Up, price falls below previous low.
- Distribution Down: After a Manipulation Down, price rises above previous high.
- Labels: "Distribution Up" or "Distribution Down" placed at detection.
- Background:
- Distribution Up: Purple color.
- Distribution Down: Maroon color.
- Action: Consider exiting positions or entering counter-trend trades.
Configuring the Indicator
- Timeframe Type: Select Auto, Multiplier, or Manual for analysis timeframe.
- Multiplier: Set a custom multiplier when using "Multiplier" type.
- Manual Resolution: Define a specific timeframe with "Manual" option.
- Separator Settings: Customize period separators for visual clarity.
- Label Display Options: Choose to display all labels or only the most recent.
- Visualization Settings: Adjust colors and styles for personal preference.
Practical Tips
- Combine with Other Analysis Tools: Use alongside volume indicators, trend lines, or other technical tools.
- Backtesting: Review historical data to understand how the indicator signals would have impacted past trades.
- Stay Informed: Keep abreast of market news that might affect price movements beyond technical analysis.
- Risk Management: Always employ stop-loss orders and position sizing strategies.
Conclusion
The ADM Indicator is a valuable tool for traders seeking to understand and leverage market phases. By detecting Accumulation, Manipulation, and Distribution phases through specific price action criteria, it provides actionable insights into market dynamics.
Understanding the precise conditions under which each phase is detected empowers traders to make more informed decisions. Whether preparing for potential breakouts during accumulation, exercising caution during manipulation, or adjusting positions during distribution, the ADM Indicator aids in navigating the complexities of the financial markets.
Disclaimer:
The content provided, including all code and materials, is strictly for educational and informational purposes only. It is not intended as, and should not be interpreted as, financial advice, a recommendation to buy or sell any financial instrument, or an offer of any financial product or service. All strategies, tools, and examples discussed are provided for illustrative purposes to demonstrate coding techniques and the functionality of Pine Script within a trading context.
Any results from strategies or tools provided are hypothetical, and past performance is not indicative of future results. Trading and investing involve high risk, including the potential loss of principal, and may not be suitable for all individuals. Before making any trading decisions, please consult with a qualified financial professional to understand the risks involved.
By using this script, you acknowledge and agree that any trading decisions are made solely at your discretion and risk.
This indicator is inspired by the Super 6x Indicators: RSI, MACD, Stochastic, Loxxer, CCI, and Velocity . A special thanks to Loxx for their relentless effort, creativity, and contributions to the TradingView community, which served as a foundation for this work.
Best regards Chervolino
Overview of the Timeframe Levels in the `autotimeframe()` Function
The `autotimeframe()` function automatically adjusts the higher timeframe based on the current chart timeframe. Here are the specific timeframe levels used in the function:
- Current Timeframe ≤ 1 Minute
→ Higher Timeframe: 240 Minutes (4 Hours)
- Current Timeframe ≤ 5 Minutes
→ Higher Timeframe: 1 Day
- Current Timeframe ≤ 1 Hour
→ Higher Timeframe: 3 Days
- Current Timeframe ≤ 4 Hours
→ Higher Timeframe: 7 Days
- Current Timeframe ≤ 12 Hours
→ Higher Timeframe: 1 Month
- Current Timeframe ≤ 1 Day
→ Higher Timeframe: 3 Months
- Current Timeframe ≤ 7 Days
→ Higher Timeframe: 6 Months
- For All Higher Timeframes (over 7 Days)
→ Higher Timeframe: 12 Months
Summary:
The function assigns a corresponding higher timeframe based on the current timeframe to optimize the analysis:
- 1 Minute or Less → 4 Hours
- Up to 5 Minutes → 1 Day
- Up to 1 Hour → 3 Days
- Up to 4 Hours → 7 Days
- Up to 12 Hours → 1 Month
- Up to 1 Day → 3 Months
- Up to 7 Days → 6 Months
- Over 7 Days → 12 Months
This automated adjustment ensures that the indicator works effectively across different chart timeframes without requiring manual changes.

Momentum Zones [TradersPro]OVERVIEW
The Momentum Zones indicator is designed for momentum stock traders to provide a visible trend structure with actionable price levels. The indicator has been designed for high-growth, bullish stocks on a daily time frame but can be used on any chart and timeframe.
Momentum zones help traders focus on the momentum structure of price, enabling disciplined trading plans with specific entry, exit, and risk management levels.
It is built using CCI values, allowing for fixed trend range calculations. It is most effective when applied to screens of stocks with high RSI, year-to-date (YTD) price gains of 25% or higher, as well as stocks showing growth in both sales and earnings quarter-over-quarter and year-over-year.
CONCEPTS
The indicator defines and colors uptrends (green), downtrends (red), and trends in transition or pausing (yellow).
The indicator can be used for new trend entry or trend continuation entry. New trend entry can be done on the first green bar after a red bar. Trend continuation entries can be done with the first green bar after a yellow bar. The yellow transition zones can be used as price buffers for stop-loss management on new entries.
To see the color changes, users need to be sure to uncheck the candlestick color settings. This can be done by right-clicking the chart, going to Symbols, and unchecking the candle color body, border, and wick boxes.
Remember to check them if the indicator is turned off, or the candles will be blank with no color.
The settings also correspond to the screening function to get a list of stocks entering various momentum zones so you can have a prime list of the stocks meeting any other fundamental criteria you may desire. Traders can then use the indicator for the entry and risk structure of the trading plan.

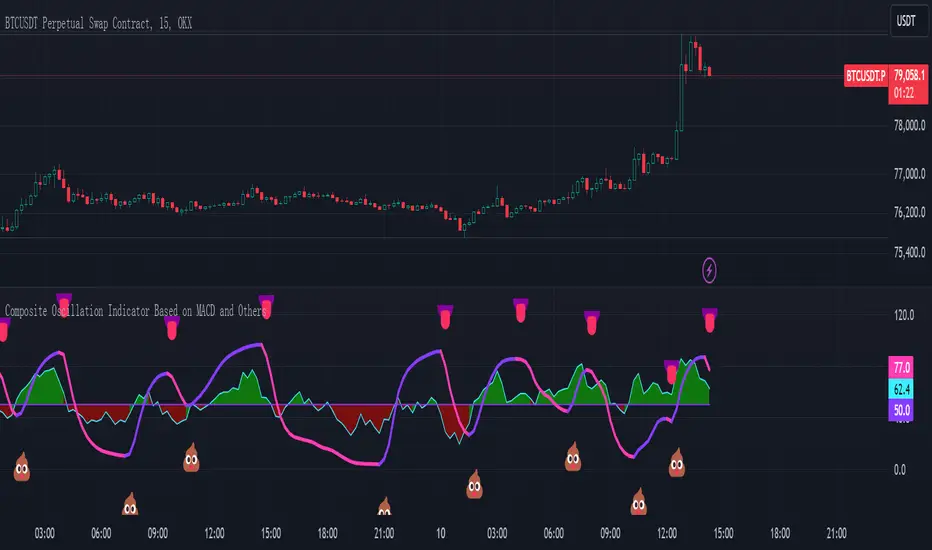
Composite Oscillation Indicator Based on MACD and OthersThis indicator combines various technical analysis tools to create a composite oscillator that aims to capture multiple aspects of market behavior. Here's a breakdown of its components:
* Individual RSIs (xxoo1-xxoo15): The code calculates the RSI (Relative Strength Index) of numerous indicators, including volume-based indicators (NVI, PVI, OBV, etc.), price-based indicators (CCI, CMO, etc.), and moving averages (WMA, ALMA, etc.). It also includes the RSI of the MACD histogram (xxoo14).
* Composite RSI (xxoojht): The individual RSIs are then averaged to create a composite RSI, aiming to provide a more comprehensive view of market momentum and potential turning points.
* MACD Line RSI (xxoo14): The RSI of the MACD histogram incorporates the momentum aspect of the MACD indicator into the composite measure.
* Double EMA (co, coo): The code employs two Exponential Moving Averages (EMAs) of the composite RSI, with different lengths (9 and 18 periods).
* Difference (jo): The difference between the two EMAs (co and coo) is calculated, aiming to capture the rate of change in the composite RSI.
* Smoothed Difference (xxp): The difference (jo) is further smoothed using another EMA (9 periods) to reduce noise and enhance the signal.
* RSI of Smoothed Difference (cco): Finally, the RSI is applied to the smoothed difference (xxp) to create the core output of the indicator.
Market Applications and Trading Strategies:
* Overbought/Oversold: The indicator's central line (plotted at 50) acts as a reference for overbought/oversold conditions. Values above 50 suggest potential overbought zones, while values below 50 indicate oversold zones.
* Crossovers and Divergences: Crossovers of the cco line above or below its previous bar's value can signal potential trend changes. Divergences between the cco line and price action can also provide insights into potential trend reversals.
* Emoji Markers: The code adds emoji markers ("" for bullish and "" for bearish) based on the crossover direction of the cco line. These can provide a quick visual indication of potential trend shifts.
* Colored Fill: The area between the composite RSI line (xxoojht) and the central line (50) is filled with color to visually represent the prevailing market sentiment (green for above 50, red for below 50).
Trading Strategies (Examples):
* Long Entry: Consider a long entry (buying) signal when the cco line crosses above its previous bar's value and the composite RSI (xxoojht) is below 50, suggesting a potential reversal from oversold conditions.
* Short Entry: Conversely, consider a short entry (selling) signal when the cco line crosses below its previous bar's value and the composite RSI (xxoojht) is above 50, suggesting a potential reversal from overbought conditions.
* Confirmation: Always combine the indicator's signals with other technical analysis tools and price action confirmation for better trade validation.
Additional Notes:
* The indicator offers a complex combination of multiple indicators. Consider testing and optimizing the parameters (EMAs, RSI periods) to suit your trading style and market conditions.
* Backtesting with historical data can help assess the indicator's effectiveness and identify potential strengths and weaknesses in different market environments.
* Remember that no single indicator is perfect, and the cco indicator should be used in conjunction with other forms of analysis to make informed trading decisions.
By understanding the logic behind this composite oscillator and its potential applications, you can incorporate it into your trading strategy to potentially identify trends, gauge market sentiment, and generate trading signals.
[3Commas] Signal BuilderSignal Builder is a tool designed to help traders create custom buy and sell signals by combining multiple technical indicators. Its flexibility allows traders to set conditions based on their specific strategy, whether they’re into scalping, swing trading, or long-term investing. Additionally, its integration with 3Commas bots makes it a powerful choice for those looking to automate their trades, though it’s also ideal for traders who prefer receiving alerts and making manual decisions.
🔵 How does Signal Builder work?
Signal Builder allows users to define custom conditions using popular technical indicators, which, when met, generate clear buy or sell signals. These signals can be used to trigger TradingView alerts, ensuring that you never miss a market opportunity. Additionally, all conditions are evaluated using "AND" logic, meaning signals are only activated when all user-defined conditions are met. This increases precision and helps avoid false signals.
🔵 Available indicators and recommended settings:
Signal Builder provides access to a wide range of technical indicators, each customizable to popular settings that maximize effectiveness:
RSI (Relative Strength Index): An oscillator that measures the relative strength of price over a specific period. Traders typically configure it with 14 periods, using levels of 30 (oversold) and 70 (overbought) to identify potential reversals.
MACD (Moving Average Convergence Divergence): A key indicator tracking the crossover between two moving averages. Common settings include 12 and 26 periods for the moving averages, with a 9-period signal line to detect trend changes.
Ultimate Oscillator: Combines three different time frames to offer a comprehensive view of buying and selling pressure. Popular settings are 7, 14, and 28 periods.
Bollinger Bands %B: Provides insight into where the price is relative to its upper and lower bands. Standard settings include a 20-period moving average and a standard deviation of 2.
ADX (Average Directional Index): Measures the strength of a trend. Values above 25 typically indicate a strong trend, while values below suggest weak or sideways movement.
Stochastic Oscillator: A momentum indicator comparing the closing price to its range over a defined period. Popular configurations include 14 periods for %K and 3 for %D smoothing.
Parabolic SAR: Ideal for identifying trend reversals and entry/exit points. Commonly configured with a 0.02 step and a 0.2 maximum.
Money Flow Index (MFI): Similar to RSI but incorporates volume into the calculation. Standard settings use 14 periods, with levels of 20 and 80 as oversold and overbought thresholds.
Commodity Channel Index (CCI): Measures the deviation of price from its average. Traders often use a 20-period setting with levels of +100 and -100 to identify extreme overbought or oversold conditions.
Heikin Ashi Candles: These candles smooth out price fluctuations to show clearer trends. Commonly used in trend-following strategies to filter market noise.
🔵 How to use Signal Builder:
Configure indicators: Select the indicators that best fit your strategy and adjust their settings as needed. You can combine multiple indicators to define precise entry and exit conditions.
Define custom signals: Create buy or sell conditions that trigger when your selected indicators meet the criteria you’ve set. For example, configure a buy signal when RSI crosses above 30 and MACD confirms with a bullish crossover.
TradingView alerts: Set up alerts in TradingView to receive real-time notifications when the conditions you’ve defined are met, allowing you to react quickly to market opportunities without constantly monitoring charts.
Monitor with the panel: Signal Builder includes a visual panel that shows active conditions for each indicator in real time, helping you keep track of signals without manually checking each indicator.
🔵 3Commas integration:
In addition to being a valuable tool for any trader, Signal Builder is optimized to work seamlessly with 3Commas bots through Webhooks. This allows you to automate your trades based on the signals you’ve configured, ensuring that no opportunity is missed when your defined conditions are met. If you prefer automation, Signal Builder can send buy or sell signals to your 3Commas bots, enhancing your trading process and helping you manage multiple trades more efficiently.
🔵 Example of use:
Imagine you trade in volatile markets and want to trigger a sell signal when:
Stochastic Oscillator indicates overbought conditions with the %K value crossing below 80.
Bollinger Bands %B shows the price has surpassed the upper band, suggesting a potential reversal.
ADX is below 20, indicating that the trend is weak and could be about to change.
With Signal Builder , you can configure these conditions to trigger a sell signal only when all are met simultaneously. Then, you can set up a TradingView alert to notify you as soon as the signal is activated, giving you the opportunity to react quickly and adjust your strategy accordingly.
👨🏻💻💭 If this tool helps your trading strategy, don’t forget to give it a boost! Feel free to share in the comments how you're using it or if you have any questions.
_________________________________________________________________
The information and publications within the 3Commas TradingView account are not meant to be and do not constitute financial, investment, trading, or other types of advice or recommendations supplied or endorsed by 3Commas and any of the parties acting on behalf of 3Commas, including its employees, contractors, ambassadors, etc.

*2.2 Aggregated (Raw Z-scores with MA)***To be used with other 2.2 indicator***
Key Indicators Used:
Oscillating Indicators: RSI, TSI, Stochastic, MACD, CCI, Vortex Indicator, Williams %R.
Perpetual Trend Indicators: EMA, ADX, Parabolic SAR, Supertrend, Donchian Channel, Ichimoku Cloud, RVGI.
How to Use the Indicator:
Raw Z-Score (Blue Line): This represents the real-time aggregated Z-score of all the indicators. It shows how far the current market conditions are from their average, helping you identify trends.
Moving Average of Z-Score (Orange Line): A smoothed version of the Z-score that helps confirm trends and eliminate noise.
Shaded Area: The area between the Z-score and its moving average is shaded green if the Z-score is above the moving average (bullish), and red if below the moving average (bearish).
Zero Line (Gray Line): Serves as a reference point. A Z-score crossing above zero could signal a bullish market, while crossing below zero could indicate bearish conditions.
This indicator helps in identifying market extremes and trend reversals by combining various technical indicators into a single aggregate score, ideal for spotting overbought or oversold conditions and possible trend shifts

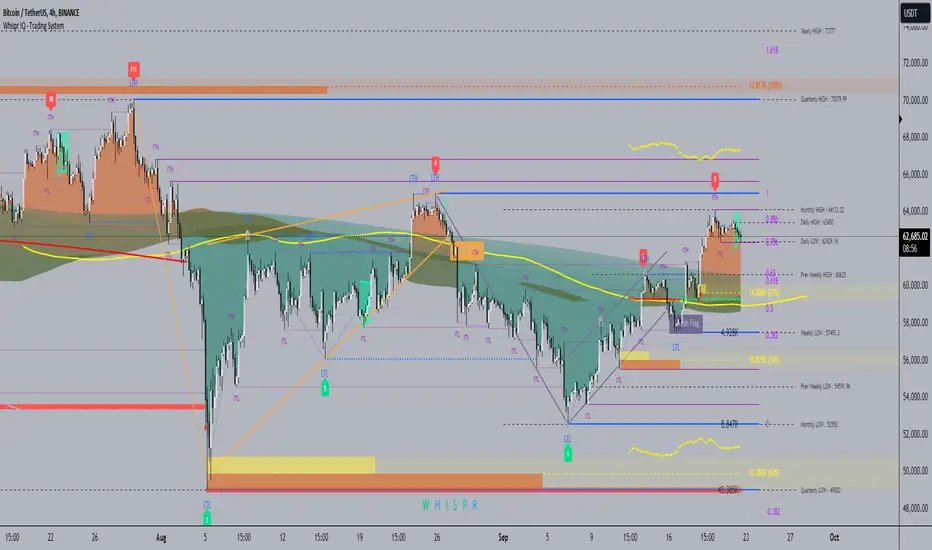
Whispr IQ - Trading SystemWhispr IQ - Trading System
This advanced multi-component indicator combines several powerful analysis tools to provide a comprehensive view of market conditions and potential trading opportunities.
Key Components:
Kernel Regression Ribbon
Institutional Order Flow
Volume Profile
Order Blocks
Swing Points and Liquidity
Naked POC (Point of Control)
Fibonacci Levels
Zig Zag Patterns
Divergence Scanner
Squeeze Bands
How It Works:
Kernel Regression Ribbon
Uses kernel regression to create a smoothed ribbon of price action
Multiple timeframes analyzed to show short, medium and long-term trends
Color coding indicates bullish/bearish bias
Institutional Order Flow
Identifies areas of high volume and potential institutional activity
Highlights order blocks, liquidity levels, and fair value gaps
Helps visualize potential support/resistance zones
Volume Profile
Displays volume distribution at different price levels
Identifies high volume nodes and value areas
Useful for determining potential reversal points
Order Blocks
Highlights significant swing highs/lows with high volume
Indicates potential areas where large players may have placed orders
Useful for identifying key support/resistance levels
Swing Points and Liquidity
Marks major swing highs and lows
Highlights areas of potential liquidity buildup
Helps identify trend changes and potential reversal zones
Naked POC
Shows uncovered Points of Control from volume profile analysis
Indicates areas of high trading activity that price has moved away from
Potential magnet for price to return to
Fibonacci Levels
Plots key Fibonacci retracement and extension levels
Useful for identifying potential support, resistance and targets
Multiple Fibonacci sequences used for confirmation
Zig Zag Patterns
Identifies key swing highs and lows
Filters out minor price movements
Helps visualize overall trend structure
Divergence Scanner
Scans for regular and hidden divergences on multiple indicators
Signals potential trend reversals or continuations
Configurable to scan RSI, MACD, CCI and other oscillators
Squeeze Bands
Identifies periods of low volatility (squeezes)
Signals potential for explosive moves when volatility expands
Based on Bollinger Bands and Keltner Channel relationships
The Whispr IQ system combines all these elements to provide a holistic view of market conditions. Traders can use the various signals and overlays to identify high-probability trade setups, key support/resistance levels, trend direction on multiple timeframes, and potential reversals.
This indicator is designed for experienced traders who can interpret the multiple data points and use them in conjunction with their own analysis and risk management. It's a powerful tool that can enhance trading decisions when used properly as part of a complete trading plan.
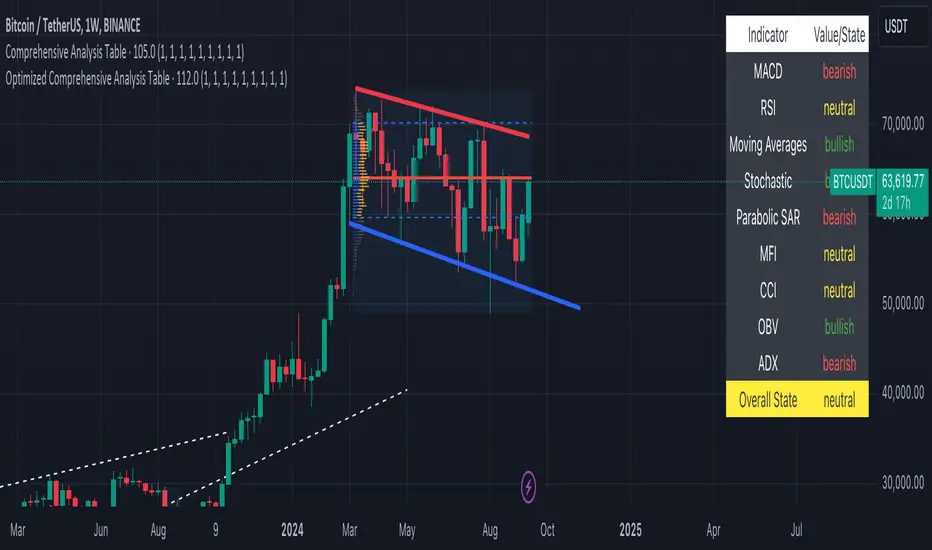
Optimized Comprehensive Analysis Table# Enhanced Comprehensive Analysis Table
This advanced indicator provides a holistic view of market sentiment by analyzing multiple technical indicators simultaneously. It's designed to give traders a quick, at-a-glance summary of market conditions across various timeframes and analysis methods.
## Key Features:
- Analyzes 9 popular technical indicators
- Weighted voting system for overall market sentiment
- Customizable indicator weights
- Clear, color-coded table display
## Indicators Analyzed:
1. MACD (Moving Average Convergence Divergence)
2. RSI (Relative Strength Index)
3. Moving Averages (50, 100, 200-period)
4. Stochastic Oscillator
5. Parabolic SAR
6. MFI (Money Flow Index)
7. CCI (Commodity Channel Index)
8. OBV (On Balance Volume)
9. ADX (Average Directional Index)
## How It Works:
Each indicator's signal is calculated and classified as bullish, bearish, or neutral. These signals are then weighted according to user-defined inputs. The weighted votes are summed to determine an overall market sentiment.
## Interpretation:
- The table displays the state of each indicator and the overall market sentiment.
- Green indicates bullish conditions, red bearish, and yellow neutral.
- The "Overall State" row at the bottom provides a quick summary of the combined analysis.
## Customization:
Users can adjust the weight of each indicator to fine-tune the analysis according to their trading strategy or market conditions.
This indicator is ideal for traders who want a comprehensive overview of market conditions without having to monitor multiple indicators separately. It's particularly useful for confirming trade setups, identifying potential trend reversals, and managing risk.
Note: This indicator is meant to be used as part of a broader trading strategy. Always combine with other forms of analysis and proper risk management.
Z-Score AggregatorOverview:
This indicator is designed to take multiple other indicators as inputs, calculate their respective Z-scores, and then aggregate these Z-scores to provide a comprehensive measure. By transforming the inputs into Z-scores, this indicator standardizes the data, enabling a more accurate comparison across different indicators, each of which may have different scales and distributions.
This indicator is beneficial for Mean-Reversion style trading and investing as it standardizes indicators and lets them work together in one system.
The Z-score, which represents how many standard deviations an element is from the mean, is a crucial statistical tool in this process. It allows the indicator to normalize the varying data points, ensuring that each indicator's contribution to the aggregate score is proportional to its deviation from the average performance.
Inputs:
Z-score length: How far Back it will take into account the inputs
Number Of Sources: This is to set the number of inputs the indicator uses so it calculates them properly and uses only the number of indicators you want.
Source Inputs: 1-10 inputs (no need to use them all as long as you set the number of used indicators beforehand).
Note:
There are three indicators used in this example which are CCI, RSI and Sharpe Ratio. The indicator calculates their individual Z-scores and takes an average. Because Number Of Sources is set to 3 it only uses the first 3 indicators in use.

Bitcoin PivotFind [BTC Cycle Tops & Bottoms Finder]What is PivotFind?
PivotFind is a custom indicator designed to track 30+ data points of different nature (technical, sentiment, macro, on-chain), and across multiple timeframes (from 1D to 60D), to detect the market conditions that may indicate the formation of potential Cycle Tops and Bottoms .
PivotFind's goal is to help you navigate Bitcoin's price movements and key happenings over its approximately 4-year cycles to help you craft a mid-term investment plan focused on the larger swings, rather than the shorter-term fluctuations.
What Does PivotFind Show/Do?
Market Phase Assessment and Visualization:
- Uses color-coded backgrounds (green for bull, red for bear, yellow for trend reversal) to show the current (assessed) market phase. Note that the price line itself changes color to reinforce the current phase identification.
- Helps you understand if we're in a uptrend, downtrend, or potentially changing direction (reversal), often an open question for traders, with a mid-term horizon
Cycle Top and Bottom Warnings:
- Places red dots above the price line to warn of potential cycle peaks.
- Shows green dots below the price line to indicate possible cycle bottoms.
These markers appear when multiple indicators reach certain thresholds, which historically have often coincided with significant market pivots (from bull to bear, or viceversa). Clusters of tops and bottom warnings are expected to appear at truly pivotal moments.
Parabolic Growth Signals:
- Displays upward arrows when conditions suggest potential for the rapid price increases that historically anticipated blow-off tops
- These signals are based on a combination of technical indicators and market sentiment reaching certain thresholds.
Altcoin Season Indicators:
- Marks with white diamonds the conditions that have historically led to "altseasons" (i.e. Altcoins overperforming BTC's growth rate).
- Based on factors like Bitcoin dominance decrease and certain altcoin performance metrics.
Fibonacci Retracement Bands:
Plots long-term support and resistance zones based on Fibonacci retracement levels.
These bands are calculated from previous major market highs and lows and shed light on the nature of short-term retracements in the context of major trends.
Price Scenario
PivotFind also provides reference price levels for the upcoming halving cycle, including potential thresholds for increased market interest (retail FOMO), possible overvaluation, and theoretical cycle peak ranges. These projections are based on historical data and should be considered as points of reference rather than definitive predictions.
Comprehensive Data Tables:
Right-side Table: Shows current cycle stage, Bitcoin/Altcoin market dominance percentages, and evaluates key economic factors (like inflation and interest rates) for their potential impact.
Bottom Table: Displays real-time values of over 30 key indicators, including RSI, MVRV ratio, and Fear & Greed Index.
Alerts
PivotFind offers you the ability to set up custom alerts (via the standard TradingView alert functionality) or receive automated notifications for significant market events. Despite its sophisticated analysis, PivotFind is designed to be user-friendly, with pre-set parameters that don't require complex adjustments.
How Does It Work?
PivotFind analyzes over 30 different indicators across multiple timeframes (from 1 day to 60 days), grouped into four main categories:
1. Technical Analysis:
Uses standard indicators like RSI, Stochastic RSI, Williams %R, Elliot Oscillator, TDI, and mean reversion concepts.
Looks for divergences between price and multiple indicators (like OBV, MFI, CCI, RSI, SRSI, MACD and others) to spot potential reversals.
2. Market Sentiment:
Incorporates the Crypto Fear & Greed Index (0-100 scale).
Tracks social media trends and influencer follower counts as a gauge of public interest.
3. Macroeconomic Factors:
Monitors inflation rates, interest rates, US rate yields, and money supply (M2) figures.
Tracks the U.S. Dollar Index (DXY) and bond market health through ETFs like TLT and HYG.
4. On-Chain Analytics:
Analyzes MVRV (Market Value to Realized Value) ratio to spot potential over/undervaluation.
Examines NUPL (Net Unrealized Profit/Loss) and active Bitcoin addresses.
PivotFind analyzes these indicators collectively, looking for significant correlations and confluences, to provide a view of the market's position within the 4-year cycle and spot the conditions for potential Cycle tops and bottoms (cycle pivots).
Who Is This For?
PivotFind may be particularly useful for:
- Long-term investors looking to optimize entry and exit points within the 4-year cycle
- Individuals who want to understand mid-term trends without engaging in daily analysis of multiple charts (due to lack of time and/or financial knowledge)
- Bitcoin Holders and miners planning their decisions around critical market pivot points
It's less suitable for scalpers, day-traders or those focused on short-term price movements.
Value Proposition
PivotFind simplifies market analysis by bringing together a wide range of indicators and data sources across different timeframes. It uses built-in logic to interpret these inputs within the context of Bitcoin's cycles, giving users an efficient way to spot potential major market shifts. This all-in-one approach helps make sense of complex market conditions and supports more informed decision-making.
Since Bitcoin’s broader cycle strongly influences the entire crypto market, PivotFind can also be useful for investors who are focused on Altcoins, not just Bitcoin.
Important Note (Disclaimer)
Past performance, and patterns, do not guarantee future results. Therefore, PivotFind should be used as one of many tools in your analysis. While the indicator provides a multi-faceted and multi-timeframe analysis of factors historically correlated with pivotal price shifts, it cannot predict future prices with certainty. It's a tool to help inform your decisions, not make them for you. Always conduct your own research and remember that all investments, especially in cryptocurrencies, involve risk.
Recommended Settings
PivotFinds works best on the 1D INDEX:BTCUSD chart (dark-mode, logarithmic scale).
This indicator is not publicly available and requires special access.

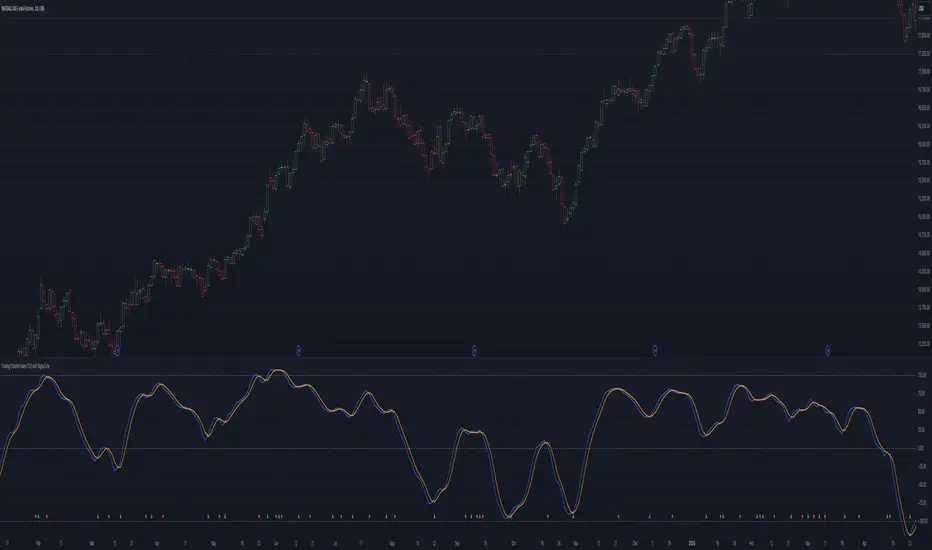
Trading Channel Index (TCI)Overview:
The Trading Channel Index (TCI) is a technical analysis tool designed to identify cyclical trends in financial markets by smoothing out price movements and reducing volatility compared to traditional oscillators, like the Commodity Channel Index (CCI). The TCI helps traders pinpoint overbought and oversold conditions, as well as gauge the strength and direction of market trends.
Calculation:
The TCI is calculated through a multi-step process:
Typical Price (Xt): The typical price is computed as the average of the high, low, and close prices for each bar:
Xt = (High + Low + Close) / 3
Exponential Average (Et): This step smooths the typical price over a specified number of bars (TCI Channel Length) using an exponential moving average (EMA). The smoothing factor alpha is derived from the channel length:
Et = alpha * Xt + (1 - alpha) * Et
Where alpha = 2 / (TCI Channel Length + 1).
Average Deviation (Dt): The average deviation measures how much the typical price deviates from the exponential average over time. This is also smoothed using the EMA:
Dt = alpha * abs(Et - Xt) + (1 - alpha) * Dt
Channel Index (CI): The Channel Index is calculated by normalizing the difference between the typical price and the exponential average by the average deviation:
CI = (Xt - Et) / (0.15 * Dt)
Trading Channel Index (TCI): Finally, the TCI is generated by applying additional smoothing to the Channel Index using another EMA over the specified number of bars (TCI Average Length). The smoothing factor beta is derived from the average length:
TCI = beta * CI + (1 - beta) * TCI
Indicator Variables:
TCI Channel Length:
- Description: This variable sets the number of historical bars used to calculate the Channel Index (CI). A shorter length results in a more sensitive CI that responds quickly to price changes, while a longer length produces a smoother and less volatile CI.
- Default Value: 21
TCI Average Length:
-Description: This variable determines the number of bars over which the Channel Index (CI) is smoothed to produce the TCI. A shorter length makes the TCI more responsive to recent price changes, whereas a longer length further smooths the TCI, reducing its sensitivity to short-term fluctuations.
-Default Value: 10
Usage:
Overbought and Oversold Conditions: The TCI often uses levels such as +100 and -100 to identify potential reversal points. When the TCI crosses above +100, it might indicate an overbought condition, signaling a potential sell. Conversely, when it crosses below -100, it could indicate an oversold condition, suggesting a potential buy.
Trend Identification: Sustained values above 0 typically indicate a bullish trend, while values below 0 suggest a bearish trend. The TCI's smoothness helps traders stay in trends longer by reducing the impact of short-term market noise.
Conclusion:
The Trading Channel Index (TCI) is a versatile and powerful tool for traders who wish to capture cyclical price movements with a reduced level of noise. By adjusting the TCI Channel Length and TCI Average Length, traders can tailor the indicator to suit different market conditions, making it applicable across various timeframes and asset classes.
Oster's Fair Economy (OFE)Overview:
Oster's Fair Economy (OFE) is a powerful tool designed to give traders and investors a comprehensive assessment of the fair value of major stock indices . Unlike conventional indicators that focus solely on technical analysis, OFE emphasizes economic metrics to offer a deeper understanding of the market's intrinsic value. By applying Oster's method (explained below), OFE determines the fundamental fair price of key indices, making it an invaluable tool for top-down analysis and market confirmation. It is particularly useful for swing trading on indices and as a top-down confirmation for individual stock trades.
Important Note:
OFE is designed for use with indices, not individual stocks : Stocks are often driven by their own fundamental factors, such as earnings, revenue, and dividend yields, which may not align with broad economic metrics. While OFE can sometimes provide insights into individual stocks, particularly those highly correlated with broader market trends, it is specifically intended for index analysis.
OFE is optimized for Weekly Candles (W ): OFE is most effective when used with weekly data, as it aligns with the longer-term outlook of economic analyses. While it can be used with smaller timeframes, weekly data is recommended for the most accurate insights.
Innovative Approach to Economic Analysis:
OFE integrates a unique combination of key economic metrics , including:
Gross National Product (GNP)
Consumer Price Index (CPI)
Unemployment Rate (UR)
Interest Rate (e.g., FED)
Nonfarm Payrolls (NFP)
Retail Sales (RS)
Industrial Production (IP)
Balance Of Trade (BOT)
Money Supply M2 (M2)
Consumer Confidence Index (CCI)
These metrics are tailored for 20 different markets : United States (US), Canada (CA), European Union (EU), Germany (DE), United Kingdom (GB), France (FR), Italy (IT), Switzerland (CH), Spain (ES), Australia (AU), New Zealand (NZ), Japan (JP), China (CN), Hong Kong (HK), South Korea (KR), India (IN), Russia (RU), Brazil (BR), Mexico (MX), and Saudi Arabia (SA).
This comprehensive set of data allows traders to gauge the potential for growth, inflation, and overall market conditions . OFE's weighting system reflects the importance of these metrics in determining the fair value of indices according to Oster's methodology .
How OFE Works:
OFE's calculation methodology is designed to provide insights into whether an index is fundamentally overvalued, undervalued, or trading at fair value by comparing its price dynamics with economic data. Here’s a step-by-step breakdown of how OFE works:
Economic Data Collection : OFE retrieves relevant economic data from the selected region, such as GDP, CPI, and interest rates. If specific market data is unavailable, OFE defaults to the US market as a fallback.
Normalization and Weighting : The collected economic metrics are normalized against historical trends to ensure that the data reflects both current levels and long-term averages. For example, GDP growth rates are normalized based on historical data, allowing for a comparison across different economic periods. Similarly, CPI and unemployment rates are adjusted to account for historical context, ensuring that high inflation or unemployment is appropriately weighed relative to past conditions. However, all other macroeconomic key figures are also processed in the same way.
Relating Economic Metrics to Price Dynamics : OFE calculates specific ratios by comparing the selected index’s price with the normalized economic data. These ratios, such as the GNP ratio, are then analyzed within the context of historical performance. The goal is to establish a relationship between the economic indicators and the index’s historical price behavior. For instance, if the GNP ratio is currently higher than historical norms, it could suggest that the index is overvalued relative to the economy’s actual productivity.
Fair Value Calculation : Based on the derived ratios and their historical correlations with index prices, OFE computes a fair value for the index. This calculation integrates multiple economic indicators, each weighted according to its perceived importance in influencing the index. For example, in a high-growth environment, GDP and industrial production might carry more weight, whereas in a recession, unemployment and interest rates could become more influential. The resulting fair value reflects the index's price adjusted for the current economic environment.
Price Comparison : The calculated fair value is then compared to the current market price of the index. If the market price significantly deviates from the fair value, it suggests that the index is either overvalued or undervalued. For example, if the fair value of the S&P 500 is calculated to be 10% lower than its current market price, OFE would indicate that the index might be overvalued, potentially signaling a market correction. The fair price line basically acts as a kind of magnet that keeps attracting the index price. This is because, in the longer term, the broad market is always guided by the economic health of the country in concerned.
Market Dynamics Consideration : By adjusting the "Strictness" level in OFE, users can control how sensitive the fair value calculation is to economic fundamentals. A higher strictness level would highlight discrepancies between the fair value and the market price more aggressively, suggesting a higher likelihood of market mispricing. Conversely, a lower strictness level allows for greater flexibility, acknowledging that markets can sometimes deviate from fundamental values without immediate correction.
Customizable Parameters for Tailored Analysis:
OFE offers extensive customization options to align with your specific investment strategy. Users can:
Select or deselect economic metrics for inclusion.
Adjust the weighting of each metric to reflect its importance in their analysis.
Fine-tune the strictness of the valuation process (as explained above).
Additionally, users can compare different indices with various macroeconomic data sets . For example, you might select the DAX index and apply US economic data to see how the index would perform if driven by US market fundamentals. This feature enables a highly tailored and region-specific analysis, empowering traders to align OFE with their individual perspectives and market outlooks.
Interpretation:
If the calculated fair price is above the current index value, the index is considered fundamentally undervalued, indicating potential for price increases. Conversely, if the fair price is below the current index value, the index is seen as overvalued, suggesting potential risks or a possible correction. The fair price acts as a gravitational force, pulling the index toward its true economic value over time.
This over- or undervaluation can also serve as an overarching economic confirmation for stock trading . For example, it might be advantageous to buy individual stocks when the broader market is fundamentally undervalued, as the general upward potential of the market could support stock price increases. Conversely, selling or avoiding stocks when the broader market is overvalued could help mitigate potential risks, as the market may be primed for a correction.
Conclusion:
Oster's Fair Economy (OFE) bridges the gap between technical simplicity and the depth of macroeconomic analysis . By integrating complex economic metrics with user-friendly customization, OFE empowers traders and investors to assess the fair valuation of indices confidently . This tool is ideal for confirming market trends and gaining a broader understanding of the economic landscape, making it a valuable asset in any investment toolkit.

Comprehensive Technical AnalysisComprehensive Technical Analysis Script
Overview
This Script for TradingView is designed to perform and display a detailed technical analysis using a range of moving averages and oscillators. The script provides a summary of market conditions based on various indicators to help traders make informed decisions.
Key Features - Technical Indicators:
Moving Averages:
Simple Moving Average (SMA): Calculates the average price over a specified period.
Exponential Moving Average (EMA): Reacts faster to recent price changes by giving more weight to recent prices.
Weighted Moving Average (WMA): Weighs prices based on their position, giving more importance to recent prices.
Hull Moving Average (HMA): Reduces lag and provides a smoother trend line.
Triple Exponential Moving Average (TEMA): Combines three EMAs to minimize lag and offer a responsive trend indicator.
Exponential Moving Average of an Exponential Moving Average (EMAX): Applies an EMA twice to smooth out trends further.
Triangular Moving Average (TMA): Provides a smoother moving average by averaging over a triangular window.
Oscillators:
Relative Strength Index (RSI): Measures the speed and change of price movements to identify overbought or oversold conditions.
Stochastic Oscillator (%K): Compares a security’s closing price to its price range over a specific period to spot potential reversal points.
Commodity Channel Index (CCI): Identifies cyclical trends and measures the deviation of the price from its average.
Moving Average Convergence Divergence (MACD): Shows the relationship between two EMAs to identify changes in trend strength, direction, momentum, and duration.
Awesome Oscillator (AO): Measures market momentum by comparing two different moving averages.
Average Directional Index (ADX): Determines the strength of a trend and whether the market is trending or ranging.
Williams %R (WPR): Identifies overbought and oversold levels with a different calculation approach compared to the RSI.
Point System - Indicator Points:
Bullish Signal: Each indicator contributing to a positive market sentiment adds points.
Bearish Signal: Each indicator contributing to a negative market sentiment subtracts points.
Point Calculation:
Moving Averages: Points are assigned based on whether the current price is above or below each moving average.
Oscillators: Points are assigned based on whether the oscillator values are in bullish or bearish zones.
Summary Text:
Categorization: Based on the total points calculated from all indicators, the market condition is categorized into:
Strong Bullish: More than 8 points
Bullish: Between 3 and 8 points
Neutral: Between -2 and 2 points
Bearish: Between -3 and -8 points
Strong Bearish: Less than -8 points
Text Display: The summary text reflects the overall market sentiment and is color-coded for easy interpretation.
Table Display - The Position of the table can be customized by the user:
Vertical: Options include Top, Center, Bottom
Horizontal: Options include Left, Center, Right
Table Content:
Summary Text and Points: Displays the summary of technical indicators along with the calculated points.

Multiple Divergences [UAlgo]🔶 Description:
"Multiple Divergences " is providing insights into potential divergences across multiple indicators. Divergence, a concept in technical analysis, occurs when the price of an asset diverges from the direction of an accompanying indicator, suggesting a possible reversal or continuation in the price trend.
🔶 Key Features:
Customizable Divergence Settings: Users can adjust parameters such as the minimum number of divergences required to display labels, pivot lookback periods, and plot options for various types of divergences (regular or hidden) and bullish/bearish labels.
Multiple Technical Indicators: The script supports a wide range of popular indicators, including MACD, RSI, Stochastic, CCI, Momentum, OBV, DMI Oscillator, VWmacd, Chaikin Money Flow, Money Flow Index, and Awesome Oscillator. You can choose any of the above-mentioned technical indicators for which you want to capture divergences.
🔶 Purpose of Using Multiple Technical Indicators
In the complex and volatile world of trading, relying on a single indicator can provide an incomplete or misleading picture of market conditions. Different technical indicators analyze various aspects of price movement, volume, and momentum, offering unique insights that can complement each other. By utilizing multiple indicators, traders can cross-verify signals, reduce false positives, and increase the reliability of their trading decisions.
Identifying divergences across multiple indicators further enhances this reliability, as a divergence spotted in several indicators simultaneously is a stronger signal than one found in isolation. This comprehensive approach helps traders to anticipate potential market turning points with greater confidence and precision.
By integrating multiple technical indicators and meticulously tracking their divergences, this script aims traders with a robust tool for navigating the complexities of financial markets.
🔶 How to Obtain Divergences
Regular Bullish Divergence:
This occurs when the price makes a new lower low compared to a previous pivot low, indicating a downward trend. Simultaneously, the selected oscillator makes a higher low compared to its previous pivot low, indicating a potential upward momentum. This divergence suggests that, despite the falling price, the underlying momentum is strengthening, potentially signaling a reversal to an upward trend.
Regular Bearish Divergence:
This happens when the price makes a new higher high compared to a previous pivot high, indicating an upward trend. Concurrently, the selected oscillator makes a lower high compared to its previous pivot high, indicating weakening momentum. This divergence suggests that, despite the rising price, the underlying momentum is weakening, potentially signaling a reversal to a downward trend.
Example for Regular Bullish and Regular Bearish Divergences (Minimum Divergenes Count to Display = 3, All Selected):
Hidden Bullish Divergence:
Hidden bullish divergence is observed when the price makes a higher low compared to a previous pivot low, indicating an upward trend. At the same time, the oscillator makes a lower low compared to its previous pivot low, indicating a potential strengthening momentum. This condition suggests that the underlying strength of the upward trend is intact, despite the oscillator indicating otherwise.
Hidden Bearish Divergence:
This occurs when the price makes a lower high compared to a previous pivot high, indicating a downward trend. Simultaneously, the oscillator makes a higher high compared to its previous pivot high, indicating a potential weakening momentum. This divergence suggests that the underlying weakness of the downward trend is intact, despite the oscillator indicating otherwise.
Divergence Labeling: The script dynamically generates labels on the chart to visually highlight detected divergences based on user-defined criteria. (E.g. "5 Regular Bullish Divs." , "1 Hidden Bearish Div")
🔶 Disclaimer:
Use with Caution: This indicator is provided for educational and informational purposes only and should not be considered as financial advice. Users should exercise caution and perform their own analysis before making trading decisions based on the indicator's signals.
Not Financial Advice: The information provided by this indicator does not constitute financial advice, and the creator (UAlgo) shall not be held responsible for any trading losses incurred as a result of using this indicator.
Backtesting Recommended: Traders are encouraged to backtest the indicator thoroughly on historical data before using it in live trading to assess its performance and suitability for their trading strategies.
Risk Management: Trading involves inherent risks, and users should implement proper risk management strategies, including but not limited to stop-loss orders and position sizing, to mitigate potential losses.
No Guarantees: The accuracy and reliability of the indicator's signals cannot be guaranteed, as they are based on historical price data and past performance may not be indicative of future results.

All Divergences with trend / SL - Uncle SamThanks to the main inspiration behind this strategy and the hard work of:
"Divergence for many indicators v4 by LonesomeTheBlue"
The "All Divergence" strategy is a versatile approach for identifying and acting upon various divergences in the market. Divergences occur when price and an indicator move in opposite directions, often signaling potential reversals. This strategy incorporates both regular and hidden divergences across multiple indicators (MACD, Stochastics, CCI, etc.) for a comprehensive analysis.
Key Features:
Comprehensive Divergence Analysis: The strategy scans for regular and hidden divergences across a variety of indicators, increasing the probability of identifying potential trade setups.
Trend Filter: To enhance accuracy, a moving average (MA) trend filter is integrated. This ensures trades align with the overall market trend, reducing the risk of false signals.
Customizable Risk Management: Users can adjust parameters for long/short stop-loss and take-profit levels to match their individual risk tolerance.
Additional Risk Management (Optional): An experimental MA-based risk management feature can be enabled to close positions if the market shows consecutive closes against the trend.
Clear Visuals: The script plots pivot points, divergence lines, and stop-loss levels on the chart for easy reference.
Strategy Settings (Defaults):
Enable Long/Short Strategy: True
Long/Short Stop Loss %: 2%
Long/Short Take Profit %: 5%
Enable MA Trend: True
MA Type: HMA (Hull Moving Average)
MA Length: 500
Use MA Risk Management: False (Experimental)
MA Risk Exit Candles: 2 (If enabled)
Pivot Period: 9
Source for Pivot Points: Close
Backtest Details (Example):
The strategy has been backtested on XAUUSD 1H (Goold/USD 1 hour timeframe) with a starting capital of $1,000. The backtest period covers around 2 years. A commission of 0.02% per trade and a 0.1% slippage per trade were factored in to simulate real-world trading costs.
Disclaimer:
This strategy is for educational and informational purposes only. Backtested results are not indicative of future performance. Use this strategy at your own risk. Always conduct your own analysis and consider consulting a financial professional before making any trading decisions.
Important Notes:
The default settings are a good starting point, but feel free to experiment to find optimal parameters for your specific trading style and market.
The MA-based risk management is an experimental feature. Use it with caution and thoroughly test it before deploying in live trading.
Backtest results can vary depending on the market, timeframe, and specific settings used. Always consider slippage and commission fees when evaluating a strategy's potential profitability.

Flush Percent RangeFans of Woodies CCI may recognize the approach to this one. This is my attempt at using the same methods but for taking the highs and lows into account without the standard deviation of the CCI. The smoothness of other oscillators may not be ideal however the Williams Percent Range is a fast stochastic that also operates within a channel. This provides an alternative yet still complex view for the virtuoso. A unique feature is total utilization of the weighted moving average, from the standard to the more complex. A fun fact is the Hull Moving Average is actually calculated using weighted moving averages.
How to use:
The base length is for accuracy, the fast length is for catching all the moves(even the wrong ones sometimes.)
The bars back option will not flip the histogram/base trend to its bullish/bearish alternative until the base plot remains on the latter half of the oscillator for a certain number of bars. This can be set to zero if desired.
The factor controls the chop on the various levels. A higher number will increase it.
The oscillator levels are measuring slope, price relative to the average, and a summation of percent changes between the two. Both the baseline/histogram and the levels have color coding for bullishness, bearishness, and indecision(depending on the factor.) The fast line matches the indecision color by default. This is all customizable.
There are many potential ways to trade with this indicator. From hooks back toward the trend and range line crossovers to divergence and reversals. It's important to note the current performance of the oscillator levels. Time cycles may come in handy along with other forecasting tools.
Lastly, there are optional linear regression lines plotted on the chart. They're synchronized to the lengths in the oscillator. This is an additional visual aid to provide context to the direction of the channel.
Overall the Flush Percent Range is for analyzing multiple regression models within a single price channel. No smoothing, fast averages, and specified timeframes of highs/lows. Credit to Larry Williams for the original calculation and Ken Woods for design/methodology inspiration.

Market Sentiment Technicals [LuxAlgo]The Market Sentiment Technicals indicator synthesizes insights from diverse technical analysis techniques, including price action market structures, trend indicators, volatility indicators, momentum oscillators, and more.
The indicator consolidates the evaluated outputs from these techniques into a singular value and presents the combined data through an oscillator format, technical rating, and a histogram panel featuring the sentiment of each component alongside the overall sentiment.
🔶 USAGE
The Market Sentiment Technicals indicator is a tool able to swiftly and easily gauge market sentiment by consolidating the individual sentiment from multiple technical analysis techniques applied to market data into a single value, allowing users to asses if the market is uptrending, consolidating, or downtrending.
The tool includes various components and presentation formats, each described in the sub-sections below.
🔹Indicators Sentiment Panel
The indicators sentiment panel provides normalized sentiment scores for each supported indicator, along with a synthesized representation derived from the average of all individual normalized sentiments.
🔹Market Sentiment Meter
The market sentiment meter is obtained from the synthesized representation derived from the average of all individual normalized sentiments. It allows users to quickly and easily gauge the overall market sentiment.
🔹Market Sentiment Oscillator
The market sentiment oscillator provides a visual means to monitor the current and historical strength of the market. It assists in identifying the trend direction, trend momentum, and overbought and oversold conditions, aiding in the anticipation of potential trend reversals.
Divergence occurs when there is a difference between what the price action is indicating and what the market sentiment oscillator is indicating, helping traders assess changes in the price trend.
🔶 DETAILS
The indicator employs a range of technical analysis techniques to interpret market data. Each group of indicators provides valuable insights into different aspects of market behavior.
🔹Momentum Indicators
Momentum indicators assess the speed and change of price movements, often indicating whether a trend is strengthening or weakening.
Relative Strength Index (RSI): Measures the magnitude of recent price changes to evaluate overbought or oversold conditions.
Stochastic %K: Compares the closing price to the range over a specified period to identify potential reversal points.
Stochastic RSI Fast: Combines features of Stochastic oscillators and RSI to gauge both momentum and overbought/oversold levels efficiently.
Commodity Channel Index (CCI): Measures the deviation of an asset's price from its statistical average to determine trend strength and overbought and oversold conditions.
Bull Bear Power: Evaluates the strength of buying and selling pressure in the market.
🔹Trend Indicators
Trend indicators help traders identify the direction of a market trend.
Moving Averages: Provides a smoothed representation of the underlying price data, aiding in trend identification and analysis.
Bollinger Bands: Consists of a middle band (typically a simple moving average) and upper and lower bands, which represent volatility levels of the market.
Supertrend: A trailing stop able to identify the current direction of the trend.
Linear Regression: Fits a straight line to past data points to predict future price movements and identify trend direction.
🔹Market Structures
Market Structures: Analyzes the overall pattern of price movements, including Break of Structure (BOS), Market Structure Shifts (MSS), also referred to as Change of Character (CHoCH), aiding in identifying potential market turning and continuation points.
🔹The Normalization Technique
The normalization technique employed for trend indicators relies on buy-sell signals. The script tracks price movements and normalizes them based on these signals.
normalize(buy, sell, smooth)=>
var os = 0
var float max = na
var float min = na
os := buy ? 1 : sell ? -1 : os
max := os > os ? close : os < os ? max : math.max(close, max)
min := os < os ? close : os > os ? min : math.min(close, min)
ta.sma((close - min)/(max - min), smooth) * 100
In this Pine Script snippet:
The variable os tracks market sentiment, taking a value of 1 for buy signals and -1 for sell signals, indicating bullish and bearish sentiments, respectively.
max and min are used to identify extremes in sentiment and are updated based on changes in os . When market sentiment shifts from buying to selling (or vice versa), max and min adjust accordingly.
Normalization is achieved by comparing current price levels to historical extremes in sentiment. The result is smoothed by default using a 3-period simple moving average. Users have the option to customize the smoothing period via the script settings input menu.
🔶 SETTINGS
🔹Generic Settings
Timeframe: This option selects the timeframe for calculating sentiment. If a timeframe lower than the chart's is chosen, calculations will be based on the chart's timeframe.
Horizontal Offset: Determines the distance at which the visual components of the indicator will be displayed from the primary chart.
Gradient Colors: Allows customization of gradient colors.
🔹Indicators Sentiment Panel
Indicators Sentiment Panel: Toggle the visibility of the indicators sentiment panel.
Panel Height: Determines the height of the panel.
🔹Market Sentiment Meter
Market Sentiment Meter: Toggle the visibility of the market sentiment meter (technical ratings in the shape of a speedometer).
🔹Market Sentiment Oscillator
Market Sentiment Oscillator: Toggle the visibility of the market sentiment oscillator.
Show Divergence: Enables detection of divergences based on the selected option.
Oscillator Line Width: Customization option for the line width.
Oscillator Height: Determines the height of the oscillator.
🔹Settings for Individual Components
In general,
Source: Determines the data source for calculations.
Length: The period to be used in calculations.
Smoothing: Degree of smoothness of the evaluated values.
🔹Normalization Settings - Trend Indicators
Smoothing: The period used in smoothing normalized values, where normalization is applied to moving averages, Bollinger Bands, Supertrend, VWAP bands, and market structures.
🔶 LIMITATIONS
Like any technical analysis tool, the Market Sentiment Technicals indicator has limitations. It's based on historical data and patterns, which may not always accurately predict future market movements. Additionally, market sentiment can be influenced by various factors, including economic news, geopolitical events, and market psychology, which may not be fully captured by technical analysis alone.

SMT/Divergence Suite (any Indicator)Hello Traders!
The TRN SMT/Divergence Suite detects divergences for any given indicator, even custom ones and divergences any two given instruments (SMT – smart money technique/tool). The indicator finds with unrivaled precision bullish and bearish as well as regular and hidden divergences. The main difference compared to other SMT/divergences indicators is that this indicator finds rigorously the extreme peaks of each swing, both in price and in the corresponding indicator/instrument. This precision is unmatched and therefore this is one of the best SMT/divergences detectors. The indicator helps traders to identify potential changes in trend before they occur.
Feature List
Works with any given custom oscillators or indicator
SMT (Smart Money Technique)/Divergence detecting for any given instruments
11 different build-in oscillators (incl. Cumulative Delta)
Customizable look and feel
The TRN SMT/Divergence Suite works with any given indicator, even custom ones. In addition, there are 11 built-in indicators. We have chosen a selection of different momentum, trend following and volume oscillators that gives you maximum flexibility. Most noticeable is the cumulative delta indicator, which works astonishingly well as a divergence indicator.
Following is the full list of the build in indicators/oscillators:
Awesome Oscillator (AO)
Commodity Channel Index (CCI)
Cumulative Delta Volume (CDV)
Chaikin Money Flow (CMF)
Moving Average Convergence Divergence (MACD)
Money Flow Index (MFI)
Momentum
On Balance Volume (OBV)
Relative Strength Index (RSI)
Stochastic
Williams Percentage Range (W%R)
The divergences are colored with vivid lines and labels. Bullish divergences are distinguished with luminous blue lines, while bearish divergences are denoted by striking red lines. Upon detecting a divergence, the colored lines act as a visual indicator for traders, signaling an imminent possibility of a trend reversal. In response, traders can leverage this valuable insight to make informed decisions in their trading activities.
Choose Your Custom Divergence Indicator
Handpick your custom indicator, and the TRN SMT/Divergence Suite will hunt for divergences in your preferred market and timeframe. Importantly, you must add the indicator to your chart. Afterwards, simply go to the “Parameters” section in the indicator settings and choose "External Indicator/SMT". If the custom indicator has one reference value, then choose this value in the “External Indicator/SMT (High)” field. If there are high and low values (e.g. candles), then you also must set the “External Indicator Low/SMT” field.
In the provided graphic, we've chosen the stochastic RSI as our example, and as you can see, the TRN SMT/Divergence Suite instantly identifies and plots bullish and bearish divergences on your chart.
Make sure that the TRN SMT/Divergence Suite is in the same panel as the custom divergence indicator and that both indicators are pinned to the same scale of your chart.
Smart Money Technique (SMT)/Divergence detecting in Relation to other Instruments
Smart Money Technique/Tool (SMT) means the divergence detection between two related instruments. The TRN SMT/Divergence Suite finds divergences in relation to other instruments, e.g. NQ vs. ES or BTCUSDT vs. ETHUSDT. Just add another instrument to the chart. As representation style you can choose lines or candles/bars. Afterwards, simply go to the “Parameters” section in the indicator settings and choose "External Indicator/SMT". If the second instrument is represented as line, then choose this value in the “External Indicator/SMT (High)” field. If there are high and low values (e.g. candles/bars), then you also must set the “External Indicator/SMT Low” field.
The detection of SMTs can help traders to decide whether the trend continues, or a reversal is imminent. E.g. if the NQ makes a new higher high but the ES fails to do so and makes a new lower high, then the TRN SMT/Divergence Suite shows a divergence. As a result, the probability is high that the trend will not continue, and the trader can make an informed decision about what to do next.
How to set Parameters for Divergence Indicators
To begin, access the indicator settings. Look for the "Parameters" section where you can fine-tune Parameters 1-3. The default settings are already optimized for the oscillators AO, RSI, CDV, W%R, MFI and Stochastic. For other divergence indicators, you might want to adjust the settings to your liking. The parameter order is the same as in the corresponding divergence indicator.
What are Divergences?
When the price of an asset moves in one direction, but its indicators move in the opposite direction, this is called a divergence. Divergences can be a powerful signal that a trend reversal is about to occur.
There are two types of regular divergences: bullish and bearish. A bullish divergence occurs when the price of an asset makes a lower low, but its indicators make a higher low. This can be a sign that the asset is oversold and that a reversal is imminent. A bearish divergence, on the other hand, occurs when the price of an asset makes a higher high, but its indicators (such as Relative Strength Index - RSI) make a lower high. This can be a sign that the asset is overbought and that a reversal is imminent.
Next to regular divergences there are hidden divergences. These divergences occur when the price of an asset moves in the opposite direction of an indicator, suggesting a possible shift in the underlying trend. In trading, hidden bearish and hidden bullish divergences are patterns that traders often look for on price charts to identify potential trend reversals or continuation patterns.
Conclusion
While signals from TRN SMT/Divergence Suite can be informative, it is important to recognize that their reliability may vary. Bearish and bullish divergences are not foolproof indicators and should be used in conjunction with other analysis techniques and risk management strategies.
Risk Disclaimer
The content, tools, scripts, articles, and educational resources offered by TRN Trading are intended solely for informational and educational purposes. Remember, past performance does not ensure future outcomes.
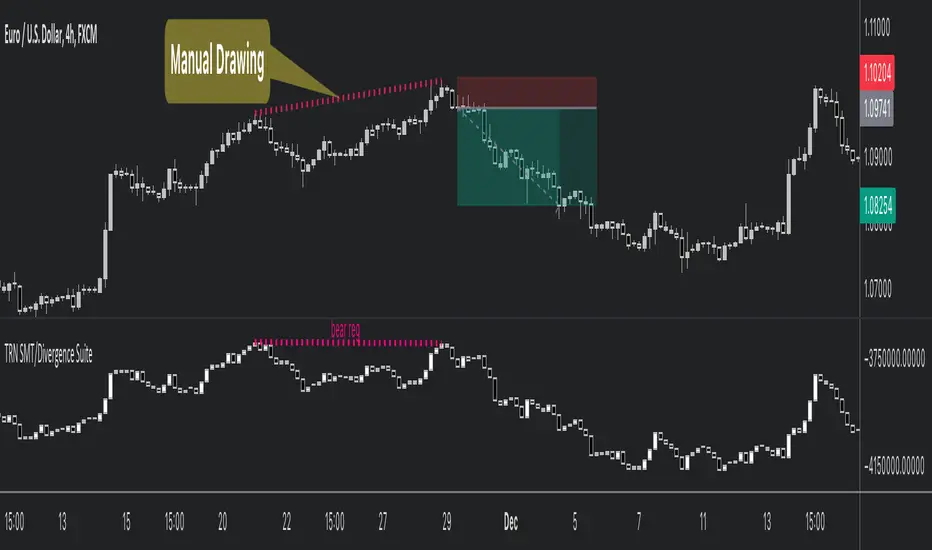
Trend and Reversal ScannerHello Traders!
The TRN Trend and Reversal Scanner highlights in a user-friendly and easy to read table trend and reversal signals from up to 20 assets of your choosing. With it, you can efficiently monitor your preferred instruments simultaneously without jumping from one chart to the next. You will never miss a signal again. The indicator automatically finds swing-based up and down trends, bullish and bearish divergences, detects ranges and range breakouts as well as trend and reversal signals by the built-in trend detection algorithm called TRN Bars. Furthermore, you can conveniently stay updated with real-time alerts, notifying you whenever the scanner finds interesting market situations.
Feature List
Swing-based up and down trend detection
Divergence detection for any given (Custom) Indicator
Price range and breakout detection
Bar trend and reversal detection
Scanner alerts
The value of this indicator is to support traders to easily identify trend-based signals in an automated way and across many different markets at the same time. The trader saves a lot of time scanning the markets for up and down swings, divergences, consolidations and bar pattern-based trends and reversals, since finding and alerting these signals is done automatically for the trader.
For a visualization of the detected signals, you can add the TRN Bars and the Swing Suite indicator to your chart.
How does Trend Scanner work?
On the right side of the chart, you can find a table displaying the symbols monitored by the TRN Trend and Reversal Scanner for signal detection (first column). The table provides information on the status of each symbol. This visual representation allows you to quickly identify evolving signals across different symbols, helping you stay informed and make timely trading decisions.
The scanner operates specifically on the timeframe you are currently viewing, ensuring that the detected signals align precisely with your trading perspective.
In the following, we will describe the different signals displayed in the different columns of the table
Column 1 – Symbols
Column 2 – Bar Trend & Signals
Column 3 – Up & Down Swing Trend
Column 4 – Ranges & Range Breakouts
Column 5 – Bullish Divergences
Column 6 – Bearish Divergences
Bar Trend & Signals
In the second column, you can observe the status of TRN Bars, the built-in trend detection algorithm.
UP – Uptrend
DN – Downtrend
REV (Green) – Bullish Reversal Bar
REV (Red) – Bearish Reversal Bar
CON (Green) – Bullish Continuation Bar
CON (Red) – Bearish Continuation Bar
B/O (Green) – Bullish Range Breakout Bar
B/O (Red) – Bearish Range Breakout Bar
TRN Bars is designed to spot bullish and bearish trends and reversals. The trend analysis is based on a new algorithm that weights several different inputs:
classical and advanced bar patterns and their statistical frequency
probability distributions of price expansions after certain bar patterns
bar information such as wick length in %, overlapping of the previous bar in % and many more
historical trend and consolidation analysis
It provides high-probability trend continuation analysis and reversal detections.
Up and Downtrend
The second column (Trend) indicates whether the price of the asset moves within an uptrend (UP) or a downtrend (DN), as detected by our unique swing detection algorithm, on the selected timeframe.
The swing detection algorithm identifies pivot points (swings) with high accuracy. It works in real-time and does not need a look-a-head to find swings.
Ranges & Range Breakouts
The third column provides insights into the price behavior of a symbol within the selected timeframe, as analyzed by the range feature of the TRN Bars algorithm.
ACTIVE – Price moves within a price range
UP – Breakout detected
DN – Breakdown detected
UP CONF – Breakout confirmed
DN CONF – Breakdown confirmed
The bar range feature automatically finds consolidations where the price range of several consecutives bars is rather small. The detection of the bar ranges includes among other things the overlapping percentage of these bars.
Divergence Detection for any given (Custom) Indicator
The divergence detector finds with unrivaled precision bullish and bearish as well as regular and hidden divergences. The main difference compared to other divergences indicators is that this indicator finds rigorously the extreme peaks of each swing, both in price and in the corresponding indicator. This precision is unmatched and therefore this is one of the best divergences detectors.
The build in divergence detector works with any given indicator, even custom ones. In addition, there are 11 built-in indicators. Most noticeable is the cumulative delta indicator, which works astonishingly well as a divergence indicator. Full list:
External Indicator (see next section for the setup)
Awesome Oscillator (AO)
Commodity Channel Index (CCI)
Cumulative Delta Volume (CDV)
Chaikin Money Flow (CMF)
Moving Average Convergence Divergence (MACD)
Money Flow Index (MFI)
Momentum
On Balance Volume (OBV)
Relative Strength Index (RSI)
Stochastic
Williams Percentage Range (W%R)
Another highlight of the divergence detection is that it works with every indicator, even custom ones. To do this, you must add the (custom) indicator to your chart. Afterwards, simply go to the “Divergence Detection” section in the indicator settings and choose "External Indicator". If the custom indicator has one reference value, then choose this value in the “External Indicator (High)” field. If there are high and low values (e.g. candles), then you also must set the “External Indicator Low” field.
The visualization of the divergence detection is represented in the fifth column (Div Bull) and the sixth and last column (Div Bear).
REG – Regular divergence detected
HID – Hidden divergence detected
Scanner Alerts
You can opt to receive alerts for the following scenarios:
Detected up and down swings
Detected bullish and bearish divergences
Detected bar trend changes
Confirmed Reversal Bars
Confirmed Continuation Bars
Confirmed ange breakouts
The alert function is activated for all symbols listed in the scanner and corresponds to the timeframe of the chart you are currently viewing. This ensures that you receive alerts specifically tailored to the symbols and timeframe you are interested in.
Risk Disclaimer
The content, tools, scripts, articles, and educational resources offered by TRN Trading are intended solely for informational and educational purposes. Remember, past performance does not ensure future outcomes.

Swing Suite (SMT/Divergences + Gann Swings)Hello Traders!
TRN Swing Suite (SMT/Divergences + Gann Swings) is an indicator which identifies, and highlights pivot points (swings) and prints a lot of information about the swings in the chart (e.g. length, duration, cumulative Delta, ...). Furthermore, it detects divergences in connection with any given indicator, even custom ones. In addition to this, you can choose the algorithm to compute the swings. The famous Gann-Swing algorithm and the extremely precise TRN Swing algorithm (called Standard) are available for selection, as well as two other variants. Compared to other swing or zig-zag indicators it works in real-time, does not need a look-a-head to find swings and is not repainting. Moreover, equal (double) highs and lows are detected and displayed. The TRN Swing Suite helps traders to visualize the pure price action and identify key turning points or trends. The indicator comes with the following features:
Precise real-time swing detection without repainting
Divergence detecting for any given (custom) indicator - with 11 different preset indicators
SMT (Smart Money Technique)/Divergence detecting in relation to other instruments
Swing Performance Statistics
Swing support and resistance levels
Swing trend for multiple swing sizes
Equal/double high and low detection
4 different swing computation styles
Displaying of swing labels, values and information
Customizable settings as well as look and feel
It's important to note that the TRN Swing Suite is a visual tool and does not provide specific buy or sell signals. It serves as a guide for traders to analyze market structure in depth and make well-informed trading decisions based on their trading strategy and additional technical analysis.
Divergence Detection for any given (Custom) Indicator
The divergence detector finds with unrivaled precision bullish and bearish as well as regular and hidden divergences. The main difference compared to other divergences indicators is that this indicator finds rigorously the extreme peaks of each swing, both in price and in the corresponding indicator. This precision is unmatched and therefore this is one of the best divergences detectors.
The build in divergence detector works with any given indicator, even custom ones. In addition, there are 11 built-in indicators. Most noticeable is the cumulative delta indicator, which works astonishingly well as a divergence indicator. Full list:
External Indicator (see next section for the setup)
Awesome Oscillator (AO)
Commodity Channel Index (CCI)
Cumulative Delta Volume (CDV)
Chaikin Money Flow (CMF)
Moving Average Convergence Divergence (MACD)
Money Flow Index (MFI)
Momentum
On Balance Volume (OBV)
Relative Strength Index (RSI)
Stochastic
Williams Percentage Range (W%R)
The divergences are colored with vivid lines and labels. Bullish divergences are distinguished with luminous blue lines, while bearish divergences are denoted by striking red lines. Upon detecting a divergence, the colored lines act as a visual indicator for traders, signaling an imminent possibility of a trend reversal. In response, traders can leverage this valuable insight to make informed decisions in their trading activities.
Choose Your Custom Divergence Indicator
Handpick your custom indicator, and the TRN Swing Suite will hunt for divergences on your preferred market and timeframe. Importantly, you must add the indicator to your chart. Afterwards, simply go to the “Divergence Detection” section in the TRN Swing Suite indicator settings and choose "External Indicator". If the custom indicator has one reference value, then choose this value in the “External Indicator (High)” field. If there are high and low values (e.g. candles), then you also must set the “External Indicator Low” field.
In the provided graphic, we've chosen the stochastic RSI as our example, and as you can see, the TRN Swing Suite instantly identifies and plots bullish and bearish divergences on your chart.
Smart Money Technique (SMT)/Divergence detecting in Relation to other Instruments
Smart Money Technique/Tool (SMT) means the divergence detection between two related instruments. The TRN Swing Suite finds divergence in relation to other instruments, e.g. NQ vs ES or BTCUSDT vs ETHUSDT. Just add another instrument to the chart. As representation style you can choose lines or candles/bars. Afterwards, simply go to the “Divergence Detection” section in the TRN Swing Suite indicator settings and choose "External Indicator". If the second instrument is represented as line, then choose this value in the “External Indicator (High)” field. If there are high and low values (e.g. candles/bars), then you also must set the “External Indicator Low” field.
The detection of SMTs can help traders to decide whether the trend continues, or a reversal is imminent. E.g. if the NQ makes a new higher high but the ES fails to do so and makes a new lower high, then the TRN Swing Suite shows a divergence. As a result, the probability is high that the trend will not continue, and the trader can make an informed decision about what to do next.
How to Set Parameters for Divergence Indicators
To begin, access the indicator settings and find the “Divergence Detection”. Look for the "Parameters" sections where you can fine-tune Parameters 1-3. The default settings are already optimized for the oscillators AO, RSI, CDV, W%R, MFI and Stochastic. For other divergence indicators, you might want to adjust the settings to your liking. The parameter order is the same as in the corresponding divergence indicator.
TRN Swing Suite Statistics
Unveil the untapped potential of advanced Swing Statistics! Gain invaluable insights into historical swings and turning points. Elevate your expertise by harnessing this treasure trove of data to supercharge signal reliability, while masterfully planning stop loss and take profit strategies with unrivaled accuracy. Within the TRN Swing Suite lie two powerful statistics, each offering distinct insights to empower your trading prowess.
Swing Statistic
The Swing Statistic comprises of two series, one for up swings (Up) and one for down swings (Down), with values given in points. The columns have the following meaning:
Up or down
# - total number of analyzed swings
Overall ∅ Length - average length of all swings in points
Overall ∅ Duration - average duration of swings in bars
∅ Length - average lengths for custom-defined swing counts
∅ Duration - average durations for custom-defined swing counts
The custom-defined swing count is used to determine the swing length/duration for the last x swings. Note, in the case of well-established assets like Microsoft or Nvidia, which have undergone one or more stock splits, the overall average in column three may deviate significantly from those in column five. That is why column 5 is useful.
Relation Statistic
The Relation Statistic highlights percentages representing the historical occurrence of specific high and low sequences. In the first column (in %), various types of highs and lows are listed as reference points.
For example, the first row corresponds to "HH followed by", where the second column (#) displays the total count of higher highs (HH) considered. The subsequent columns showcase the percentages of how often certain patterns follow the initial HH.
Fields marked in blue represent sequences that occurred in over 50% of cases. The darker the shade of blue in each field, the higher the percentage.
Use Swing Statistics to Validate Stop-Loss and Take-Profit Levels
No matter which signals you choose to trade, consulting Swing Statistics can significantly enhance the reliability of these signals.
For example, when looking for a long entry after a lower low (LL), you can examine the likelihood of a subsequent lower high (LH) or even a higher high (HH). Combining this valuable information with your predetermined Take Profit level allows you to better assess whether your target can be achieved successfully. Additionally, you can add the average up swing length to the lower low for an alternative Take Profit level. Similarly, you can verify the probability of the next low being a higher low (HL) or another lower low (LL) to determine the likelihood of your Stop Loss being triggered. Align the length of the last down swing with the average down swing length for an alternative Stop Loss.
Swing Support and Resistance Levels
Swing support and resistance levels are horizontal lines starting from a swing high or swing low and representing natural support and resistance levels. Price tends to respect this levels one way or another. In most cases, old swing highs and swing lows provide a lot of liquidity to the market. For example, for a swing high there are at least three different market players at work:
Traders put there stop loss above the swing high
Breakout traders go long above the swing high
Turtle soup (reverse) trader go short above the swing high
Swing Trend (Multiple Sizes)
The TRN Swing Suite can display either at the top or at the bottom the prevailing swing trends for the main trend seen in the chart and for two additional swing sizes. This is useful to see the swing trend for medium and bigger swings to get a clear picture of the market.
Getting an Edge with the TRN Swing Suite
The indicator clearly displays up trends, defined as a sequence of higher highs (HH) and higher lows (HL), with green labels and down trends, defined as a sequence of lower lows (LL) and lower highs (LH), with red labels. Equal highs/double tops (DT) and equal lows/ double bottoms (DB) are highlighted in gold.
In addition, the labels show a full stack of valuable information about the swings to maximize your accuracy.
Length
Length percentage in relation to the last swing length
Duration
Time
Volume
Cumulative Delta
In an uptrend the up swings should have higher volume und higher cumulative delta than the down swings. The duration and time for down swings in an uptrend should be shorter than for the up swings.
Use Cases for Swing Detection
Trend Identification
By connecting the swing highs and lows, traders can identify and analyze the prevailing trend in the market. An uptrend is characterized by higher swing highs and lows, while a downtrend is characterized by lower highs and lower lows. The indicator helps traders visually assess the strength and continuity of the trend.
Support And Resistance Levels
The swing highs and lows can act as support and resistance levels. Swing highs may act as resistance levels where selling pressure increases, while swing lows may act as support levels where buying pressure increases. Traders often pay attention to these levels as potential areas for trade entries, exits, or placing stop-loss orders.
Pattern Recognition
The swings identified by the indicator can help traders recognize chart patterns, such as equal high/lows, consolidations, wedges, triangles or more complex patterns like Gartley or Head and Shoulders. These patterns can provide insights into potential trend continuation or reversal.
Trade Entry and Exit
Traders may use TRN Swing to determine potential trade entry and exit points. For example, in an uptrend, traders may look for opportunities to enter long positions near swing lows or on pullbacks to support levels. Conversely, in a downtrend, traders may consider short positions near swing highs or on retracements to resistance levels.
Swing Styles
In addition to the standard swings, you have the flexibility to choose between various swing styles, including ticks, percent, or even the famous Gann swings.
Standard
Gann
Ticks
Percent
Conclusion
While signals from TRN Swings can be informative, it is important to recognize that their reliability may vary. Various external factors can impact market prices, and it is essential to consider your risk tolerance and investment goals when executing trades.
Risk Disclaimer
The content, tools, scripts, articles, and educational resources offered by TRN Trading are intended solely for informational and educational purposes. Remember, past performance does not ensure future outcomes.

Divergence Scaner 3D Dynamic_tHello MY friend
divergence scanner 3D dynamic
It is a dynamic 3D scanner for identifying positive and negative divergences in 10 indicators.
This indicator can identify the types of Regular_Hidden_Exaggerated divergences for bullish and bearish states in the following indicators.
(MACD_L, MACD_H, RSI, Stochastic, Volume, CCI, MFI, Momentum, OBV, ADX)
This indicator is able to identify the mentioned divergences in the desired price source and in the desired settings for each indicator.
This can be done in up to 3 scans with different sensitivities at the same time. Therefore, the chances of identifying different price points are increased.
Also, the price point for each scan is determined and drawn separately.
This is a dynamic indicator.
That is, the divergence is not misdiagnosed at any moment, and it expresses the presence or absence of divergence for each indicator, and at the first moment of divergence in each sweep, it informs the user of its existence. And if the divergence disappears at the first instant, the label text is corrected.
That is why we say it is dynamic.
This indicator can calculate and identify the divergence with the percentage of allowed deviation both in the price and in the indicator if the user needs.
This indicator has an alert function to inform about the formation of divergence in one scan with desired settings for all divergence modes and for all 10 indicators.
This indicator can label the last 5 divergences for positive and negative divergences and for all three scans. Also display the Fibonacci level for the last divergence.
According to your needs, you can activate only a number of scans that you want or activate only a number of indicators that you want.
The logic of calculation and identification of divergence in the indicator:
As you know, divergences are more valid if they occur between two consecutive peaks and valleys.
In this indicator, three scans are considered, and the user can identify tiny and small pivots according to his needs and strategy by entering different degrees of sensitivity for each scan.
The indicator identifies the desired divergences for 2 consecutive valleys and 2 consecutive peaks in each scan separately and displays them to the user.
Important note:
This indicator is not limited to identifying the indicator points only in line with the price points, that is, the price points and the indicator may not be in the same line.
The higher the sensitivity of your scan, the smaller waves will be detected, and the lower the selection number, the larger waves will be detected.
By enabling pints you can see detected pivots and also by enabling Fibonacci you can see the value of the Fibonacci number for the last detected divergence.
You can see the deviations with the allowed deviation rate if needed and You can also get midpoint error and midline error.(More details are given in the clip.)
This indicator can be customized according to your needs and will identify the divergences of your choice for active scans.
For better display in label printing, the indicator tries to print the output of all active scans in one label, provided that the label printing location is the same.
Note that divergence label printing is done only with the lowest and highest price.
However, drawing the divergence line and printing the point labels depends on the price source you select in each scan.
You can see the scan number written in front of the marker name on the printed label to identify which scan this divergence is for.
Also, before the name of the indicator, an abbreviation related to the type of divergence is also written so that you can understand the type of divergence. For example, H stands for HD divergence.
It is better to consider a color for each scan so that it remains easily in your mind and you can easily recognize the points of each scan.
It is better to adjust the detection sensitivity in scans so that small and large spots are detected simultaneously to increase the performance of the marker.
last word :
Due to the capability of three simultaneous scans as well as dynamics at any moment, we think that the error in detecting the divergence in this indicator is below 1% and also the error in finding the divergence is below 3%. Also, the chances of identifying different price points are increased.
This can be said. It is a very good implementation. You can experience it in back test and forward test.
I tried to show you the full explanation with details in the form of a few clips. You can refer to my YouTube channel for a better introduction of the indicator and to know how to set the settings correctly.
Be careful to experience better execution speed ,Run the indicator when the market is open.
thank you
