Fsystem Pivot 1453 ScreenerHello,
This script provides scanning for our pivot 1453 script and should be used together.
I will try to explain the content with pictures.
Merhaba,
bu scriptimiz ,pivot 1453 scriptimiz için tarama yapılmasını sağlar ve beraber kullanılmalıdır.
sizlere içeriği resimler ile anlatmaya çalışacam.
Status column :
this column indicates that you are
from the Bear or Bull area at the last bar,
bear-positive bear appeared in the field,
bull -negative indicates that the bull is out of the field.
----------------
Durum Kolonu :
Bu kolon son barda Ayı veya Boğa alanda oldugunu ifade eder,
bear-positive ayı alandan çıktıgını,
bull -negative boğa alandan çıktığını ifade eder.
how bar ago column :
Indicates how many bars ago
the bull or bear crossed the area.
---------------------------------------
how bar ago kolonu :
boğa veya ayı alana kaç bar önce geçtiğini belirtir.
Level 1 distance column:
your last price
It is the percentage distance from the first pivot line that occurs when the Bull or Bear enters the field.
It gives information about how much the price has gained according to the 1st pivot and adds the color expression according to the current area.
-------------------------------------------
Level 1 distance kolonu :
son fiyatın
Boğa veya Ayı alana girdiğinde olusan ilk pivot çizgisine yüzdelik olarak uzaklığıdır.
1.pivota göre fiyat nekadar değer kazanmış bilgisini verir ve şu andaki alana göre renk ifadesinide katar.
which level column :
It gives information about the level of the price and colors it according to the relevant level.
----------------------------------------
which level kolonu :
fiyatın hangi seviyede oldugunun bilgisini verir ve ilgili seviyesine göre renklendirir.
Bottom distance column:
It gives the percentage distance
of the last price from the Support line.
-------------------------------------------------
Bottom distance kolonu :
Son fiyatın Destek çizgisine
yüzdelik uzaklığı bilgisini verir.
top distance column:
It gives the distance of the last price
from the peak, that is, to the resistance
point, as a percentage.
-------------------------------
top distance kolonu :
son fiyatın tepe yani direnç noktasına
uzaklığını yüzdelik olarak verir.
level up jump column :
If the price has closed on the line upwards
at the last bar and has passed to the
other level region, it gives information
about this.
-------------------------------------------
Level up jump kolonu :
eğer fiyat son barda yukarı doğru ,
çizgi üzerinde kapanış yapmış ve
diğer seviye bolgesine geçmiş ise
bunun bilgisini verir.
ema 60 and ema 360 column:
Returns the value of ema.
If the price is lower than the
relevant ema, it is turned
to a green ground if it is above red.
-----------------------------------
ema 60 ve ema 360 kolonu :
ema nın değerini verir.
eğer fiyat ilgili ema dan aşağı
ise kırmızı üstü ise yeşil zemine çevirilir.
Level Supp--Resis column:
gives the value of the top
resistance and the value of
the bottom support.
---------------------------
Level Supp--Resis kolonu :
tepe direncin değerini ve
dip desteğin değerini verir.
From the settings option of the script, you can narrow the result area by converting currency,
choosing a period, selecting a share, scanning another stock set and filtering integrated into the columns.
---------------------------------------------------------------------------------------------------------------------------------
scriptin ayarlar seçeneğinden ,para birimi çevirme ,periyot seçme,hisse seçme ,başka hisse seti tarama ve kolonlara entegreli filtreleme yaparak sonuç alanını daraltabilirsiniz.
In den Scripts nach "BOS" suchen

ViVen - EXP - Signals with AlertsHi Friends,
Here the trading made easy with Signals...
The main purpose of this indicator is to identify the Support and Resistance levels well in advance to make ourselves ready for the Entries with confidence..
With this indicator we will be able to identify the Market Structure and Trend to initiate our trades.
Multi Timeframe Concepts are considered in some cases to capture the Golden Zones.
Details of the Indicator:
Method of Trading – Intraday, Positional or Swing – Indices, Stocks and Commodity Markets
Golden Zones : When two or more indicator levels are confluences at one price point which will act as Strong Support and Resistance in the Market. That is called Golden Zone.
CPR & Pivot (Daily / Weekly / Monthly) – Based on the previous Timeframe values, it will automatically calculates the Support and Resistance values for the upcoming Sessions.
BUY / SELL Levels (W-Refers the Weekly levels) – Possible Reversal in the market we can expect at this price level. Depends on the Time frame (Daily/Weekly)
Bull BO / Bear BO (W-Refers the Weekly levels) – Possible Breakout level, If breakout happens price will move to reach the Target 1 and 2 Points based on which side the price breaks ( BULLISH / BEARISH ). We can initiate our BUY/SELL Entries.
Target 1 & Target 2 – Once the Price breaks the Breakout (Bull BO / Bear BO) levels, it will try to reach the Target Points where we can book our profits.
Tomorrow Levels - This will help us to enable the next day trading session Support and Resistance Levels in advance to do pre-analysis to prepare for the Entry and Exits.
Colored Candles : Lime Green and Violet colored candles will indicate the Possible Trend Reversals.
Triangles : Orange and Violet triangles will indicate the Confirmation of Trend Reversal.
BUY / SELL Signal – Considering the momentum and the Trend change it will suggest the possible entry time.
Dashboard :
1. Weekly Trend : This will indicate how the current week trend is going to be – Trending / Sideways
2. Today – Current Session expectation in the Market ( Bullish / Bearish )
3. Sentiment – Indicates the Traders mind set (Positive/Negative Side)
4. Range - This will indicate how the current Day trend is going to be – Trending / Sideways
5. MB / MA Trend – This identifies the major trend (Is the Stock / script in Up Trend or Down Trend)
6. Other Parameters – Will indicates the present situation in the market
7. RSI Values – This is to know and understand the momentum of the particular script
Levels Name Explanations:
1. DPP – Daily Pivot Point
2. WPP – Weekly Pivot Point
3. WTC – Weekly Top Central Pivot
4. WBC – Weekly Bottom Central Pivot
5. PDH – Previous Day High
6. PDL – Previous Day Low
7. PWH – Previous Week High
8. PWL – Previous Week Low
9. PMH – Previous Month High
10. PML - Previous Month Low
11. WR1, WR2 – Weekly Resistance Levels 1 & 2
12. WS1, WS2 – Weekly Support 1 & 2
13. 5m 200 EMA – 5 Minutes 200 Period Exponential Moving Average
14. 15m 200 EMA – 15 Minutes 200 Period Exponential Moving Average
15. 1H 200 EMA – 1 Hour 200 Period Exponential Moving Average
16. 1H 200 SMA – 1 Hour 100 Period Simple Moving Average
17. 1D 200 EMA – Daily TF 100 Period Exponential Moving Average
Settings:
To turn ON and OFF any of these levels if it does not require, Go to Indicator Settings and disable the specific levels.
Alerts:
You can enable the Buy / Sell signal Alerts by creating new alert.
To Access the Indicator:
If you want to know more about the indicator & to access for your trading please check the link in the signature below.
If you have any doubts please mention it in the comment section.
Looking forward your valuable comments and feedbacks to improve further in accuracy of our Trading.
Thanks!!

Sonarlab - SMC Multi Timeframe add-onThe SMC HTF Indicator is an add-on for the original SMC Indicator . This add-on will show you multi timeframe Internal structure points, swing structure points and POI's. This will make it easier for you to do your multi timeframe analyses to speed up the process and save you chart work.
Main features:
- POI's
- Structure points (Swing and Internal)
- Trading panel (based on structure breaks)
Setting overview
Higher timeframe structure
Select timeframe {turn on/ off} / {amount to show}
Internal structure {turn on/ off} / {amount to show}
Swing structure {turn on/ off} / {amount to show}
POI {turn on/ off} / {amount to show}
OB Mitigation {wick/ close}
Alerts
Bullish/ bearish POI
Bullish/ bearish BOS
Bullish/ bearish CHoCH
Swing Bullish/ bearish BOS
Swing Bullish/ bearish CHoCH
Second higher timeframe structure
Select timeframe {turn on/ off} / {amount to show}
Internal structure {turn on/ off} / {amount to show}
Swing structure {turn on/ off} / {amount to show}
POI {turn on/ off} / {amount to show}
OB Mitigation {wick/ close}
Alerts
Bullish/ bearish POI
Bullish/ bearish BOS
Bullish/ bearish CHoCH
Swing Bullish/ bearish BOS
Swing Bullish/ bearish CHoCH
Trading panel
Styling options

Zendog V3 backtest DCA bot 3commasMAJOR UPDATE:
- Update to Pinescript v5
- MAJOR refactor for the logic of how orders are placed. BO order is placed when the condition is first encountered and we are not in a deal.
The extra SO orders (if based on price movement) are all placed on the next candle after BO order, instead of each being placed one after another.
Take profit (if percentage) and Stop loss are placed on the first candle after BO order because if BO and TP are on the same candle TV does not execute properly.
These changes should improve strategy accuracy when multiple prices are hit by the same candle.
- NEW FEATURE: Support to Stop deal using an external indicator (i.e. stop long deal when RSI > 80)
- NEW FEATURE: Support to trigger Safety orders using an external indicator (i.e. trigger each additional SO when RSI < 10, regardless of price movement)
The price movement logic may be implemented in the indicator that plots start / end signals. The SO size is calculated using the configuration of steps.
- NEW FEATURE: Safety order command for 3commas bot. This is implemented using Add funds in the quote currency (for pair BTCUSDT the quote currency is USDT)
The SO size is calculated using the configuration of steps, for exact order size (and price) use the built-in Steps table.
- NEW FEATURE: Addition of extra columns to the steps table: Required price for TP, Required % change for TP, Required % change for BEP (Breakeven point)
- Update to steps table to remove prices when Safety orders are not based on % price change
- The code is opensource. I will not be able to sustain merges for the script, but feel free to use and develop your own version and ping me on discord to review them
and maybe include in the original script

TopTenAlgo 2. HFT Algo for CryptoEN: High Frequency Trade Algo TVQ is an advanced algorithmic system developed using Volume Weighted / Exponential Moving Averages, vWap and Ichimoku . Said indicators are re-blended with the Volume Weighted Average ( vWap ) algorithm used by Merryl Lynch or Yapıkredi algorithms. It does not act like the classic Ichimoku or Moving Averages. TVQ was used instead of RSI . High Frequency Trade Algo's incorporate a 3-sided trading strategy that detects Risk Areas and allows you to stay Flat if necessary (red and white circles above the bars) or generates appropriate signals in the buy and sell regions, that measures the risk. In the triangle or flat / horizontal corrections you need to stay flat, it warns you beforehand that you are in the risky area, while the trend will occur, it warns you with a buy or sell signal.
This algorithm is prepared with @Top10Algo ... Optimization Risky and Wait Zone
TR: High Frequency Trade Algo TVQ, Hacim Ağırlıklı/Exponential Hareketli Ortalamalar, vWap ve Ichimoku kullanarak geliştirilen gelişmiş bir algoritmik sistemdir. Bahsi geçen göstergeler Merryl Lynch yada Yapıkredi algoritmalarının kullandığı Volume Weighted Average ( vWap ) algoritması ile yeniden harmanlanmıştır. Klasik Ichimoku yada Hareketli Ortalamalar gibi hareket etmez. RSI yerine TVQ kullanılmıştır. High Frequency Trade Algo’ lar Riskli Bölgeleri tespit edip gerekirse Flat kalmanızı sağlayan(barların üstündeki kırmızı ve beyaz daireler) yada alım ve satım bölgelerinde uygun sinyaller üreten yani riski ölçen 3 taraflı bir trading stratejisini içinde barındırır. Flat kalmanız gereken üçgen yada yassı/yatay düzeltmelerde sizi riskli bölgede olduğunuz konusunda önceden uyarırken, trend oluşacağı zamanda al yada sat sinyali ile önceden uyarır.
Bu algoritma @Top10Algo ile beraber hazırlanmıştır...Riskli ve Bekleme yapılan Flat bölgelerle ile ilgili iyileştirmeler yapıldı...
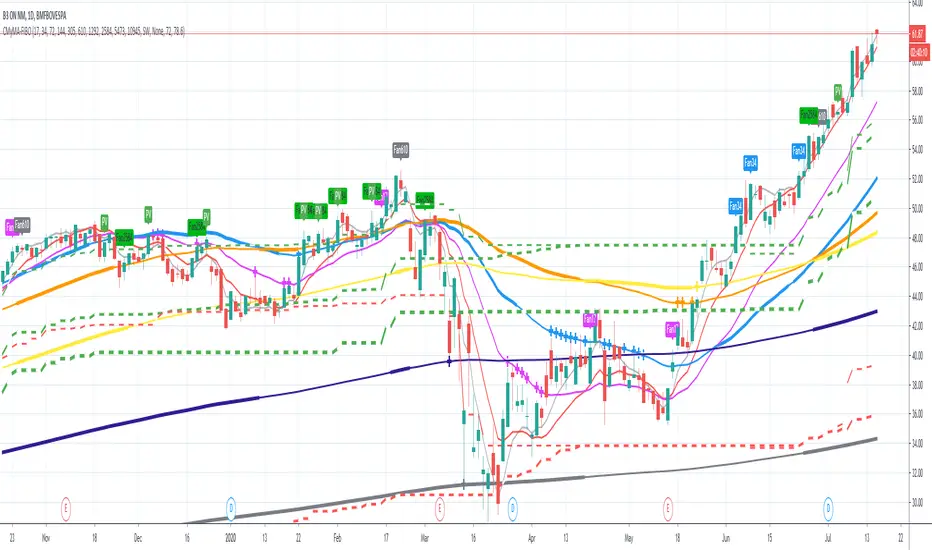
MyMA + FIBOThis script combines 6 Moving Averages (MAs) with 3 Donchian Channel 78.6% and 21.4% intermediary level lines to perform trade analysis. The 6 MAs (I, II, III , IV, V and VI ) default lengths come from one of the Fibonacci Phi^3 and Phi^3/2 sub series (17, 34, 72, 144, 305 and 610), but can be changed to any values, particularly to the traditionally used 20, 40, 50, 100, 200 and 300. Up to my knowledge, Fibonacci Phi^3 and Phi^3/2 sub series lengths were first proposed by Bo Williams.
The used Moving Averages can be chosen between EMA and MyMA. MyMA is a Moving Average that tries to mimic Bo William's MIMA. Due to the close resemblance between MyMA and MIMA, I do not feel comfortable to open this script source code. In order to learn how this script operates with EMAs, please refer to my Custom EMA + Fibo indicator that has its source code open.
The 3 Donchian Channels used have default lengths 72, 305 and 1292, calculated after the first length default value of 72. For each of the 3 Donchian Channels only an upper line, set by default at 78.6%, is plotted in green and its complement, set to 21.4%, is plotted in red. When the closing price is above 3 green lines, we say it is Forbidden to Sell ( PV ), and when the closing price is below 3 red lines, we say it is Forbidden to Buy ( PC ). Those conditions are flagged on the chart. These PV-PC conditions were, up to my knowledge, first proposed by Bo Williams.
This script also includes optional plot of the Giant MAs to help detecting old Resistance and Support lines when the price seems to be doing new historical highs and lows, respectively. These Giant lines have length greater than 1000.
This script also include the indication of the MA Fans. Those fans are formed when 6 Phi^3/2 distant MAs are ordered, for instance, we say there is EMA Fan 610 if close > EMA 17 > EMA 34 > EMA 72 > EMA 144 > EMA 305 > EMA 610. As far as I know, this concept of EMA Fan was first proposed by Bo Williams.
Impulsive Trend Detector [dtAlgo]This advanced Pine Script indicator identifies and tracks impulsive price movements based on Break of Structure (BOS) and Change of Character (CHoCH) concepts from Smart Money trading methodology.
The indicator automatically detects pivot highs and lows, then monitors when price breaks these key levels to signal potential impulsive moves. BOS indicates continuation in the current trend direction, while CHoCH signals potential trend reversals. Each detected move is measured from the break point to the next opposing pivot, providing accurate percentage calculations that match TradingView's measuring tool.
Impulsive moves are categorized into four levels based on magnitude (Level 1: 5-10%, Level 2: 10-15%, Level 3: 15-20%, Level 4: 20%+), with color-coded visual labels and connecting lines displayed directly on the chart.
Comprehensive Session Analysis:
Track moves across 11 distinct trading sessions in Eastern Time: Pre-London/NY, London/NY overlap, NY (with Power Hour and End subdivisions), Sydney, Asia, Sake Time, Asia/London overlap, London, Weekend, and No Session periods.
Three Dynamic Tables provide:
Real-time statistics (bullish/bearish, BOS/CHoCH, levels)
Session breakdown with move counts and average percentages
Event log showing last 10 moves with date, day, session, direction, type, level, percentage, duration, and bar count
Perfect for Smart Money traders seeking data-driven insights into market structure behavior across global trading sessions.

STM APEX Pro v2.0**STM APEX Pro v2.0 | Mobile-Optimized SMC & Volatility System**
**STM APEX Pro** is a comprehensive technical analysis tool designed for modern traders who require precision on both desktop and mobile devices. This script combines **Smart Money Concepts (SMC)**, **Trend Structure**, and **Volatility Modeling** to assist traders in identifying high-probability market contexts without chart clutter.
This indicator does not provide financial advice but offers objective technical levels based on statistical volatility (ATR) and market structure pivots.
---
### 🛠️ Key Features & Methodology
**1. Market Structure & Trend Bias**
The system automatically detects the underlying market flow using a dual-layer approach:
* **Structure Mapping:** Identifies Break of Structure (BOS) and Change of Character (CHoCH) based on adjustable pivot lookbacks to highlight potential reversals or trend continuations.
* **Market Bias:** Utilizes a dynamic EMA relationship (Fast 50 / Slow 200) to categorize the market state as BULLISH, BEARISH, or NEUTRAL.
**2. Supply & Demand Zones**
Algorithmically identifies significant buying and selling zones based on pivot strength. These zones are extended forward to serve as potential reaction areas for future price action.
**3. Setup Detection (Confluence Logic)**
The script highlights potential trade setups (marked with ●) when multiple technical factors align:
* Alignment of Market Structure (BOS/CHoCH).
* Agreement with the dominant Trend Bias (EMA Cloud).
* (Optional) Confirmation from Momentum (MACD) and proximity to Supply/Demand zones.
**4. Dynamic Reference Levels (4-Line System)**
Instead of static targets, the system projects dynamic volatility bands to assist with risk management:
* **Entry Level:** Based on the close or wick of the setup candle.
* **Invalidation Level (Line 2):** Calculated using an ATR multiplier (Average True Range) to determine where the structural setup becomes invalid. This adapts to current market volatility.
* **Projected Levels (P1, P2, P3):** These are expansion levels calculated derived from the Risk-to-Reward (R:R) ratio relative to the Invalidation distance. They serve as objective technical references for volatility expansion.
**5. Mobile-First Design**
Recognizing that many traders operate via mobile apps, this script features a "Clean UI" mode:
* Minimalist markers to prevent chart obstruction.
* Concise data tables showing only essential values (Entry, Invalidation, Risk Context).
* Option to toggle off text labels for a clutter-free experience.
---
### ⚙️ Settings Overview
* **Supply & Demand:** Toggle zones and adjust strength sensitivity.
* **Market Structure:** Customize lookback periods for BOS/CHoCH detection.
* **Reference Levels:**
* *Invalidation Distance (ATR):* Adjust how wide the structure validation room should be.
* *Projected Level R:R:* Define the multipliers for P1, P2, and P3 expansion levels.
* **Signal Sensitivity:** Choose between Low (more aggressive) or High (filtered) detection modes.
---
### ⚠️ Disclaimer
This script is for educational and technical analysis purposes only. The levels provided (Entry, Invalidation, Projected) are mathematical calculations based on past price action and volatility; they do not guarantee future performance. Trading carries significant risk. Always use proper risk management.

Mirpapa_Lib_StructsLibrary "Mirpapa_Lib_Structs"
ICT 구조 변화 감지 라이브러리 (BOS, CHoCH, MSS, Sweep)
initStructState()
StructState 초기화
checkBOS(_trend, _currentClose, _lastHHPrice, _lastLLPrice)
BOS 체크 (추세 지속) - 종가 기준
Parameters:
_trend (string) : 현재 추세
_currentClose (float) : 현재 종가
_lastHHPrice (float) : 마지막 HH 가격
_lastLLPrice (float) : 마지막 LL 가격
Returns:
checkCHoCH(_trend, _currentClose, _lastHHPrice, _lastLLPrice)
CHoCH 체크 (추세 전환) - 종가 기준
Parameters:
_trend (string) : 현재 추세
_currentClose (float) : 현재 종가
_lastHHPrice (float) : 마지막 HH 가격
_lastLLPrice (float) : 마지막 LL 가격
Returns:
checkSweep(_currentHigh, _currentLow, _currentClose, _lastHHPrice, _lastLLPrice)
Sweep 체크 (유동성 수집)
Parameters:
_currentHigh (float) : 현재 고가
_currentLow (float) : 현재 저가
_currentClose (float) : 현재 종가
_lastHHPrice (float) : 마지막 HH 가격
_lastLLPrice (float) : 마지막 LL 가격
Returns:
checkMSS(_hadCHoCH, _chochDir, _currentHigh, _currentLow, _chochPrice)
MSS 체크 (CHoCH + 리테스트 확인)
Parameters:
_hadCHoCH (bool) : CHoCH 발생 여부
_chochDir (string) : CHoCH 방향
_currentHigh (float) : 현재 고가
_currentLow (float) : 현재 저가
_chochPrice (float) : CHoCH 발생 가격
Returns:
drawStructLabel(_price, _time, _type, _dir, _lblColor)
구조 변화 라벨 그리기
Parameters:
_price (float) : 가격
_time (int) : 시간
_type (string) : 구조 타입
_dir (string) : 방향
_lblColor (color) : 라벨 색상
drawStructLine(_price, _startTime, _endTime, _lineColor, _lineWidth)
구조 변화 라인 그리기
Parameters:
_price (float) : 가격
_startTime (int) : 시작 시간
_endTime (int) : 끝 시간
_lineColor (color) : 라인 색상
_lineWidth (int) : 라인 두께
StructType
구조 타입 상수
Fields:
BOS (series string)
CHOCH (series string)
MSS (series string)
SWEEP (series string)
TrendDir
추세 방향 상수
Fields:
UP (series string)
DOWN (series string)
NONE (series string)
StructState
구조 변화 상태
Fields:
_trend (series string) : 현재 추세 방향
_lastHHPrice (series float) : 마지막 HH 가격
_lastHHTime (series int) : 마지막 HH 시간
_lastLLPrice (series float) : 마지막 LL 가격
_lastLLTime (series int) : 마지막 LL 시간

SMC N-Gram Probability Matrix [PhenLabs]📊 SMC N-Gram Probability Matrix
Version: PineScript™ v6
📌 Description
The SMC N-Gram Probability Matrix applies computational linguistics methodology to Smart Money Concepts trading. By treating SMC patterns as a discrete “alphabet” and analyzing their sequential relationships through N-gram modeling, this indicator calculates the statistical probability of which pattern will appear next based on historical transitions.
Traditional SMC analysis is reactive—traders identify patterns after they form and then anticipate the next move. This indicator inverts that approach by building a transition probability matrix from up to 5,000 bars of pattern history, enabling traders to see which SMC formations most frequently follow their current market sequence.
The indicator detects and classifies 11 distinct SMC patterns including Fair Value Gaps, Order Blocks, Liquidity Sweeps, Break of Structure, and Change of Character in both bullish and bearish variants, then tracks how these patterns transition from one to another over time.
🚀 Points of Innovation
First indicator to apply N-gram sequence modeling from computational linguistics to SMC pattern analysis
Dynamic transition matrix rebuilds every 50 bars for adaptive probability calculations
Supports bigram (2), trigram (3), and quadgram (4) sequence lengths for varying analysis depth
Priority-based pattern classification ensures higher-significance patterns (CHoCH, BOS) take precedence
Configurable minimum occurrence threshold filters out statistically insignificant predictions
Real-time probability visualization with graphical confidence bars
🔧 Core Components
Pattern Alphabet System: 11 discrete SMC patterns encoded as integers for efficient matrix indexing and transition tracking
Swing Point Detection: Uses ta.pivothigh/pivotlow with configurable sensitivity for non-repainting structure identification
Transition Count Matrix: Flattened array storing occurrence counts for all possible pattern sequence transitions
Context Encoder: Converts N-gram pattern sequences into unique integer IDs for matrix lookup
Probability Calculator: Transforms raw transition counts into percentage probabilities for each possible next pattern
🔥 Key Features
Multi-Pattern SMC Detection: Simultaneously identifies FVGs, Order Blocks, Liquidity Sweeps, BOS, and CHoCH formations
Adjustable N-Gram Length: Choose between 2-4 pattern sequences to balance specificity against sample size
Flexible Lookback Range: Analyze anywhere from 100 to 5,000 historical bars for matrix construction
Pattern Toggle Controls: Enable or disable individual SMC pattern types to customize analysis focus
Probability Threshold Filtering: Set minimum occurrence requirements to ensure prediction reliability
Alert Integration: Built-in alert conditions trigger when high-probability predictions emerge
🎨 Visualization
Probability Table: Displays current pattern, recent sequence, sample count, and top N predicted patterns with percentage probabilities
Graphical Probability Bars: Visual bar representation (█░) showing relative probability strength at a glance
Chart Pattern Markers: Color-coded labels placed directly on price bars identifying detected SMC formations
Pattern Short Codes: Compact notation (F+, F-, O+, O-, L↑, L↓, B+, B-, C+, C-) for quick pattern identification
Customizable Table Position: Place probability display in any corner of your chart
📖 Usage Guidelines
N-Gram Configuration
N-Gram Length: Default 2, Range 2-4. Lower values provide more samples but less specificity. Higher values capture complex sequences but require more historical data.
Matrix Lookback Bars: Default 500, Range 100-5000. More bars increase statistical significance but may include outdated market behavior.
Min Occurrences for Prediction: Default 2, Range 1-10. Higher values filter noise but may reduce prediction availability.
SMC Detection Settings
Swing Detection Length: Default 5, Range 2-20. Controls pivot sensitivity for structure analysis.
FVG Minimum Size: Default 0.1%, Range 0.01-2.0%. Filters insignificant gaps.
Order Block Lookback: Default 10, Range 3-30. Bars to search for OB formations.
Liquidity Sweep Threshold: Default 0.3%, Range 0.05-1.0%. Minimum wick extension beyond swing points.
Display Settings
Show Probability Table: Toggle the probability matrix display on/off.
Show Top N Probabilities: Default 5, Range 3-10. Number of predicted patterns to display.
Show SMC Markers: Toggle on-chart pattern labels.
✅ Best Use Cases
Anticipating continuation or reversal patterns after liquidity sweeps
Identifying high-probability BOS/CHoCH sequences for trend trading
Filtering FVG and Order Block signals based on historical follow-through rates
Building confluence by comparing predicted patterns with other technical analysis
Studying how SMC patterns typically sequence on specific instruments or timeframes
⚠️ Limitations
Predictions are based solely on historical pattern frequency and do not account for fundamental factors
Low sample counts produce unreliable probabilities—always check the Samples display
Market regime changes can invalidate historical transition patterns
The indicator requires sufficient historical data to build meaningful probability matrices
Pattern detection uses standardized parameters that may not capture all institutional activity
💡 What Makes This Unique
Linguistic Modeling Applied to Markets: Treats SMC patterns like words in a language, analyzing how they “flow” together
Quantified Pattern Relationships: Transforms subjective SMC analysis into objective probability percentages
Adaptive Learning: Matrix rebuilds periodically to incorporate recent pattern behavior
Comprehensive SMC Coverage: Tracks all major Smart Money Concepts in a unified probability framework
🔬 How It Works
1. Pattern Detection Phase
Each bar is analyzed for SMC formations using configurable detection parameters
A priority hierarchy assigns the most significant pattern when multiple detections occur
2. Sequence Encoding Phase
Detected patterns are stored in a rolling history buffer of recent classifications
The current N-gram context is encoded into a unique integer identifier
3. Matrix Construction Phase
Historical pattern sequences are iterated to count transition occurrences
Each context-to-next-pattern transition increments the appropriate matrix cell
4. Probability Calculation Phase
Current context ID retrieves corresponding transition counts from the matrix
Raw counts are converted to percentages based on total context occurrences
5. Visualization Phase
Probabilities are sorted and the top N predictions are displayed in the table
Chart markers identify the current detected pattern for visual reference
💡 Note:
This indicator performs best when used as a confluence tool alongside traditional SMC analysis. The probability predictions highlight statistically common pattern sequences but should not be used as standalone trading signals. Always verify predictions against price action context, higher timeframe structure, and your overall trading plan. Monitor the sample count to ensure predictions are based on adequate historical data.

OXE MTF Support/Resistance+Demand/Supply Zone ArsenalOXE MTF Support/Resistance + Demand/Supply Zones Indicator
Your Complete Multi-Timeframe Zone Arsenal
This professional-grade indicator transforms your chart into a zone confluence powerhouse, simultaneously tracking high-probability price reaction areas across 5 timeframes (Daily, H4, H1, M15, M5) – giving you the institutional edge you need to dominate the markets.
🎯 What It Is
A sophisticated dual-system zone detector that identifies both:
Classic Support/Resistance levels using pivot point detection
Smart Money Demand/Supply zones triggered by Break-of-Structure (BOS) confirmations
Unlike basic S/R indicators, this tool employs institutional methodology – capturing order blocks and imbalance zones where smart money is positioned, not just where price bounced.
⚡ Core Capabilities
Multi-Timeframe Mastery
Track up to 5 timeframes simultaneously without switching charts
Identify confluence zones where multiple timeframe levels align
Customize which timeframes to display for clean, focused analysis
Intelligent Zone Management
Automatic zone validation – tracks when zones flip from resistance→support or supply→demand
Invalid zone filtering – hide broken/invalidated zones to focus only on active opportunities
Configurable zone limits – control the number of zones per timeframe (up to 8 each)
Smart Money Detection
BOS-confirmed zones – only marks demand/supply after break-of-structure confirmation
Precise zone timing – captures the exact candle that created the imbalance
Visual differentiation – dashed borders distinguish demand/supply from traditional S/R
Professional Dashboard
Real-time zone counter – shows active zones per timeframe at a glance
Filter status indicators – tracks which validation filters are enabled
Color-coded timeframe labels – instant visual organization
💰 How This Transforms Your Trading
1. Find High-Probability Entries
Enter trades at zones where multiple timeframes converge – when H4 demand aligns with Daily support, you've found institutional backing.
2. Stay on the Right Side of the Market
The zone flipping system shows you when market structure changes – a supply zone that flips to demand tells you the narrative has shifted bullish.
3. Eliminate Guesswork
No more wondering "is this level still valid?" The automatic invalidation tracking removes subjectivity – zones are either active (tradeable) or broken (ignored).
4. Scale Your Timeframe Analysis
Whether you're scalping M5 or swing trading Daily, access all relevant zones without the mental overhead of switching between charts and manually tracking levels.
5. Trade Like Institutions
By combining pivot-based S/R with BOS-confirmed order blocks, you're seeing where retail AND institutional money is positioned – giving you the complete picture.
🔥 Perfect For
Day traders seeking M15/H1 confluence for precise entries
Scalpers needing M5 zones with higher-timeframe confirmation
Swing traders looking for Daily/H4 zone alignment for position trades
ICT/SMC practitioners combining order blocks with traditional analysis
Any trader who values clean, validated, multi-timeframe zones over cluttered charts

SMC + OB + FVG + Reversal + UT Bot + Hull Suite – by Fatich.id🎯 7 INTEGRATED SYSTEMS:
✓ Mxwll Suite (SMC + Auto Fibs + CHoCH/BOS)
✓ UT Bot (Trend Signals + Label Management)
✓ Hull Suite (Momentum Analysis)
✓ LuxAlgo FVG (Fair Value Gaps)
✓ LuxAlgo Order Blocks (Volume Pivots) ⭐ NEW
✓ Three Bar Reversal (Pattern Recognition)
✓ Reversal Signals (Momentum Count Style)
⚡ KEY FEATURES:
• Smart Money Structure (CHoCH/BOS/I-CHoCH/I-BoS)
• Auto Fibonacci (10 customizable levels)
• Order Block Detection (Auto mitigation)
• Fair Value Gap Tracking
• Session Highlights (NY/London/Asia)
• Volume Activity Dashboard
• Multi-Timeframe Support
• Clean Label Management
🎨 PERFECT FOR:
• Smart Money Concept Traders
• Order Flow & Liquidity Analysis
• Support/Resistance Trading
• Trend Following & Reversals
• Multi-Timeframe Analysis
💡 RECOMMENDED SETTINGS:
Clean Charts: OB Count 3, UT Signals 3, FVG 5
Detailed Analysis: OB Count 5-10, All Signals
Scalping: Low sensitivity, Hull 20-30
Swing Trading: High sensitivity, Hull 55-100

LiquidTradeRoom Auto Zones1. Finds Swing Highs and Swing Lows
It looks for pivot highs and lows using a user-chosen length.
Swing highs = possible supply
Swing lows = possible demand
These swings help the indicator understand the market structure.
2. Automatically Creates Supply & Demand Zones
When a new swing high or low is found:
🔴 Supply zone (after a swing high)
Draws a box above price
Slight buffer added using ATR
Extends the box forward to the right
🔵 Demand zone (after a swing low)
Draws a box below price
ATR buffer
Extends the box to the right
The boxes act as “areas price may react from.”
3. Stops Overlapping Zones
Before creating a new zone, the script checks:
If the new zone is too close to an existing one → it does not draw it.
This avoids clutter & duplicate zones.
4. Draws POI Labels
Within each supply/demand box it draws a small “POI” label showing the midpoint.
This marks the "most important part" of the zone.
5. Marks BOS (Break of Structure) Automatically
If price breaks above a supply zone top or below a demand zone bottom, the indicator:
Converts that zone into a BOS marker
Draws a line showing where structure was broken
Removes the old supply/demand box
This helps identify trend changes.
6. Extends Active Zones
Existing zones are constantly pushed further right so they stay visible on the chart.
7. Optional Zig-Zag
The script can draw a zig-zag line to help visualize:
Higher highs
Higher lows
Lower highs
Lower lows
But you can turn it on or off.
8. Optional Swing Labels
If enabled, it prints:
HH (Higher High)
HL (Higher Low)
LH (Lower High)
LL (Lower Low)
This visually shows market structure.
✨ In summary
This script automatically builds a full “Smart Money Concepts” structure map including:
✔ Swing points
✔ Supply & demand zones
✔ POIs
✔ Break of structure (BOS)
✔ Zig-zag structure
✔ Market structure labels (HH, HL, LH, LL)

Мой скриптinputs:
window(1),
type(0), // 0: close, 1: high low, 2: fractals up down, 3: new fractals
persistent(False),
exittype(1),
nbars(160),
adxthres(40),
nstop(3000);
vars:
currentSwingLow(0),
currentSwingHigh(0),
trailStructureValid(false),
downFractal(0),
upFractal(0),
breakStructureHigh(0),
breakStructureLow(0),
BoS_H(0),
BoS_L(0),
Regime(0),
Last_BoS_L(0),
Last_BoS_H(0),
PeakfilterX(false);
BoS(window,persistent,type,Bos_H,BoS_L,upFractal,downFractal,breakStructureHigh,breakStructureLow);
//BOS Regime
If BoS_H <> 0 then begin
Regime = 1; // Bullish
Last_BoS_H = BoS_H ;
end;
If BoS_L <> 0 Then begin
Regime = -1; // Bearish
Last_BoS_L = BoS_L ;
end;
//Entry Logic: if we are in BoS regime then wait for break swing to entry
if ADX(5) of data2 < adxthres then begin
if time>900 and Regime = 1 and EntriesToday(date)= 0 and Last_BoS_H upFractal then buy next bar at market;
end;
if time>900 and EntriesToday(date)= 0 and Regime = -1 and Last_BoS_L>downFractal then
begin
if close < downFractal then sellshort next bar at market;
end;
end;
// Exits: nbars or stoploss or at the end of the day
if marketposition <> 0 and barssinceentry >nbars then begin
sell next bar at market;
buytocover next bar at market;
end;
setstoploss(nstop);
setexitonclose;

Alt Trading: Tom's Reversal Strategy
The Alt Trading: Tom’s Reversal Strategy indicator is a multi-layered market-structure and regime-detection tool engineered specifically for intraday futures trading. It dynamically computes hourly directional bias using higher-timeframe OHLC data, enabling traders to visually interpret bullish or bearish regime transitions with precision. The system identifies structural turning points through pivot-based swing analysis and confirms Break-of-Structure (BOS) events with strict or non-strict validation logic. Once a valid BOS occurs inside a higher-timeframe continuation window, the indicator generates long or short signals that incorporate intelligent risk modeling, including pivot-derived stop placement and customizable fixed-risk calibration. Automated risk-to-reward boxes are drawn in real time, updating tick-by-tick until either the stop or target is hit, allowing for clear visualization of trade lifecycle and expectancy. A second-order trend-continuation filter highlights specific intra-hour windows—referred to as “blue windows”—giving traders refined timing insights for potential reversals. With optional background bias shading, customizable TP/SL lines, and fully stylized BOS labels, the interface provides a clean, highly interpretable execution framework. Designed with scalpers and algorithmic traders in mind, the indicator blends structure, regime context, and real-time visualization to produce high-probability reversal setups during the most liquid hours of the trading session.

Smart Money Toolkit - PD Engine Bias Map [KedArc Quant]Description
Smart Money is an advanced multi-layer Smart Money Concepts framework that automatically detects structure shifts, premium-discount zones, and institutional order flow.
It is built around the PD Engine, which calculates the midpoint of the most recent market swing and dynamically determines BUY or SELL bias based on where current price trades relative to that equilibrium. This toolkit visualizes structure, order blocks, and bias context in one clean map, giving traders an institutional-grade view without unnecessary signal clutter.
Why It Is Unique
- All CHoCH, BOS, Order Block, FVG, and PD logic are coded from scratch.
- Uses true equilibrium (50 percent PD midpoint) for dynamic bias.
- Optimized for stability and non-repainting behavior.
- Designed for clarity with minimal, performance-safe visuals.
Entry and Exit Logic (Discretionary Framework)
- This toolkit is not a signal generator. It provides market context that guides discretionary trading.
BUY Bias (Discount Zone)
- Price trades below PD Mid: the market is in discount.
- Wait for a bullish CHoCH or reaction from a demand OB or FVG before buying.
- Target 1 = PD Mid. Target 2 = next opposite OB or FVG.
SELL Bias (Premium Zone)
- Price trades above PD Mid: the market is in premium.
- Wait for a bearish CHoCH or reaction from a supply OB or FVG before shorting.
- Target 1 = PD Mid. Target 2 = next opposite OB or FVG.
Institutional concept sequence: Bias → Structure Shift → Confirmation → Execution.
Input Configuration
Swing Sensitivity - Determines how far back to identify HH and LL pivots.
OB / FVG Detection - Toggles visual Order Block or Fair Value Gap zones.
PD Engine - Shows PD midpoint line, zone shading, and bias table.
Multi-TF Bias Sync - Optionally reads a higher timeframe bias for confirmation.
Color Themes - Switch between light, dark, or institutional palettes.
Formula / Logic Summary
Concept Formula
PD Mid (Equilibrium) (Recent Swing High + Recent Swing Low) / 2
BUY Bias close < PD Mid
SELL Bias close > PD Mid
CHoCH / BOS Pivot-based structure reversal: HH→LL or LL→HH
Order Block Last bullish or bearish candle before displacement.
FVG Gap between prior candle high/low and next candle range.
These formulas follow the structure used in institutional Smart Money Concepts.
How It Helps Traders
- Shows institutional premium and discount zones visually.
- Defines clear directional bias before entry.
- Combines structure, order blocks, FVG, and equilibrium in one layout.
- Works on any timeframe or asset.
- Prevents emotional trades by giving objective bias context.
Glossary
PD Mid Midpoint between recent swing high and low (market fair value).
Premium Zone Price above PD Mid; sellers control.
Discount Zone Price below PD Mid; buyers control.
CHoCH Change of Character, first reversal signal.
BOS Break of Structure, trend continuation confirmation.
OB Order Block, last institutional candle before move.
FVG Fair Value Gap, price imbalance often revisited.
FAQ
Q: Is this a signal indicator?
A: No. It is a contextual framework that supports manual decision-making.
Q: Does it repaint?
A: No. All structure logic is confirmed on bar close.
Q: Does it work on all markets?
A: Yes. It is purely price-based and timeframe independent.
Q: When does bias change?
A: Only after a new confirmed swing high or low.
Q: Can it be backtested?
A: You can build strategies on top of this context using your own entry and exit rules.
Disclaimer
This script is provided for educational purposes only.
It is not financial advice.
Trading carries risk. Past performance does not guarantee future results.
Use proper risk management and test on demo accounts before applying to live markets.

The RayAlgo™ Pro Indicator 2.0RayAlgo™ Pro 2.0 is not just a signal generator; it is a comprehensive market structure engine designed to align retail traders with institutional footprints. By combining Smart Money Concepts (SMC) with advanced volatility calculations, this toolkit filters out noise to reveal the true narrative of the chart.
Core Features
Advanced Market Structure (BOS & CHoCH) : Automatically detects Break of Structure (BOS) for trend continuation and Change of Character (CHoCH) for potential reversals. Choose between Candle Close or Wick validation to suit your style.
Smart Order Blocks with Volume : Unlike standard order block indicators, RayAlgo™ validates zones using volume data. Blocks are clearly labeled with total volume, helping you distinguish between weak pivots and true institutional interest.
Institutional Dashboard: A non-intrusive, sleek panel located in the bottom right. It provides an instant "Health Check" of the market, monitoring multi-timeframe trends (MTF), trend age, volatility score, and ADX strength.
Neon Trend Wireframe : A proprietary volatility ribbon that visualizes the "breathing" of the market. It expands during high volatility and contracts during squeezes, keeping you on the right side of the momentum.
Automated TP/SL & S/R : Dynamic Support and Resistance zones that adapt to volatility, plus optional Take Profit and Stop Loss suggestions based on a fixed Risk/Reward ratio.
How to Trade with RayAlgo™ Pro 2.0
Identify the Bias: Use the Dashboard to confirm the higher timeframe trend.
Wait for Structure: Look for a confirmed CHoCH or BOS signal in the direction of the trend.
Confirm with Order Blocks: Look for price to retest a high-volume Order Block.
Execute: Use the built-in Signals for entry timing and the dynamic S/R zones for targets.
Every element is adjustable. You can toggle Order Blocks, adjust the Pivot Strength for S/R zones, or minimize the Dashboard to suit your screen real estate.

Smart Money Concepts [Riz]Smart Money Concepts is a comprehensive technical analysis tool for identifying institutional trading patterns and market structure. This indicator combines Smart Money Concepts (SMC), ICT methodology, and Wyckoff principles into one professional tool.
✨ KEY FEATURES
📊 VOLUMETRIC ORDER BLOCKS
• Visual representation of supply/demand zones with volume distribution
• Horizontal volume bars showing buy/sell composition inside each Order Block
• Automatic mitigation tracking
• Breaker Block detection (invalidated OBs acting as reversal zones)
• Strength rating system: ★ Weak, ★★ Medium, ★★★ Strong
• ATR-based size filtering to show only significant zones
📈 MARKET STRUCTURE DETECTION
• Break of Structure (BOS) and Change of Character (CHoCH) identification
• Higher Highs (HH), Higher Lows (HL), Lower Highs (LH), Lower Lows (LL) labels
• Internal structure pivots (iH/iL) for intraday analysis
• Auto-adjusting swing length based on timeframe
• Configurable confirmation methods (Close vs Wick-based)
💎 FAIR VALUE GAPS (FVG)
• Automatic detection of bullish and bearish imbalances
• Configurable mitigation percentage (default 50%)
• Visual tracking until gaps are filled
• Separate color schemes for clarity
💧 LIQUIDITY ANALYSIS
• Buy Side Liquidity (BSL) identification at swing highs
• Sell Side Liquidity (SSL) identification at swing lows
• Automatic sweep detection with visual confirmation
• Real-time alerts when liquidity is taken
⚖️ PREMIUM & DISCOUNT ZONES
• Dynamic range calculation based on configurable lookback period
• Equilibrium (EQ) level identification
• Previous Day High (PDH) and Previous Day Low (PDL) levels
• Helps identify favorable entry zones
📊 REAL-TIME DASHBOARD
• Live statistics on all detected patterns
• Active Order Blocks and FVGs count
• BOS/CHoCH occurrence tracking
• Liquidity sweep counters
• Recent market activity indicators
• Current trend bias display
• Fully customizable position and size
⚙️ CUSTOMIZATION OPTIONS
All aspects are fully customizable:
• Swing Length (1-50 bars) with auto-adjust for timeframe
• Max Active Order Blocks (10-100)
• Volume bar position (Left/Right) with mirror option
• Volume bar width percentage (10-50%)
• ATR size filter for Order Blocks
• Strength rating method (Touches/Age/Distance/Volume/Combined)
• All colors and transparency levels
• Dashboard position (9 locations available)
• Comprehensive alert system for all events
🎓 HOW IT WORKS
ORDER BLOCKS: Identified at the last candle before a Break of Structure. These represent institutional supply and demand zones. Volume is estimated based on candle characteristics and displayed as horizontal bars.
MARKET STRUCTURE: Tracks pivot highs and lows to determine if price is making Higher Highs/Higher Lows (bullish structure) or Lower Highs/Lower Lows (bearish structure). BOS indicates trend continuation, while CHoCH signals potential trend reversal.
LIQUIDITY: Swing highs represent Buy Side Liquidity where short positions have their stop losses. Swing lows represent Sell Side Liquidity where long positions have stop losses. The indicator tracks when these levels are "swept" by price.
FAIR VALUE GAPS: Three-candle patterns where the current candle's range doesn't overlap with the candle two bars ago, creating price imbalances that often get filled later.
📚 BEST PRACTICES
• Use on all timeframes - Auto-adjust feature optimizes settings automatically
• Look for confluence - Best setups occur when multiple concepts align (e.g., Order Block + liquidity sweep + discount zone)
• Consider risk/reward - Use Premium/Discount zones to identify favorable entry areas
• Respect market context - Order Blocks in the direction of overall trend tend to be more reliable
• Volume matters - Higher volume percentages in the expected direction may indicate stronger zones
⚠️ IMPORTANT NOTES
EDUCATIONAL TOOL: This indicator is designed for analysis and education, not as trading signals or investment advice.
VOLUME ESTIMATION: Buy/sell volume distribution is estimated based on candle characteristics since true buy/sell volume data is not available in Pine Script.
NO GUARANTEES: Past performance is not indicative of future results. All trading involves substantial risk.
RISK MANAGEMENT: Always use proper risk management and seek additional confirmation before making trading decisions.
OBJECT LIMITS: On very fast timeframes (1m, 5m) in highly volatile markets, the indicator may approach Pine Script's 500-object limit. Reduce max OBs/FVGs in settings if needed.
🔧 TECHNICAL SPECIFICATIONS
• Pine Script Version: v6
• Indicator Type: Overlay (displays on price chart)
• Maximum Objects: Optimized to stay within Pine Script limits
• Performance: Efficient rendering with configurable history management
• Updates: Real-time on every bar close
📖 METHODOLOGY
This indicator combines concepts from:
• Inner Circle Trader (ICT) methodology
• Smart Money Concepts (SMC) framework
• Wyckoff market analysis principles
• Order flow and volume spread analysis
⚖️ DISCLAIMER
This indicator is for educational and informational purposes only. It is not financial advice. Trading financial instruments carries substantial risk and may not be suitable for all investors. Past performance is not indicative of future results. Always conduct your own research and consult with a licensed financial advisor before making any investment decisions. The author assumes no responsibility for any losses incurred from using this indicator.

Demand & Supply Zones With Volume Candle🧬 Demand & Supply Zones With Volume Color Candles — Multi-Timeframe S/R & Liquidity Zones.
🔥Automatic detects and plots dynamic Support & Resistance zones, liquidity areas, and Break-of-Structure (BoS) levels across multiple timeframes.
🔥 Key Factors
Body-Based Swings: Identifies swing highs/lows using Close or Open for precise S/R detection.
Auto Supply & Demand Zones: Creates ATR-sized S/R boxes that extend forward with touch-count tracking.
BoS Detection: Converts broken zones into dotted BoS lines for instant structure shift visibility.
Multi-TF Mapping (TF1–TF9): Plots higher-timeframe S/R levels directly on your chart for confluence.
Clean Overlap Filtering: Removes zones that are too close using ATR-based spacing logic.
Custom Swing Length: Controls sensitivity of pivots for strong or frequent zone formation.
Lookback Management: Stores only the most relevant recent S/R zones to avoid clutter.
Color-Coded Structure: Red = Supply, Blue = Demand, with labels showing touch count + timeframe.
Non-Repainting: Zones are drawn only after confirmed pivots for accurate, reliable structure.
📊 Volume Color Candle — Advanced Market Strength Visualization
Volume Color Candle is a powerful and visually enhanced tool designed to help traders instantly identify high-impact volume events, body-size anomalies, and market imbalances directly on any chart.
This indicator uses Z-Score statistical modeling to classify candles into Normal, Large, and Extreme categories — giving traders a deeper understanding of momentum, volatility, and unusual market activity.
🔍 Key Features
✅ Multi-Source Outlier Detection
Choose what drives the signal:
Volume
Body Size
Any (either becomes an outlier)
All (both must confirm)
This flexibility helps highlight genuine strength or weakness in price action.
🎨 Dynamic Candle Coloring
The script colors candles based on statistical threshold levels:
Normal Moves
Large Moves
Extreme Moves (High Impact)
You can display them as colored bars or full candles, depending on your charting preference.
📉 Low Volume Detection
Spot weak or imbalanced price moves with a dedicated low-volume algorithm:
Highlight candles with unusually low participation
Option to only show candles where volume is low but body is large (imbalance conditions)
Perfect for identifying fake breakouts or trapped liquidity zones.
⚙️How to use :-
default color schemes:
- Blue -> excheme bullish imbalance
- Green -> large bullish imbalance
- Black -> excheme bearish imbalance
- Red -> large bearish imbalance
- yellow -> low volume bars, indicates "balance", after which volatility usually increases and tends to continue the previous trend
🔔 Built-in Alerts
Receive instant alerts when the script detects:
Extreme Outlier Activity
Large Outlier Activity
Ideal for catching volatility spikes, early trend acceleration, or institutional-level moves.
🎯 What This Helps You Identify
Momentum surges
Volume-based breakouts
Manipulation or low-volume traps
Extreme candle events
Trend strength vs weakness
Liquidity pushes and imbalance signals
This makes it a highly valuable tool for scalpers, intraday traders, swing traders, and anyone relying on volume-price analysis.
Protected script
ForexArchitects
Disclaimer
The information and publications are not meant to be, and do not constitute, financial, investment, trading, or other types of advice or recommendations supplied or endorsed by TradingView. Read more in the Terms of Use.

darshakssc SMC Infinity Enginedarshakssc SMC Infinity Engine is an advanced Smart Money Concepts–based tool designed to help traders visually understand institutional price behavior such as liquidity sweeps, displacement moves, and structure breaks — all without repainting.
This script does not predict the future or guarantee outcomes.
Instead, it provides a structured price-action framework to help traders study how markets move during key intraday phases.
🔍 Core Concepts Used
This indicator highlights:
Liquidity Sweeps (equal highs/lows taken out)
Displacement Candles (strong institutional momentum bars)
Break of Structure (BOS) confirmations
Kill Zone Sessions (optional smart-money timing filter)
Higher Time Frame Trend Alignment
Dynamic Entry, Stop Loss, and Target Levels
Internal trade outcome tagging (TP1/TP2/TP3/SL)
These components are widely used in institutional price-action models and can help users understand how liquidity and structure interact throughout the trading day.
📊 What the Indicator Displays
LONG / SHORT signals after confirmed BOS
Entry, SL, TP1, TP2, TP3 mapped directly on the chart
Background highlighting for liquidity sweep zones
A clean dashboard showing:
Current symbol
Current price
Number of setups recognized
TP1/TP2/TP3 stats
SL count
Live win-rate calculation
Last outcome recorded
All visuals are provided for study purposes to help users review how price reacts during key structure shifts.
🧠 How to Use It (Educational Purpose)
This tool is designed as a market research & educational study aid.
You can use it to:
Observe how liquidity sweeps often precede directional moves
Study how displacement confirms institutional intent
Analyze BOS-based structure shifts
Compare HTF trend alignment with LTF execution
Review trade outcomes historically for self-improvement
It can assist in building discipline and consistency when learning SMC-style concepts — without any automation or strategy execution.
⚠️ Important Notes
This script does not repaint.
This is not a trading system, signal generator, or financial advice.
All information is for educational and informational purposes only.
Past performance does not guarantee future results.
Users should always perform their own analysis and risk management.
🛡️ Compliance Disclaimer
This script is provided for educational purposes only.
It does not constitute investment advice, does not guarantee results, and should not be used as the sole basis for any trading decision.

ATHENS Gold ICT + Smart Money [Advanced Signals]🎯 ADVANCED ICT + SMART MONEY CONFLUENCE INDICATOR
This indicator combines Inner Circle Trader (ICT) concepts with Smart Money theory to deliver high-probability trading signals based on institutional order flow and market structure.
━━━━━━━━━━━━━━━━━━━━━━━━━━━━━━━━━━━━━━━━
⚡ KEY FEATURES:
✅ ICT CONFLUENCE SYSTEM (0-4 Score)
• Order Blocks (Institutional Entry Zones)
• Fair Value Gaps (Price Imbalances)
• Liquidity Sweeps (Stop Hunt Detection)
• Market Structure (BOS & ChoCh)
✅ SMART SIGNALS
• Signals only trigger with minimum confluence
• Customizable requirements (OB/FVG/Liquidity)
• Filters out low-quality setups
• Higher win rate potential (65-85%)
✅ VISUAL COMPONENTS
• Order Blocks (OB+ / OB-)
• Fair Value Gaps (FVG↑ / FVG↓)
• Liquidity Zones (💧 markers)
• Break of Structure (BOS)
• Change of Character (ChoCh)
✅ PERSISTENT TP/SL LINES
• Entry, Stop Loss, TP1, TP2
• Automatically calculated from OB levels
• Lines extend across chart canvas
• Clear risk:reward visualization
✅ SMART DASHBOARD
• Real-time confluence score
• Component status (OB/FVG/Liquidity)
• Trend direction & RSI
• Signal strength indicator
━━━━━━━━━━━━━━━━━━━━━━━━━━━━━━━━━━━━━━━━
🎯 HOW IT WORKS:
The indicator scores each setup based on 4 key components:
1️⃣ ORDER BLOCK PRESENCE
• Bullish OB = Last bearish candle before strong move up
• Bearish OB = Last bullish candle before strong move down
• Price must be in OB zone
2️⃣ FAIR VALUE GAP (FVG)
• Gap between 3 candles indicating imbalance
• Price tends to fill these gaps
• Bounce from FVG = high probability entry
3️⃣ LIQUIDITY SWEEP
• Price sweeps recent high/low
• Retail stop losses triggered
• Smart money enters opposite direction
4️⃣ MARKET STRUCTURE
• Bullish = HH + HL
• Bearish = LH + LL
• Confirms trend direction
CONFLUENCE SCORE:
- 4/4 = Excellent (75-85% win rate)
- 3/4 = Good (65-75% win rate)
- 2/4 = Moderate (55-65% win rate)
- 1/4 = Weak (avoid)
━━━━━━━━━━━━━━━━━━━━━━━━━━━━━━━━━━━━━━━━
⚙️ CUSTOMIZABLE SETTINGS:
SIGNAL REQUIREMENTS:
- Require Order Block (ON/OFF)
- Require FVG (ON/OFF)
- Require Liquidity Sweep (ON/OFF)
- Minimum Confluence (1-4)
VISUAL SETTINGS:
- Show/Hide OB, FVG, BOS, ChoCh
- Adjustable lookback periods
- Customizable colors
- Line extension length
RISK MANAGEMENT:
- Risk:Reward ratio (1:1 to 5:1)
- Stop Loss buffer (%)
- Auto TP/SL calculation
- Clear old lines option
━━━━━━━━━━━━━━━━━━━━━━━━━━━━━━━━━━━━━━━━
📈 RECOMMENDED SETTINGS:
CONSERVATIVE (High Quality):
- Require OB: ON
- Require FVG: ON
- Min Confluence: 3/4
- Result: 1-2 signals/day, 70-80% win rate
BALANCED (Recommended):
- Require OB: ON
- Require FVG: OFF
- Min Confluence: 2/4
- Result: 2-4 signals/day, 60-70% win rate
AGGRESSIVE (More Signals):
- Require OB: OFF
- Require FVG: OFF
- Min Confluence: 2/4
- Result: 3-6 signals/day, 55-65% win rate
━━━━━━━━━━━━━━━━━━━━━━━━━━━━━━━━━━━━━━━━
🎯 BEST PRACTICES:
✅ Trade 3/4 or 4/4 confluence signals only
✅ Confirm with higher timeframe (H4/Daily)
✅ Trade during kill zones (London/NY open)
✅ Use proper position sizing (1-2% risk)
✅ Wait for all components to align
✅ Respect stop losses
✅ Take partial profits at TP1
❌ Don't trade 1/4 confluence signals
❌ Don't ignore liquidity sweeps
❌ Don't trade against higher TF trend
❌ Don't overtrade (quality > quantity)
━━━━━━━━━━━━━━━━━━━━━━━━━━━━━━━━━━━━━━━━
⚡ SIGNAL TYPES:
🟢 BUY SIGNAL (Green Triangle)
- Appears when bullish confluence met
- Label shows "BUY ICT"
- Blue entry line + Red SL + Green/Lime TPs
- Long opportunity
🔴 SELL SIGNAL (Red Triangle)
- Appears when bearish confluence met
- Label shows "SELL ICT"
- Blue entry line + Red SL + Green/Lime TPs
- Short opportunity
━━━━━━━━━━━━━━━━━━━━━━━━━━━━━━━━━━━━━━━━
📊 SUITABLE FOR:
- Gold (XAUUSD) - Optimized
- Forex pairs (Major pairs)
- Indices (US30, NAS100, SPX500)
- Crypto (BTC, ETH - adjust settings)
Recommended Timeframes:
- 15M - Primary for scalping
- 5M - Entry refinement
- 1H - Swing trading
- H4/Daily - Trend confirmation
━━━━━━━━━━━━━━━━━━━━━━━━━━━━━━━━━━━━━━━━
⚠️ DISCLAIMER:
This indicator is for educational purposes only. Past performance does not guarantee future results. Always:
- Practice on demo account first
- Use proper risk management
- Never risk more than you can afford to lose
- Seek professional financial advice
- Understand that trading carries risk
━━━━━━━━━━━━━━━━━━━━━━━━━━━━━━━━━━━━━━━━
🎓 BASED ON:
- ICT (Inner Circle Trader) Concepts
- Smart Money Theory
- Order Flow Analysis
- Institutional Trading Zones
- Market Structure Theory
━━━━━━━━━━━━━━━━━━━━━━━━━━━━━━━━━━━━━━━━
📢 FEATURES SUMMARY:
✅ Confluence-based signals (not random)
✅ Order Blocks + FVG + Liquidity integration
✅ Persistent TP/SL lines (scroll-friendly)
✅ Smart dashboard (real-time info)
✅ Customizable requirements
✅ High-probability setups
✅ Professional trading approach
✅ Works on multiple assets
✅ Clean visual presentation
✅ Beginner to advanced friendly
━━━━━━━━━━━━━━━━━━━━━━━━━━━━━━━━━━━━━━━━
Trade smart. Trade with confluence. 🎯
#ICT #SmartMoney #OrderBlocks #FVG #Gold #Forex #TradingStrategy #Confluence

SMC Clean: Structure + LiquidityThis indicator provides Smart Money Concepts (SMC) tools designed to help traders analyze market structure, liquidity pools, and institutional trading zones. It combines several popular SMC methods into one powerful, customizable tool, with a clean and controlled chart display.
Features and How it Works:
Swing Highs and Lows: The indicator identifies confirmed swing highs and swing lows using a lookback period (default: 15 bars). These points form the basis for market structure analysis.
Equal Highs/Equal Lows (EQH/EQL): When price action creates repeated swing highs or lows within a defined tolerance, the tool automatically marks these areas as potential liquidity pools. These are levels where multiple stop orders may accumulate, sometimes leading to significant market moves.
Liquidity Lines & Sweeps: Liquidity lines highlight unswept highs and lows, making it easy to see where price may hunt liquidity. When price crosses a swing high/low and closes back, a sweep label is shown (optional).
BOS/CHOCH Detection:
Break of Structure (BOS): Signals a continuation of the current trend if price closes beyond the previous swing point.
Change of Character (CHOCH): Highlights when price reverses and breaks a key swing from the opposite direction, hinting at a potential trend change or shift in market regime.
Only confirmed swing points are considered to avoid repainting.
Premium & Discount Zones Explained:
After a new confirmed swing high and swing low, the area between them forms a “range.”
The premium zone is the upper half (from midpoint to swing high): this is typically considered where price is “expensive” or overvalued for the current swing, and is often watched for potential sell setups.
The discount zone is the lower half (from swing low to midpoint): this is where price is “cheap” or undervalued for the current swing, commonly monitored for potential buy setups.
Colored boxes mark these zones on your chart for instant reference.
Dashboard (Movable Position):
A visually enhanced dark-themed dashboard shows the current market structure (Bullish/Bearish), liquidity bias (Buy-Side, Sell-Side, or Balanced, based on unswept levels), and last swept side (i.e., which liquidity pool was last taken by price).
Dashboard position can be set anywhere on your chart for best visibility.
Customization Options:
Enable/disable any feature individually for a cleaner chart.
Control colors, transparency, and swing sensitivity via user settings.
How to Use:
Add the indicator to your chart and adjust settings to fit your trading style.
Use swing lines and dashboard to determine current market structure and bias.
Watch equal highs/lows and liquidity lines for possible sweep events.
Use the premium/discount zones to locate optimal areas for trade entries—with institutional logic, buy when price reaches the discount (lower) zone, and look for sales in the premium (upper) zone.
Use BOS/CHOCH signals as objective confirmations of trend or regime changes. Always interpret signals in context of broader price action.
Important Notes:
This indicator is educational and analytical—NO signals are guaranteed.
All calculations are non-repainting and use only confirmed price data (no lookahead).
No claims of predicting future price movement or performance are made.
Disclaimer:
This tool is for technical analysis education only. It is not a financial advice nor a guaranteed trading system. Please test all signals and concepts before using in live markets.
