3 x EMA + Stochastic RSI + ATR8,20,40 EMAs + RSI crossover. Stop Loss at ATR x3. Profit Target at ATRx2
In den Scripts nach "泰国一寺庙被曝藏有40多具尸体" suchen

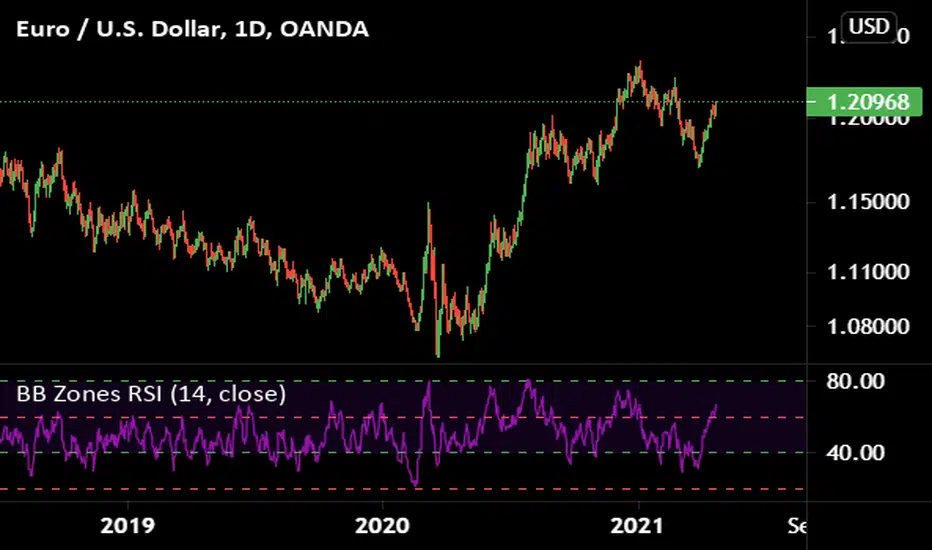
Detrended Rhythm Oscillator (DRO)How to detect the current "market beat" or market cycle?
A common way to capture the current dominant cycle length is to detrend the price and look for common rhythms in the detrended series. A common approach is to use a Detrended Price Oscillator (DPO). This is done in order to identify and isolate short-term cycles.
A basic DPO description can be found here:
www.tradingview.com
Improvements to the standard DPO
The main purpose of the standard DPO is to analyze historical data in order to observe cycle's in a market's movement. DPO can give the technical analyst a better sense of a cycle's typical high/low range as well as its duration. However, you need to manually try to "see" tops and bottoms on the detrended price and measure manually the distance from low-low or high-high in order to derive a possible cycle length.
Therefore, I added the following improvements:
1) Using a DPO to detrend the price
2) Indicate the turns of the detrended price with a ZigZag lines to better see the tops/bottoms
3) Detrend the ZigZag to remove price amplitude between turns to even better see the cyclic turns ("rhythm")
4) Measure the distance from last detrended zigzag pivot (high-high / low-low) and plot the distance in bars above/below the turn
Now, you can clearly see the rhythm of the dataset indicated by the Detrended Rhythm Oscillator including the exact length between the turns. This makes the procedure to "spot" turns and "measure" distance more simple for the trader.
How to use this information
The purpose is to check if there is a common rhythm or beat in the underlying dataset. To check that, look for recurring pattern in the numbers. E.g. if you often see the same measured distance, you can conclude that there is a major dominant cycle in this market. Also watch for harmonic relations between the numbers. So in the example above you see the highlighted cluster of detected length of around 40,80 and 120. There three numbers all have a harmonic relation to 40.
Once you have this cyclic information, you can use this number to optimize or tune technical indicators based on the current dominant cycle length. E.g. set the length parameter of a technical indicator to the detected harmonic length with the DRO indicator.
Example Use-Case
You can use this information to set the input for the following free public open-source script:
Disclaimer
This is not meant to be a technical indicator on its own and the derived cyclic length should not be used to forecast the next turn per se. The indicator should give you an indication of the current market beat or dominant beats which can be use to further optimize other oscillator or trading related settings.
Options & settings
The indicator allows to plot different versions. It allows to plot the original DPO, the DRO with ZigZag lines, the DRO with detrended ZigZag lines and length labels on/off. You can turn on or off these version in the indicator settings. So you can tweak it visually to your own needs.

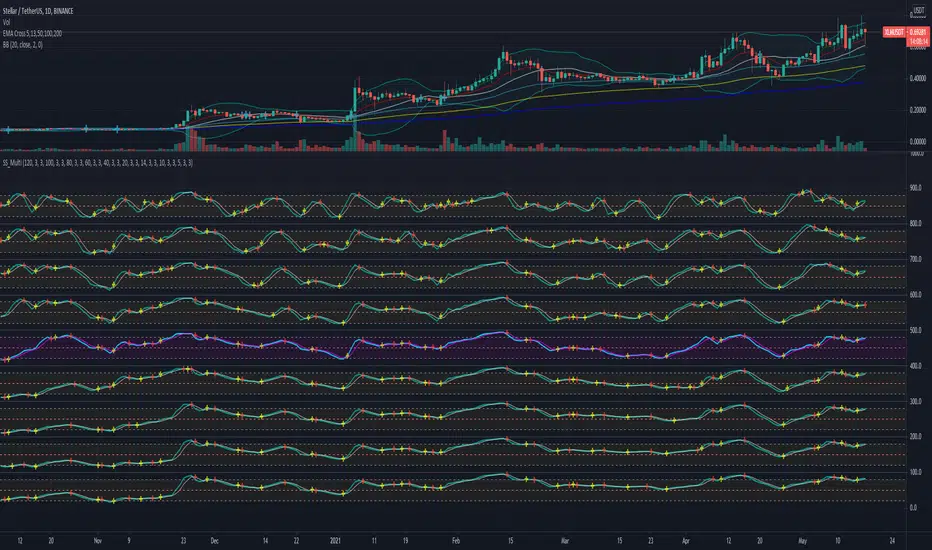
Technical Ratings on Multi-frames / Assets█ OVERVIEW
This indicator is a modified version of TECHNICAL RATING v1.0 available in the public library to provide a quick overview of consolidated technical ratings performed on 12 assets in 3 timeframes.The purpose of the indicator is to provide a quick overview of the current status of the custom 12 (24) assets and to help focus on the appropriate asset.
█ MODIFICATIONS
- Markers, visualizations and alerts have been deleted
- Due to the limitation on maximum number of security (40), the results of 12 assets evaluated in 3 different time frames can be shown at the same time.
- An additional 12 assets can be configured in the settings so that you do not have to choose each ticker one by one to facilitate a quick change, but can switch between the 12 -12 assets with a single click on "Second sets?".
- The position, colors and parameters of the table can be widely customized in the settings.
- The 12 assets can be arranged in rows 3, 4, 6 and 12 with Table Rows options, which can also be used to create a simple mobile view.
- The default gradient color setting has been changed to red/yellow/green traffic lights
ORIGINAL DESCRIPTION ABOUT TECHNICAL RATING v1.0
█ OVERVIEW
This indicator calculates TradingView's well-known "Strong Buy", "Buy", "Neutral", "Sell" or "Strong Sell" states using the aggregate biases of 26 different technical indicators.
█ WARNING
This version is similar, but not identical, to our recently published "Technical Ratings" built-in, which reproduces our "Technicals" ratings displayed as a gauge in the right panel of charts, or in the "Rating" indicator available in the TradingView Screener. This is a fork and refactoring of the code base used in the "Technical Ratings" built-in. Its calculations will not always match those of the built-in, but it provides options not available in the built-in. Up to you to decide which one you prefer to use.
█ FEATURES
Differences with the built-in version
• The built-in version produces values matching the states displayed in the "Technicals" ratings gauge; this one does not always.
• A strategy version is also available as a built-in; this script is an indicator—not a strategy.
• This indicator will show a slightly different vertical scale, as it does not use a fixed scale like the built-in.
• This version allows control over repainting of the signal when you do not use a higher timeframe. Higher timeframe (HTF) information from this version does not repaint.
• You can adjust the weight of the Oscillators and MAs components of the rating here.
• You can configure markers on signal breaches of configurable levels, or on advances declines of the signal.
The indicator's settings allow you to:
• Choose the timeframe you want calculations to be made on.
• When not using a HTF, you can select a repainting or non-repainting signal.
• When using both MAs and Oscillators groups to calculate the rating, you can vary the weight of each group in the calculation. The default is 50/50.
Because the MAs group uses longer periods for some of its components, its value is not as jumpy as the Oscillators value.
Increasing the weight of the MAs group will thus have a calming effect on the signal.
• Alerts can be created on the indicator using the conditions configured to control the display of markers.
Display
The calculated rating is displayed as columns, but you can change the style in the inputs. The color of the signal can be one of three colors: bull, bear, or neutral. You can choose from a few presets, or check one and edit its color. The color is determined from the rating's value. Between 0.1 and -0.1 it is in the neutral color. Above/below 0.1/-0.1 it will appear in the bull/bear color. The intensity of the bull/bear color is determined by cumulative advances/declines in the rating. It is capped to 5, so there are five intensities for each of the bull/bear colors.
The "Strong Buy", "Buy", "Neutral", "Sell" or "Strong Sell" state of the last calculated value is displayed to the right of the last bar for each of the three groups: All, MAs and Oscillators. The first value always reflects your selection in the "Rating uses" field and is the one used to display the signal. A "Strong Buy" or "Strong Sell" state appears when the signal is above/below the 0.5/-0.5 level. A "Buy" or "Sell" state appears when the signal is above/below the 0.1/-0.1 level. The "Neutral" state appears when the signal is between 0.1 and -0.1 inclusively.
Five levels are always displayed: 0.5 and 0.1 in the bull color, zero in the neutral color, and -0.1 and - 0.5 in the bull color.
█ CALCULATIONS
The indicator calculates the aggregate value of two groups of indicators: moving averages and oscillators.
The "MAs" group is comprised of 15 different components:
• Six Simple Moving Averages of periods 10, 20, 30, 50, 100 and 200
• Six Exponential Moving Averages of the same periods
• A Hull Moving Average of period 9
• A Volume-weighed Moving Average of period 20
• Ichimoku
The "Oscillators" group includes 11 components:
• RSI
• Stochastic
• CCI
• ADX
• Awesome Oscillator
• Momentum
• MACD
• Stochastic RSI
• Wiliams %R
• Bull Bear Power
• Ultimate Oscillator

Coin Prediction Filter - Free Cryptohopper WidgetWelcome to our Tradingview coin prediction filter.
We designed this script to give Cryptohopper users a possibility to decide which coins they want to trade. Because a basic rule says that you should never go against the trend. You can take the code and adjust it to your prefered trading pairs.
Smartgrow-Trading is a community project with the aim of developing the best and most successful trading strategies and sharing them with the community.
The basic idea of this script is to use a higher timeframe trend indicator and apply it on the top 40 coins. We recommend to use it within the 2h candles, but of cause you can use it in other timeframes as well. As result you receive a list of coins for the use within cryptohopper. Because, never trade against the trend.
If there are questions, write them into the comments or contact us directly over the direct message or social media. Happy Trading!

BAM's Weighted ROCTraders,
BAM's Weighted ROC is a Momentum indicator. ROC stands for 'Rate of Change' therefor this indicator plots the reading of a weighted average Rate of Change. In its current form it uses 4 periods en 4 weightings. The periods are set to 21/63/126/252 which corresponds to the number of trading days in each 1/3/6/12 months. The weightings are set to emphasize the more recent periods where the 1-month period counts for 40% of the signal, the 3-monthh period for 30%, the 6-month for 20% and the 12-month for 10%. These settings, both periods and weightings, are customizable. The current settings are meant to serve the widely used 1-day time interval chart setting. Feel free to alter the time frame and adjust the parameters accordingly; eg I like trading the weekly chart on a 10/20/30/40 period settings.
BAM's Weighted ROC can be used as a trendfilter for Trend Following trading systems or as an entry signal for Swing trading systems, or both. In the current setting the indicator is set to trend-following; it turns green when positive (above 0), indicating positive momentum. And red when negative (below 0), indicating negative momentum. In the most basic form one can trade a well diversified portfolio of assets using the indicator as guidance for entry and exit signals as it flows back and forth between positive and negative. Another use for the indicator lies in Swing Trading systems. In this approach the transfer from declining momentum into ascending momentum can be interpreted as a shift in momentum from negative to positive, and therefor constitute an entry opportunity. A combination of the 2 signals is of perfectly viable too, wait for positive momentum (reading above 0) in combination with a upward shift from one bar to the other. Use the reverse logic as an exit signal. In these examples the indicator is used in a stand-alone fashion. But off course it can also be used in conjunction with other indicators.
I personally use the two functions, trend-following en swingtrading, in tandem (combined)
for further reading into the rational behind Trend Following trading systems I recommend the following sources:
- Free Read: Google for 'Meb Faber, Global Asset Allocation' he gives out free copies on his website. Meb is a well known character in the Momentum-factor arena.
- Easy read: 'Following the trend' By Andreas Clenow. I don't think there is any Trend Following trader that doesn't know this chaps work.
- sophisticated Read: Trend Following with Managed Futures by A. Greyserman and K. Kaminski. This one is for those who seriously mean business!
Good luck out there, pls consider that the momentum factor holds an edge, at least based on historical performance, but this out-performance (most often) lies in the low single digits.
Pls be aware that use of this indicator is at your own risk. All info provided is solely presented for educational purposes.
Kind regards,
Bam

Solar VPRThis indicator shows the deviation from a volume influenced moving average. When the lines go above 1 or below 0 it is likely that there will be a reversal soon. You can mess with the fast and slow moving average lengths to see which ones are the best. I recommend 40 or 20 for the EVMA length.

Trader Pressure Index (TPX)This is my take on the script by RedK
I kept the algorithm exactly the same, but changed the layout and the default look back period. Most important is that the resulting line, the TPX, is now a histogram with green and red staves.
To put the histogram on a logical place in the graph, I changed the way the control/dominance level is implemented, it now lowers or highers the whole graph, this way the zero level becomes the ‘no interest’ level.
I added two horizontal lines at a distance of 40 because I feel that this is sort of an oversold / overbought indication. In practice not very convincing, but provides a visual comparison.
In this layout I explain that grass is growing on bull hills peaking up behind the foreground and blood is dripping from the bear hills.
Enjoy.

Slow Stochastic MultiFrame - AFPThis script enables you to use 9 slow stochastic with timeframe 5, 10, 14, 20, 40, 60, 80, 100, 120; on purposes to see from longterm and short term condition of a stock.
VPF ScreenerThis script is inspired by @midtownsk8rguy and created at my request with the pine mastery of @DonovanWall. All the credits go to them.
Basically, this script will screen for the long-only condition of the Voss Predictive Filter in maximum 40 securities at your choice.
I personally find the signals quite reliable for scalping indices and swing trading momentum stocks.
Hope you guys find it useful

MAX2 Ord. Volatility Market ScannerScan volatility of 40 pair, print result in label ordered form higher or lower volatility
Use it in combination with MAX1 Ord. Volatility Market Scanner for have 80 coin scan

MAX1 Ord. Volatility Market ScannerScan volatility of 40 pair, print result in label ordered form higher or lower volatility
Use it in combination with MAX2 Ord. Volatility Market Scanner for have 80 coin scan

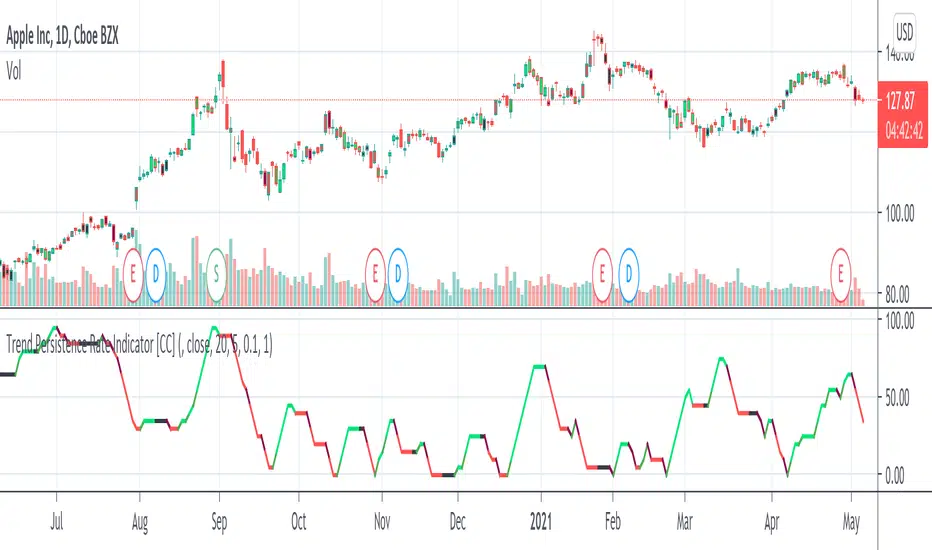
Trend Persistence Rate Indicator [CC]The Trend Persistence Rate Indicator was created by Richard Poster (Stocks and Commodities Feb 2021 pg 12) and this indicator is a good trend strength indicator similar to ADX. A good strategy with this indicator according to the author is to combine this with a moving average crossover strategy and a volatility indicator. Buy when the price crosses over the moving average and when the volatility and this indicator are over a selected minimum. I think 30-40 as a minimum for this indicator works well. Exit that position when this indicator peaks and starts to go down and it should be very profitable for you. I have included general buy and sell signals with this indicator as well.
Let me know if there are any other indicators you would like to see me publish!
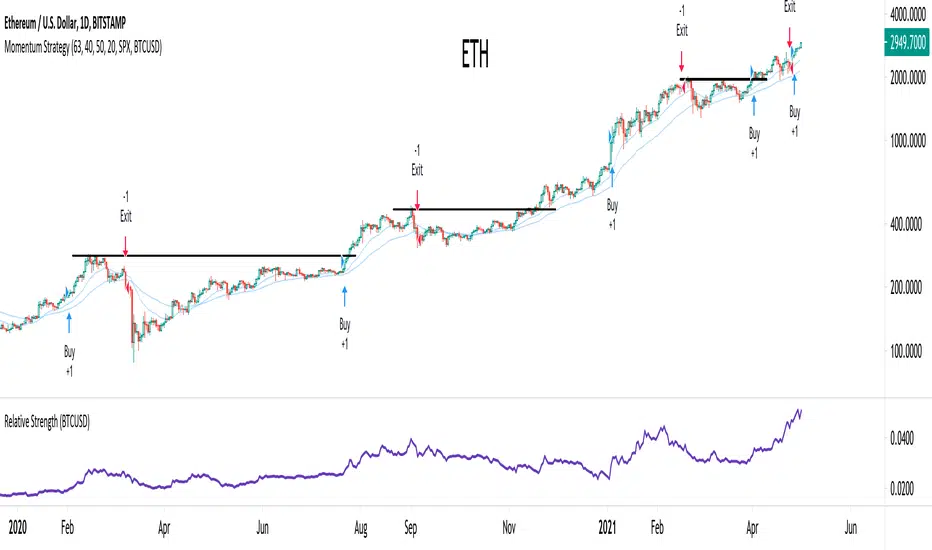
Momentum StrategyThis strategy uses momentum to determine when to enter and exit positions. The default settings are set to look for a new 63 day high (~1 trading quarter) and a new 40 day relative high. If the stock is trending above the 50 day moving average it is a candidate to be bought. Stops are triggered when price closes below the 20 day or 50 day EMAs depending on how well the stock is trending. A stop could also be triggered even if price continues to move up, but is breaking down on a relative basis to a benchmark either SPX or BTCUSD . The goal is to hold on to our winners for as long as possible and cut the losers as soon as possible. This will alow us to capture the majority of major trends while avoiding many large drawdown and relative losers.
RSI Candle Bar with Inside BarThis Indicator is RSI convert into Candle Bar with Inside Bar Candle
How to use :
Do Some setting
RSI Overbought - 60 It will shows in Blue Candle Bar means Bullish Signal
RSI Oversold - 40 It will shows in Yellow Candle Bar means Bearish Signal
Inside Bar Candle -
Gray or Black Bar --- Which is Shows that Trend may be Reverse or Big Move may be come.
Colors you can be change according to your convenience.

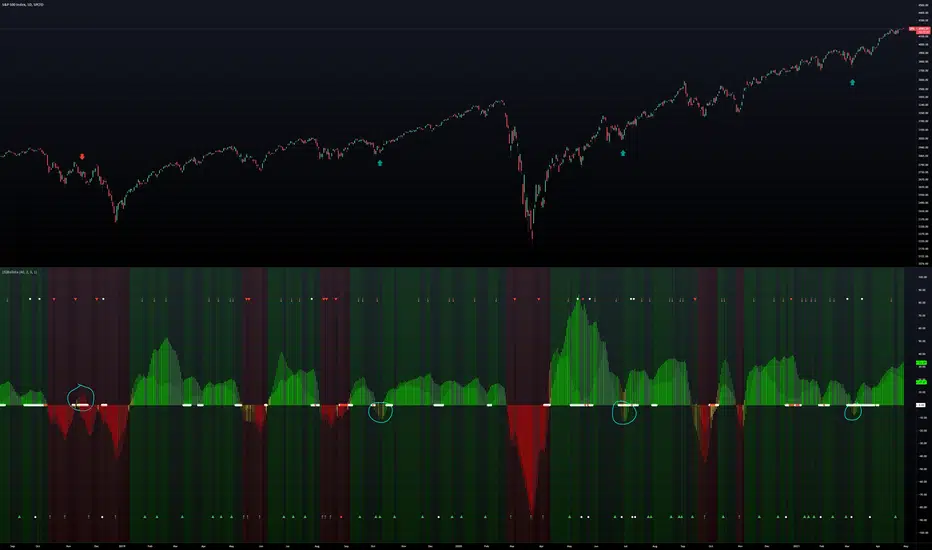
(JS) BallistaAlright so this is a script I made by combining two existing ones and making a really cool discovery that has proven very useful.
You'll notice that there are two separate oscillators that are laid on top of each other. The background oscillator is my "Tip-and-Dip" oscillator which you can see here (will refer to this as TnD from here), and the foreground oscillator from the Squeeze , which can be viewed here .
Initially I just wanted to see how they interacted with one another and compare them, but this led to some pretty interesting observations.
First let me go through the options real quick to get that out of the way, though it is mostly self-explanatory.
Lookback Period defines the amount of bars used for the TnD oscillator.
Smoothing Value smooths out the TnD output.
Standard Deviations is used to calculate the TnD formula.
Color Scheme is preset BG colors.
Using Dark Mode changes colors based on dark mode or not.
Squeeze Momentum On turns the Squeeze in the foreground off and on.
Arrows Off turns the arrows on the indicator off and on.
Now to explain the indicator a bit more. I have the default lookback period as 40 due to the Squeeze being 20, which makes the TnD oscillator the "slow" output with the Squeeze being the "fast" output.
Some initial observations were that when both the Squeeze and the TnD are moving in the direction, when the Squeeze is higher (uptrend) or lower (downtrend) it seems to indicate strength in the move. As the move loses steam you'll notice the Squeeze diverge from the TnD.
However, the most useful thing I discovered about the interaction between these two indicators is where the name for it came from. So if you aren't familiar with what a Ballista is, per Wikipedia, "The ballista... sometimes called bolt thrower, was an ancient missile weapon that launched either bolts or stones at a distant target." There are instances where the Squeeze seems to get ahead of itself and gets too far away from the TnD (which is the long term trend between the two). The key thing to look for is an "inverted squeeze" - this is when the squeeze oscillator ends up flipping against the TnD. When this occurs there is an extremely high probability that you'll see price shoot back the opposite way of the Squeeze.
I've been using this setup myself for about a year now and have been very satisfied with the results thusfar. I circled some examples on the SPX daily chart here to show you what I mean with the inverted Squeeze shooting back.
McClellan Oscillator for nifty 50This is a indicator which indicates breath of the market.
If found relevant do let me know!!
Only handpicked relevant 20 stocks (20 +ve indicator+ 20 -ve indicator) from different sector .
As there is the limit of 40 script allowed only.
Further modifications might be there if the limit is increased to 100 (50 +50 indicator) .

RSI Trend Indicator [paRSI]The Relative Strength Index ( RSI ) is a measurement used by traders to assess the price momentum. It is scaled from 0 to 100. when RSI reads below 30, it is usually interpreted as oversold and when RSI is above 70 it is usually interpreted as overbought. However, it is usually not profitable to trade based on overbought and oversold signal.
RSI Trend Indicator or as I like to call it "paRSI" ("Parsa (my name) + RSI") shows that when RSI is above a specific number (default value = 60) it indicates bullish trend and when RSI is below a specific number (default value = 40 ) it indicates bearish trend. Lastly when RSI is below the 2 specified numbers it indicates a neutral trend.
I don't recommend trading based on this single indicator. If you're a trend trader this might be useful tool in addition to your own strategy
Usage:
If the created pattern has worked previously on the chart, you could enter on the first stages of the green or red section (depending on the market's trend).
It is not recommended to trade in any direction when there is no color
*THIS IS A TREND FOLLOWING STRATEGY AND DOES NOT WORK ON ALL MARKETS*

Excitement - Crypto Surfer v1For those of us who need more excitement in our crypto journey besides just HODL, here’s a simple crypto robot that trades on the hourly (1H) candles. I call it the Crypto Surfer because it uses the 20 and 40 EMAs (Exponential Moving Averages) to decide when to enter and exit; price tends to “surf” above these EMAs when it is bullish, and “sink” below these EMAs when it is bearish. An additional 160 SMA (Simple Moving Average) with slope-angle detection, was added as a bull / bear filter to reduce the sting of drawdowns, by filtering-out long trades in a prolonged bear market.
USER NOTES:
- This script will buy $10,000 USD worth of crypto-currency per trade.
- It will only open one trade at a time.
- It has been backtested on all the high market cap coins such as Bitcoin, Ethereum, Binance Coin, Polkadot, Cardano.
- It should be run on the Hourly (H1) chart.
- In general, this moving average strategy *should be* profitable for 80% to 90% of the coins out there
- The 160 SMA filter with slope angle detection is designed to stop you from going long in a bear market.
- It is recommended you copy this script and modify it to suit your preferred coin during backtesting, before running live.
- Trading is inherently risky (exciting), and I shall not be liable for any losses you incur, even if these losses are due to sampling bias.

Trading View's Standard Color Palette, by @BlueJayBird- Simple color palette for Trading View.
- It works correctly on timeframes lower than 1h. Move it to the side so you can see the whole palette.
- All 17 standard TV colors are there, with fillers at 60 transparency (or 40 % opacity).
- You can custom the colors to your own colors, and use it as a palette color reference.
Additional information: kodify.net

Plot Level on Threshold ExceedThis script plots a line for X minutes, when the given reference source (which could be another indicator like volume, etc), exceeds the fixed value threshold.
There is a line limit in TV, so only the most recent 40 lines are plotted
Quantitative Qualitative Estimation QQE
The QQE indicator is a momentum based indicator to determine trend and sideways.
The Qualitative Quantitative Estimation (QQE) indicator works like a smoother version of the popular Relative Strength Index (RSI) indicator. QQE expands on RSI by adding two volatility based trailing stop lines. These trailing stop lines are composed of a fast and a slow moving Average True Range (ATR). These ATR lines are smoothed making this indicator less susceptible to short term volatility.
The most common method of using QQE is to look for crosses of the fast and slow moving trailing stop lines during periods when the QQE line reflects overbought or oversold conditions
Qualitative Quantitative Estimation made up of a smoothed Relative Strength Index (RSI) indicator plus fast and slow volatility-based trailing levels.
Qualitative Quantitative Estimation can be used in two directions:
1.Determine the trend, i.e. if the line is above the 50 level, the trend is ascending, if below - descending;
2.Search for signals at the moment of crossing of the QQE FAST (maroon) and QQE SLOW (blue) lines.
The QQE itself is generally considered to indicate an up-trend ifQQE FAST is above QQE SLOW, and a down-trend if below QQE SLOW.
Often a middle-range between 40 and 60 is set and if the indicator is in that range, then the market is considered to be tracking sideways, or in no trend.
You will need to set only one parameter – “SF” "RSI SMoothing Factor", an analogue of the period in RSI.
By the way, judging from the open source information, the algorithm used the standard strength index with a period of 14 for calculations.
Various signals can be created from the indicator such as:
-Buy when QQE FAST crosses above QQE SLOW below 50 level or just buy when QQE lines crosses above 50 level.
-Sell when QQE FAST crosses below QQE SLOW above 50 level or just sell when QQE lines crosses below 50 level.
WARNING: QQE IS A RSI BASED INDICATOR SO THAT IT CAN TRIGGER FALSE SIGNALS DURING DIVERGENCES!
Kıvanç Özbilgiç

[SK] Double MACDThe Double MACD indicator is precisely two different MACD indicators plotted on the same axis for precise visual correlation between each other.
This correlation provides more information than a single regular MACD by allowing you to compare the signals of a shorter timeframe to the default or longer timeframe,
showing the strength of the change in momentum and the peak of the momentum between both configurations.
The indicator has cloud options by default if you toggle on the MACD / Signal lines for better readability.
The cloud will change color to the line on top of it's set. This is to help you not get lost in the 4 different lines.
Customize the indicator to your preference and make it your own
If you'd like a candle like visualization, change the short MACD plot style to a histogram.
For a beautiful double bars style, select bars on both configurations and set the transparency to 30 - 40
For a dynamic moving average style, go with the line plot style ( default )
All MACD/Signal lines are toggled off by default, toggle them on in the inputs section.
On the styles panel, you can turn off the cloud fills or the lines.
Change all the colors you'd like!
