Black RSI (Pro Suite)Black RSI (Pro Suite) is combination of RSI (Relative Strength Index), Volume RSI, Heikin Ashi RSI & other multi Oscillators with multi features into one indicator, features like (Quad Divergences, Multi Time Frame RSI, MTF RSI Panel, Oscillator Support/Resistance/Wedges/Trendlines, Oscillator Moving Average/BBs, Smooth RSI, RSI Price Estimator, Oscillator Over bought/sold Bars, Osc OB/OS Zones, Osc OB/OS Highlights, additionally Black RSI indicator is flexible & completely customizable).
Indicator goal: I have tried my best to organized RSI & other suitable oscillators and oscillator useful tools into one simple and free indicator for Tradingview users (specifically for Tradingview 'basic' subscription users). suggestions are always welcome. please give feedback & appreciate if you like my work.
Black RSI Indicator Features Summary:
Black RSI indicator includes many features mainly relevant to RSI and other Oscillators, these are briefly highlighted below:
Black RSI Dashboard
Multi Oscillators: Choose between multiple oscillators. All oscillators settings are customizable.
Multi Symbol: Multi Symbol Support, applicable on all oscillators
RSI (Relative Strength Index)
VRSI (Volume Relative Strength Index)
HA RSI (Heikin Ashi Relative Strength Index)
OBV (On Balance Volume)
CVD (Comulative Volume Delta)
MFI (Money Flow Index)
UO (Ultimate Oscillator)
MOM (Momentum Oscillator)
ATR (Average True Range)
Stoch (Stochastic Oscillator)
Stoch RSI (Stochastic RSI)
Oscillator Primary Tools ◢
Oscillator Moving Average/Bollinger Bands
Smooth RSI
Multi Timeframe RSI
Multi Timeframe RSI Panel
RSI Price Estimator
Oscillator Support/Resistance/Wedges/Trendlines
Oscillator Moving Average/BBs: Shows Moving Average for selected oscillator.
Smooth Smooth: Smooths out RSI
Multi Timeframe RSI: Displays Multiple Time Frame/Multiple Symbol RSI and converts it and shows it as it is in current time frame without effecting Primary RSI
Multi Timeframe RSI Panel: Displays Multiple Time Frame/Multiple Symbol RSI values of user input specific timeframes in compact panel (max 8 Time frames)
RSI Price Estimator: Calculates RSI estimate price values of 3 different user specific RSI input levels, RSI x MA cross price and RSI future value of user specific price input level.
Oscillator Support/Resistance/Wedges/Trendlines: Draws Trendlines, Wedges and Support & Resistance lines on selected oscillator
Oscillator Quad Divergence ◢
1st Oscillator Divergence: Traditional divergence indicator with enhancements & customization
2nd Oscillator Divergence: Traditional divergence indicator with enhancements & customization
3rd Oscillator Divergence: Advanced Divergence indicator with source selection, RSI/Price threshold, potential divergences & customization
4th Oscillator Divergence: Pivots divergence indicator with flexible pivots selection & customization
Regular bullish divergences are indicated when price is forming lower lows while an oscillator shows higher lows.
Regular bearish divergences are indicated when price is forming higher highs while an oscillator shows lower highs.
While regular divergences indicate trend reversals, hidden divergences indicate a trend continuation.
When the price is making higher lows and the oscillator is showing lower lows, we speak of a bullish hidden divergence.
When the price is making lower highs and the oscillator shows higher highs, it's a bearish hidden divergence.
Oscillator Secondary Tools ◢
Oscillator HH/LL pivots
Osc OB/OS Color Bars
Osc OB/OS Zones
Osc OB/OS Highlights
Background
Oscillator HH/LL pivots: Shows HH/LL pivot points on selected oscillator
Osc OB/OS Color Bars: Plots color chart bars based on RSI, MFI, Stochastic, Stochastic RSI or combine overbought/oversold conditions
Osc OB/OS Zones: Plots Osc OB/OS Zones with user input levels
Osc OB/OS Highlights: Highlight oscillator OB/OS background area
Background: background color customization
+ Primary RSI Settings ▾
- Primary RSI Length: User input RSI Length value
- Primary RSI Source: User RSI Source selection
- RSI Overbought Threshold: Allows the user to set the RSI overbought threshold value. This Overbought Threshold value will also be applied on "RSI Divergence overbought condition", "RSI OB Color Bars" and "Primary RSI Color Schemes
- RSI Oversold Threshold: Allows the user to set the RSI oversold threshold value. The lower band (oversold line) of RSI. This Oversold Threshold value will also be applied on "RSI Divergence oversold condition", "RSI OS Color Bars" and "Primary RSI Color Schemes
- RSI Middle Band: Allows the user to set the RSI middle band value. This value will also applied to "Center Line" color scheme from "Primary RSI Color Schemes" drop menu
- Primary RSI Colors:
Range color specifies a gradient of colors from the overbought to the oversold threshold user inputs from "Primary RSI" section. Color interpolation also a gradient but smoother than Range color. Center Line is similar but is not a gradient, linked to Middle Band ("Primary RSI" section) and changes color with RSI Middle Band. Traditional is simple with Overbought and Oversold colors change.
- RSI Bullish Band: Allows the user to plot extra/optional RSI band on RSI Oscillator (Note: it will not be plotted if "OB/OS Zone only" enabled from "OB/OS Zone Settings" section)
- RSI Bearish Band: Allows the user to plot extra/optional RSI band on RSI Oscillator (Note: it will not be plotted if "OB/OS Zone only" enabled from "OB/OS Zone Settings" section)
+ Primary RSI Smooth Settings ▾
- Smooth Moving Average Type: User selected Smooth MA type. With RSI Smooth enabled, will also effect all RSI Divergences detection (all divergences will be plot according to "Smoothed RSI line")
- Smooth Moving Average Length: User input Smooth MA length value
+ Oscillator Moving Average Settings ▾
- Osc Moving Average Colors: Allows user to select Bullish/Bearish colors of Oscillator Moving Average
- Osc Moving Average Type: Allows user to select Oscillator MA Type
- Osc Moving Average Length: User input Oscillator MA length value
- Osc Moving Average Thickness: User input Oscillator MA thickness
- BB StdDev: user input Bollinger Bands standard deviation value
+ Stochastic Oscillator Settings ▾
- Same as Traditional/Default indicator
+ Stochastic RSI Oscillator Settings ▾
- Same as Traditional/Default indicator
+ Money Index Flow Settings ▾
- Same as Traditional/Default indicator
+ Ultimate Oscillator Settings ▾
- Same as Traditional/Default indicator
+ Momentum Oscillator Settings ▾
- Same as Traditional/Default indicator
+ Average True Range Settings ▾
- Same as Traditional/Default indicator
+ Multi Timeframe RSI Settings ▾
- MTF RSI Time Frame: Allows user to select MTF RSI Time Frame
- MTF RSI Symbol: Allows user to select MTF RSI Time Symbol
- MTF RSI Length: User input MTF RSI length value
- MTF RSI Source: User selected MTF RSI source
- MTF RSI Line Width: User input MTF RSI line thickness value
- Number of Bars for MTF RSI plot
- MTF RSI Color > OB color > OS color : Allows user to select MTF RSI color with additionally Overbought/Oversold colors
+ MTF RSI Panel Settings ▾
- Select MTF RSI Type: If "Primary RSI" or "Volume RSI" selected MTF RSI Panel will show output values based on "Primary RSI" or "Volume RSI" parameters e.g. source, length, but without smooth.
- MTF RSI Panel Symbol: Allows user to select MTF RSI Panel symbol, leave symbol blank or uncheck "checkbox" for current chart symbol
- Show Symbol in Panel: Shows symbol ticker(current or user selected) in MTF RSI Panel
- Panel Background: Allows user to select MTF RSI Panel Background (enable/disable) and Background color selection
- TF1: MTF RSI Timeframe 1 user selection
- TF2: MTF RSI Timeframe 2 user selection
- TF3: MTF RSI Timeframe 3 user selection
- TF4: MTF RSI Timeframe 4 user selection
- TF5: MTF RSI Timeframe 5 user selection
- TF6: MTF RSI Timeframe 6 user selection
- TF7: MTF RSI Timeframe 7 user selection
- TF8: MTF RSI Timeframe 8 user selection
- Panel Top Offset: MTF RSI Panel offset input value
- Position: MTF RSI Panel position selection
- Text Size: MTF RSI Panel text size selection
- Bullish Colors: MTF RSI Panel bullish color selection. (Bullish colors range RSI >75, <75 to >65, <65 to >55)
- Bearish Colors: MTF RSI Panel bearish color selection. (Bearish colors range RSI <45 to >35, <35 to >25, <25)
+ RSI Price Estimator Settings ▾
- Price 1: User input value for RSI future price
- Price 2: User input value for RSI future price
- Price 3: User input value for RSI future price
- Panel Position Offset: User input value for panel position offset
- Price Decimals: User input value for output price decimals in panel
- Show RSI/OscMA cross Price: Enable/Disable RSIxOscillator MA cross future price
- Show RSI Level for Input Price: User input price for future RSI level
- Invisible Background: Enable/Disable Background
Auto Text Color > Auto color change of Panel text according to Dark/Light chart theme
+ Oscillator Support/Resistance Settings ▾
- Show Support line: Allows user to Enable/Disable Oscillator support line
Color > Auto Color: Auto color change of support line according to Dark/Light chart theme
- Show Resistance line: Allows user to Enable/Disable Oscillator resistance line
Color > Auto Color: Auto color display of resistance line according to Dark/Light chart theme
- Lookback lows/highs: User input of Lookback lows/highs value
- Distance threshold: Distance from the line to the low
- Line touch points: Number of points that have to be around the line
- Low/High left bars: User input of Low/High left bars value
- Low/High right bars: User input of Low/High right bars value
- Line style: User selection of line style
- Line thickness: User input of line thickness value
+ Oscillator 1st Divergence Settings ▾
- Divergence Source: User selection of divergence source. "High/Low" (high/low of oscillator/price divergence detection), "Close" (close of oscillator/price divergence detection) and "Both" (Both Close + High/Low of oscillator/price divergence detection). (Note: Traditional Divergence indicator default source is "High/Low")
- Pivot Lookback Right: How many candle to compare on the right side of a candle when deciding whether it is a pivot. The lower the number is, the earlier pivots (and therefore divergences) will be signaled, but the quality of those detections could be lower.
- Pivot Lookback Left: How many candle to compare on the left side of a candle when deciding whether it is a pivot. The lower the number is, the earlier pivots (and therefore divergences) will be signaled, but the quality of those detections could be lower.
- Divergence Max Length (Bars): The maximum length of a divergence (number of bars). If a detected divergence is longer than this, it will be discarded
- Divergence Min Length (Bars): The minimum length of a divergence (number of bars). If a detected divergence is shorter than this, it will be discarded
- Show Divergence as:
- Line Thickness: User input divergence line thickness value
- Label Transparency: it could reduce labels mess on oscillator line, input "100" for label text only without label background
- Labels Text Color: User label text color selection
Auto Text Color > Auto color change of label text according to Dark/Light chart theme
- Bull Divergences: Enable/Disable of Bull divergences
> Color: User selection of Bull divergence color
> Oversold only: It will show Regular Bullish RSI divergences in oversold zone only, RSI oversold threshold can be configure in "Primary RSI Settings" section.
- Bear Divergences: Enable/Disable of Bear divergences
> Color: User selection of Bear divergence color
> Overbought only: It will show Regular Bearish RSI divergences in overbought zone only, RSI overbought threshold can be configure in "Primary RSI Settings" section.
- Hidden Bull Div: Enable/Disable of Hidden Bull divergences
> Color: User selection of Hidden Bull divergence color
- Hidden Bear Div: Enable/Disable of Hidden Bear divergences
> Color: User selection of Hidden Bear divergence color
+ Oscillator 2nd Divergence Settings ▾
- Same as Oscillator 1st Divergence Settings
+ Oscillator 3rd Divergence Settings ▾
- Divergence source: User selection of divergence source . "oscillator" (divergence detection with high/low or close of selected oscillator), "price" (divergence detection with high/low or close of price)
- Bull price source: User selection of Bull price source. Bull price source: "Low" (low of price divergence detection), "Close" (close of price divergence detection) (linked to "price" in "Divergence source")
- Bear price source: User selection of Bear price source. Bear price source: "High" (high of price divergence detection), "Close" (close of price divergence detection) (linked to "price" in "Divergence source")
- Low/High left bars: How many candle to compare on the left side of a candle when deciding whether it is a pivot. The lower the number is, the earlier pivots (and therefore divergences) will be signaled, but the quality of those detections could be lower.
- Low/High right bars: How many candle to compare on the right side of a candle when deciding whether it is a pivot. The lower the number is, the earlier pivots (and therefore divergences) will be signaled, but the quality of those detections could be lower.
- Maximum lookback bars: The maximum length of a divergence (number of bars). If a detected divergence is longer than this, it will be discarded.
- Price threshold: User selection of Price threshold, higher values more lines
- RSI threshold: User selection of RSI threshold, higher values more lines
- Show Lows: Displays lows of RSI
- Show Highs: Displays highs of RSI
- Show Divergence as:
- Line Style:
- Line thickness: User input divergence line thickness value
- Label Transparency: it could reduce labels mess on oscillator line, input "100" for label text only without label background
- Labels Text Color: User label text color selection
Auto Text Color > Auto color change of label text according to Dark/Light chart theme
- Bull Divergences: Enable/Disable of Bull divergences
> Color: User selection of Bull divergence color
> Potential Bull: It will plot potential regular bull divergence with dotted line.
- Bear Divergences: Enable/Disable of Bear divergences
> Color: User selection of Bear divergence color
> Potential Bear: It will plot potential regular bear divergence with dotted line.
- Hidden Bull Div: Enable/Disable of Hidden Bull divergences
> Color: User selection of Hidden Bull divergence color
> Potential H.Bull: It will plot potential hidden bull divergence with dotted line.
- Hidden Bear Div: Enable/Disable of Hidden Bear divergences
> Color: User selection of Hidden Bear divergence color
> Hidden Bear divergence: It will plot potential hidden bear divergence with dotted line.
> Regular Bull oversold only: It will show Regular Bullish RSI divergences in oversold zone only, RSI oversold threshold can be configure in "Primary RSI Settings" section.
> Regular Bear overbought only: It will show Regular Bearish RSI divergences in overbought zone only, RSI overbought threshold can be configure in "Primary RSI Settings" section.
+ Oscillator 4th Divergences Settings ▾
- Upper Length: User pivot input value of draw upper divergence line From
- To Pivot:
- Lower Length: User pivot input value of draw lower divergence line From
- To Pivot:
- Show Divergence as:
- Line Style:
- Line thickness: User input divergence line thickness value
- Label Transparency: it could reduce labels mess on oscillator line, input "100" for label text only without label background
- Labels Text Color: User label text color selection
Auto Text Color > Auto color change of label text according to Dark/Light chart theme
- Bull Divergences: Enable/Disable of Bull divergences
> Color: User selection of Bull divergence color
- Bear Divergences: Enable/Disable of Bear divergences
> Color: User selection of Bear divergence color
- Regular Bull oversold only: It will show Regular Bullish RSI divergences in oversold zone only, RSI oversold threshold can be configure in "Primary RSI Settings" section.
- Regular Bear overbought only: It will show Regular Bearish RSI divergences in overbought zone only, RSI overbought threshold can be configure in "Primary RSI Settings" section.
+ Oscillator HHLL Pivots Settings ▾
- Pivot Length: User input value of HH/LL pivot length
> L.Text Color: User label text color selection
- HH color: User HH Label color selection
- HL color: User HL Label color selection
- LH color: User LH Label color selection
- LL color: User LL Label color selection
+ Oscillator OB/OS Colored Bars Settings▾
- Overbought/Oversold Bars Oscillator: Plots Overbought/Oversold color bars based on RSI, MFI, Stoch, Stoch RSI overbought/oversold threshold conditions separately or combined(when every oscillator reach its OB or OS threshold condition at same time).
- Overbought Bar Color: User RSI OB Bars color selection
- Oversold Bar Color: User RSI OS Bars color selection
+ Primary RSI Range Color ▾
- OB: Overbought Color
- OS: Oversold Color
- Bullish: Bullish Color
- Bearish: Bearish Color
+ Primary RSI Color interpolation ▾
- RSI Color: RSI Color
- OB: Overbought Color
- OS: Oversold Color
+ Primary RSI Center Line Color ▾
- OB: Overbought Color
- Bullish: Bullish Color
- Bearish: Bearish Color
- OS: Oversold Color
+ Primary RSI Traditional Color ▾
- RSI Color: RSI Color
- OB: Overbought Color
- OS: Oversold Color
Osc Overbought/Oversold Zones Settings ▾
- OB/OS Zone Band Lines: Enable/Disable OB/OS Zone Band Lines
- OB/OS Zones only: Only shows OB/OS Zones and disable all RSI band lines except Middle Band. Background will not be effected by this setting.
- Overbought Zone: User input value of Overbought Zone from
> To:
- Oversold Zone: User input value of Oversold Zone from
> To:
Osc Overbought/Oversold Highlights ▾
- Overbought Highlights : Enable/Disable Overbought Highlights
- Oversold Highlights : Enable/Disable Oversold Highlights
- Transparency: Gradient transparency of highlighted area
+ 'Oscillators Color Settings ▾
- Show Osc Symbol label : Enable/Disable of oscillator symbol label. Displays current oscillator symbol, but with "Override Oscillator Symbol" enabled from "Black RSI Dashboard" it will Auto/forcefully displays Override Oscillator Symbol on Oscillator
- Fade out Oscillator line: Fade out the oscillator line color, focusing only the most recent periods prominent for a clearer chart
- Fill Stoch/StochRSI lines: Fills Stoch/Stoch RSI lines
- Oscillator line thickness: user input value of oscillator line thickness
- Oscillator line offset: Shifts the oscillator to the left or to the right on the given number of bars, Default is 0
- OBV Color
- MFI Color
- ATR Color
- UO Color
- MOM Color
- CVD Bullish Color
- CVD Bearish Color
+ Background Setting ▾
- Custom Background Color: User selection of Background color
Authors & Credits: I'd like to THANK to Nabeel Black(myself), LonesomeTheBlue, iFuSiiOnzZ, jmosullivan, zdmre, creengrack, and TradingView for the locally sourced ingredients.
Disclaimer: DYOR. Not financial advice. Not a trading system. I am not affiliated with TradingView or any authors mentioned here; You alone have the sole responsibility of evaluating the script output and risks associated with the use of the script. Trading success is all about following your trading strategy and the indicators should fit within your trading strategy, and not to be traded upon solely. Always trade with confluence and Risk Management.
Feedback & Bug report
if you found any bug in this indicator or any suggestion, please let me know. Please give feedback & appreciate if you like to see more future updates and indicators. Thank you
Rsidivergence

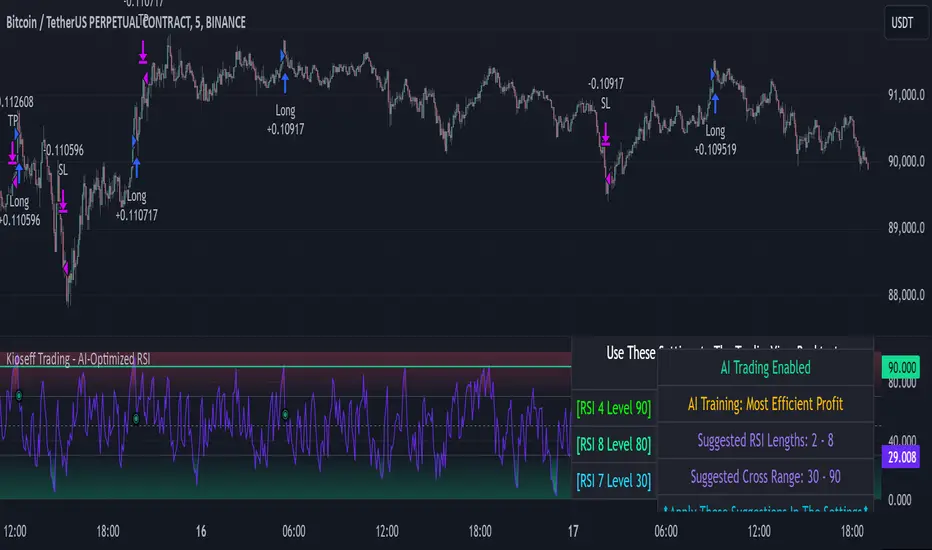
Kioseff Trading - AI-Optimized RSIAI-Optimized RSI
Introducing AI-Optimized RSI: a streamlined solution for traders of any skill level seeking to rapidly test and optimize RSI. Capable of analyzing thousands of strategies, this tool cuts through the complexity to identify the most profitable, reliable, or efficient approaches.
Paired with TradingView's native backtesting capabilities, the AI-Optimized RSI learns from historical performance data. Set up is easy for all skill levels, and it makes fine-tuning trading alerts and RSI straightforward.
Features
Purpose : Uncover optimal RSI settings and entry levels with precision. Say goodbye to random guesses and arbitrary indicator use—this tool provides clear direction based on data.
Target Performance : You set the goal, and AI-RSI seeks it out, whether it's maximizing profits, efficient trading, or achieving the highest win rate.
AI-Powered : With intelligent AI recommendations, the tool dynamically fine-tunes your RSI approach, steering you towards ideal strategy performance.
Rapid Testing : Evaluate thousands of RSI strategies.
Dual Direction : Perfect both long and short RSI strategies with equal finesse.
Deep Insights : Access detailed metrics including profit factor, PnL, win rate, trade counts, and more, all within a comprehensive strategy script.
Instant Alerts : Set alerts and trade.
Full Customization : Test and optimize all RSI settings, including cross levels, profit targets and stop losses.
Simulated Execution : Explore the impact of limit orders and other trade types through simulation.
Integrative Capability : Combine your own custom indicators or others from the TradingView community for a personalized optimization experience.
Flexible Timeframes : Set your optimization and backtesting to any date range.
Key Settings
The image above shows explanations for a list of key settings for the optimizer.
Direction : This setting controls trade direction: Long or Short.
Entry Condition : Define RSI entry: Select whether to trigger trades on RSI crossunders or crossovers.
RSI Lengths Range : Choose the range of RSI periods to test and find the best one.The AI will find the best RSI period for you.
RSI Cross Range : Set the range for RSI levels where crosses trigger trade signals. The AI will find the best level for you.
Combinations : Select how many RSI strategies to compare.
Optimization Type : Choose the goal for optimization and the AI: profit, win rate, or efficiency.
Profit Target : Set your profit target with this setting.
Stop Loss : Decide your maximum allowable loss (stop loss) per trade.
Limit Order : Specify whether to include limit orders in the strategy.
Stop Type : Choose your stop strategy: a fixed stop loss or a trailing stop.
How to: Find the best RSI for trading
It's important to remember that merely having the AI-Optimized RSI on your chart doesn't automatically provide you with the best strategy. You need to follow the AI's guidance through an iterative process to discover the optimal RSI settings and strategy.
1.Starting Your Strategy Setup
Begin by deciding your goals for each trade: your profit target and stop loss. You'll also choose how to manage your stops – whether they stay put (fixed) or move with the price (trailing), and whether you want to exit trades at a specific price (limit orders). Keep the initial settings for RSI lengths and cross ranges at their default to give the tool a broad testing field. The AI's guidance will refine these settings to pinpoint the most effective ones through a process of comprehensive testing.
The image above shows our chart prior to any optimization efforts.
Note: the settings shown above in the key settings section will be used to start our demonstration.
2. Follow AI’s suggestions
Optimization Prompt: After loading your strategy, the indicator will prompt you to change the RSI length range and RSI level range to a better performing range.
Continue changing the RSI length range and RSI level range to match the indicator's suggestions until "Best Found" is displayed!
The image above shows results after we applied the tool’s suggestions. New suggestions have appeared, and we will continue to apply them.
Continue to adjust settings as recommended by the optimizer. If no better options are found, the optimizer will suggest increasing the number of combinations. Repeat this process until the optimizer indicates that the optimal setting has been identified.
Success! With the "Best Found" notification, an optimized RSI is now active. The AI will keep refining the strategy based on ongoing performance, ensuring continuous optimization.
AI Mode
AI Mode incorporates Heuristic-Based Adaptive Learning to fine-tune trading strategies in a continuous manner. This feature consists of two main components:
Heuristic-Based Decision Making: The algorithm evaluates multiple RSI-based trading strategies using specific metrics such as Profit and Loss (PNL), Win Rate, and Most Efficient Profit. These metrics act as heuristics to assist the algorithm in identifying suitable strategies for trade execution.
Online Learning: The algorithm updates the performance evaluations of each strategy based on incoming market data. This enables the system to adapt to current market conditions.
Incorporating both heuristic-based decision-making and online learning, this feature aims to provide a framework for trading strategy optimization.
Settings
AI Mode Aggressiveness:
Description: The "AI Mode Aggressiveness" setting allows you to fine-tune the AI's trading behavior. This setting ranges from “Low” to “High”, with “High” indicating a more assertive trading approach.
Functionality: This feature filters trading strategies based on a proprietary evaluation method. A higher setting narrows down the strategies that the AI will consider, leaning towards more aggressive trading. Conversely, a lower setting allows for a more conservative approach by broadening the pool of potential strategies.
Adaptive Learning Aggressiveness:
Description: When Adaptive Learning is enabled, the "Adaptive Learning Aggressiveness" setting controls how dynamically the AI adapts to market conditions using selected performance metrics.
Functionality: This setting impacts the AI's responsiveness to shifts in strategy performance. By adjusting this setting, you can control how quickly the AI moves away from strategies that may have been historically successful but are currently underperforming, towards strategies that are showing current promise.
Optimization
Trading system optimization is immensely advantageous when executed with prudence.
Technical-oriented, mechanical trading systems work when a valid correlation is methodical to the extent that an objective, precisely-defined ruleset can consistently exploit it. If no such correlation exists, or a technical-oriented system is erroneously designed to exploit an illusory correlation (absent predictive utility), the trading system will fail.
Evaluate results practically and test parameters rigorously after discovery. Simply mining the best-performing parameters and immediately trading them is unlikely a winning strategy. Put as much effort into testing strong-performing parameters and building an accompanying system as you would any other trading strategy. Automated optimization involves curve fitting - it's the responsibility of the trader to validate a replicable sequence or correlation and the trading system that exploits it.
Bezahltes Script
RSI DivergenceWhat is "RSI Divergence"?
"RSI Divergence" is a indicator that find RSI divergence automatically.
What it does?
When it finds an RSI divergence, it draws a line on the indicator.
How it does it?
The lines are found using the least squares method. If the signs of the linear regression on the graph and the linear regression plotted on the RSI are different, this is considered divergence.
How to use it?
RSI lenght = RSI lenght
source = source of RSI
RSI Divergence Lenght = lenght of lines that draws on indicator
zoom = zoom
examples:

RSI Exhaustion + DivergenceThe Relative Strength Index Exhaustion with Divergence is an essential replacement of the standard Relative Strength Index Oscillator because it's able to identify and highlight hidden exhaustions together with Bullish/Bearish Regular and Hidden Divergences.
This indicator can give the outmost probability in spotting trend reversals or trend continuation.
By identifying hidden exhaustion momentum, the Relative Strength Index Exhaustion indicator represents an essential support to the trader in effectively reading the market and grabbing the best opportunities.
This detects divergences between price and indicator with 1 candle delay so it filters out repeating divergences.
Recommended to use this at a higher timeframe to lessen the false signals.
Red Arrow = Bullish/Bearish Divergence
White Arrow = Hidden Bullish/Bearish Divergence
RSI Momentum Acceleration by TartigradiaPlots the momentum acceleration oscillators from price and RSI, rescaled and with areas above/below highlighted.
Usage: in a nutshell, when the background is yellow, it's bearish (RSI decelerates faster than price), whereas when the background is green, it's bullish (RSI accelerates faster than price). It appears to detect early some reversals that are otherwise difficult to detect.
Note: it supports using any other indicator's output as the second source input, instead of RSI. PineScript does not allow for more than one source to receive input from other indicators, all the others must only use price as an input.
This indicator uses the core routine to calculate Momentum Acceleration Oscillators by DGT:
This indicator is based on the idea of stinkbug : "RSI is a good momentum indicator showing how excited ppl are on a move, this is why divergences on it work so well. I would like to see the change accelerating or slowing on a move up or down.."

Yasir Hameed Advance RSI IndicatorRELATIVE STRENGTH INDEX ( RSI )
This is a tool that is widely used
Especially for Overbought and Oversold systems, but I have made some changes in this indicator,
How to use it...!
I have set it as the default setting
- RSI Length: 7
- Overbought: 70
- Oversold: 30
What is unique about this tool?
we can see 3 conditions:
1) RSI Overbought / Oversold with Bullish Engulfing / Bearish Engulfing
2) RSI Overbought / Oversold with Hammer and Shooting Star
3) RSI Overbought / Oversold with 2 Bullish Bars / 2 Bearish Bars
4) RSI Overbought / Oversold with All Patterns at the same time
When the RSI reaches its Oversold line, the code will wait for Bullish Engulfing pattren, when oversold and Bullish engulfing matched, This indicator will generate a buy signal when the condition is met,
and same as for Bear market, When the RSI reaches its Overbought line, the code will wait for Bearish Engulfing pattren, This indicator will generate a sell/exit signal when the condition is met,
2nd condition is that a Hammer candle will be waited for when RSI touches the Overbought line, for Bullish Move
and Shooting Star candle will be waited for when RSI touches the Overbought line, for Bullish Move, for Bearish Move
3rd Condition is also the same as Condition 1 and Condition 2,
When the RSI reaches its Oversold line, the code will wait for 2 Bullish Bars, when oversold and 2 Bullish Bars matched then this indicator will generate a buy signal, and same as for Bear market,
When the RSI reaches its Overbought line, the code will wait for 2 Bearish Bars, when overbought and 2 Bearish Bars matched then this indicator will generate a Sell signal,
4th Condition is that we can use All Conditions at the same time,
- Bullish Engulfing / Bearish Engulfing
- Hammer and Shooting Star
- 2 Bullish Bars / 2 Bearish Bars

ViVen - MTF RSI - Multi Timeframe RSIHi Traders,
This is very simple tool which plots 5m, 15m, 1H, 1D, 1W and 1M timeframe RSI lines into chart irrespective of Session you are in.
You can turn ON/OFF if any RSI is not needed, also you can customize the view as well.
Strategy:
Basically,
RSI value above 60 is BULLISH
RSI value below 40 is BEARISH
Combining all timeframes we can identify the possibility of Price movement.
For example,
If Monthly RSI, Weekly RSI and Daily RSI - Above 60 then if 15m or 1Hr RSI takes support at 40 / 60 levels we can look for Buying the Stock.
Happy Trading!!

RSI Potential Divergence - FontiramisuIndicator showing potential momentum divergences on RSI Momentum.
The problem with the classic divergence is that when the signal appears, it is sometimes too late to enter a trade.
The potential divergence corrects this problem by signaling the beginning of a potential divergence.
RSI is a momentum indicator that offers relevant insights with divergences.
Potential divergences are indicated with the letter B and a red color for Bearish Div or Green color for Bullish Div .
Potential divergence is confirmed when the line and the label "Bear"' or "Bull" appear.

Ultimate RSI With Some Spices★彡 𝓤𝓵𝓽𝓲𝓶𝓪𝓽𝓮 𝓡𝓢𝓘 𝓦𝓲𝓽𝓱 𝓢𝓸𝓶𝓮 𝓢𝓹𝓲𝓬𝓮𝓼 彡★
* Hi everybody here's the ★彡 𝓤𝓵𝓽𝓲𝓶𝓪𝓽𝓮 𝓡𝓢𝓘 𝓦𝓲𝓽𝓱 𝓢𝓸𝓶𝓮 𝓢𝓹𝓲𝓬𝓮𝓼 彡★ indicator and how to use it :
彡彡彡彡彡彡彡彡彡彡彡彡彡彡彡彡彡彡彡彡彡彡彡彡彡彡彡彡彡
First we have that red : green {RSI EMA Line}line in the indicator which show the current symbol situation \
𝐒𝐢𝐦𝐩𝐥𝐲 : 𝐢𝐟 𝐭𝐡𝐞 𝐥𝐢𝐧𝐞 𝐜𝐥𝐨𝐬𝐞 𝐰𝐢𝐭𝐡 𝐠𝐫𝐞𝐞𝐧 𝐜𝐨𝐥𝐨𝐫 𝐲𝐨𝐮 𝐜𝐚𝐧 𝐨𝐩𝐞𝐧 𝐚 𝐥𝐨𝐧𝐠 𝐭𝐫𝐚𝐝𝐞 𝐚𝐧𝐝 𝐞𝐱𝐢𝐭 𝐰𝐡𝐞𝐧 𝐭𝐡𝐞 𝐫𝐞𝐝 𝐜𝐨𝐥𝐨𝐫 𝐚𝐩𝐩𝐞𝐚𝐫𝐬
I𝐧 𝐭𝐡𝐞 𝐬𝐚𝐦𝐞 𝐭𝐢𝐦𝐞 𝐰𝐞 𝐡𝐚𝐯𝐞 𝐨𝐭𝐡𝐞𝐫 𝐭𝐡𝐢𝐧𝐠𝐬 𝐭𝐨 𝐮𝐬𝐞 𝐰𝐢𝐭𝐡 𝐭𝐡𝐚𝐭 𝐰𝐨𝐮𝐥𝐝 𝐡𝐞𝐥𝐩 𝐮𝐬 𝐭𝐨 𝐦𝐚𝐤𝐞 𝐚 𝐠𝐨𝐨𝐝 𝐨𝐫𝐝𝐞𝐫
Like The 𝐂𝐲𝐜𝐥𝐞𝐫 𝐬𝐢𝐭𝐮𝐚𝐭𝐢𝐨𝐧 𝐚𝐧𝐝 𝐟𝐢𝐛𝐨𝐧𝐚𝐜𝐜𝐢 𝐥𝐞𝐯𝐞𝐥𝐬
We have the 𝐧𝐞𝐱𝐭 𝐟𝐢𝐛𝐨𝐧𝐚𝐜𝐜𝐢 𝐥𝐞𝐯𝐞𝐥𝐬 𝟐𝟎 ,𝟑𝟎 ,𝟓𝟎 ,𝟔𝟏.𝟖 ,𝟖𝟎 { 61.8 𝐢𝐬 𝐭𝐡𝐞 𝐭𝐡𝐞 𝐟𝐢𝐛𝐨𝐧𝐚𝐜𝐜𝐢 𝐠𝐨𝐥𝐝𝐞𝐧 𝐫𝐚𝐭𝐢𝐨 }
About The 𝐂𝐲𝐜𝐥𝐞𝐫 you can use it to know where is the current symbol go { UP : Green ,| Down : Red ,| White : Where the symbol movement is in a slight fluctuation without any significant up or down }
░▒▓█ 𝐍𝐨𝐭𝐞 : 𝐓𝐡𝐞 𝐂𝐲𝐜𝐥𝐞𝐫 𝐥𝐢𝐧𝐞 𝐢𝐬 𝐭𝐡𝐞 𝐬𝐚𝐦𝐞 𝐟𝐢𝐛𝐨𝐧𝐚𝐜𝐜𝐢 𝐥𝐞𝐯𝐞𝐥 ' 𝐫𝐚𝐭𝐢𝐨 𝟓𝟎 ' █▓▒░
𝐡𝐞𝐫𝐞'𝐬 𝐚 𝐟𝐚𝐬𝐭 𝐩𝐡𝐨𝐭𝐨 𝐭𝐡𝐚𝐭 𝐬𝐡𝐨𝐰 𝐞𝐯𝐞𝐫𝐲𝐭𝐡𝐢𝐧𝐠
When the RSI EMA Line reach the purple 𝐟𝐢𝐛𝐨𝐧𝐚𝐜𝐜𝐢 level its a very good entry point where the RSI is over sold and ready to g oup again
When the RSI EMA Line reach the Golden 𝐟𝐢𝐛𝐨𝐧𝐚𝐜𝐜𝐢 level its a very important area in the line crossover it then it's a very amazing entry time but if the RSI EMA line crossunder this line then the price w'll drop down
❤❤❤❤ 𝐟𝐢𝐧𝐚𝐥𝐥𝐲 𝐇𝐚𝐯𝐞 𝐚 𝐠𝐨𝐨𝐝 𝐭𝐢𝐦𝐞 ❤❤❤❤
RSI - S&P Sector ETFsThe script displays RSI of each S&P SPDR Sector ETF
XLB - Materials
XLC - Communications
XLE - Energy
XLF - Financials
XLI - Industrials
XLK - Technology
XLP - Consumer Staples
XLRE - Real Estate
XLU - Utilities
XLV - Healthcare
XLY - Consumer Discretionary
It is meant to identify changes in sector rotation, compare oversold/overbought signals of each sector, and/or any price momentum trading strategy applicable to a trader.

RSI Divergence Scanner by zdmreDivergence is when the price of an asset is moving in the opposite direction of a technical indicator, such as an oscillator, or is moving contrary to other data. Divergence warns that the current price trend may be weakening, and in some cases may lead to the price changing direction.
If the stock is rising and making new highs, ideally the RSI is reaching new highs as well. If the stock is making new highs, but the RSI starts making lower highs, this warns the price uptrend may be weakening. This is negative divergence.
Positive divergence is the opposite situation. Imagine the price of a stock is making new lows while the RSI makes higher lows with each swing in the stock price. Investors may conclude that the lower lows in the stock price are losing their downward momentum and a trend reversal may soon follow.
Divergence is one of the common uses of many technical indicators, primarily the oscillators.
Use it at your own risk

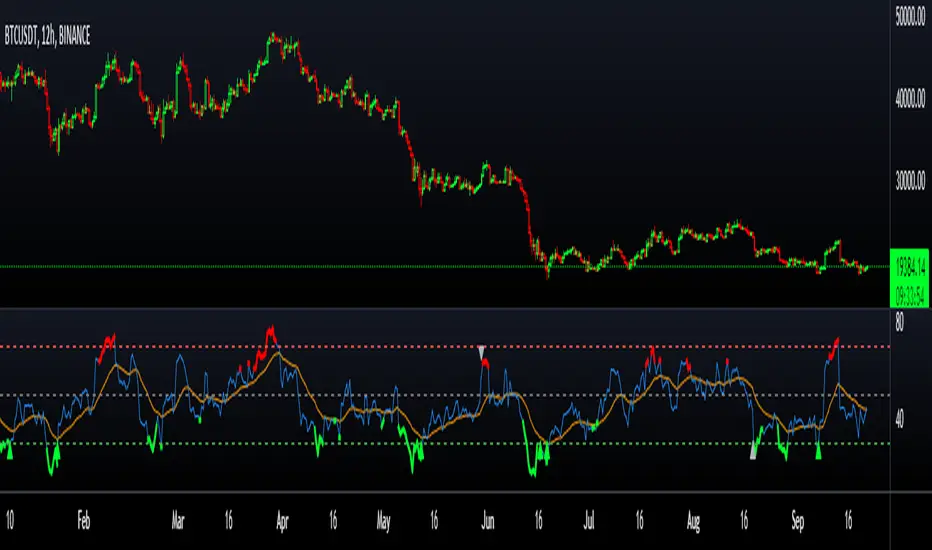
RSI Scalping & Swing Signals With AlertsThis RSI indicator shows a green or red ribbon when the smoothed RSI is bullish or bearish. It also includes a long moving average for overall trend confirmation. Wait until the ribbon holds above or below the long moving average and take positions in that direction.
To get an easier to read RSI indicator, I smoothed the RSI out and paired it next to a short term RMA. These two together form the ribbon that will show you early reversals and trend direction. The long moving average is used as an overall trend detector and confirmation for longer term trends.
***HOW TO USE***
Scalping: Enter longs when the ribbon turns green and enter shorts when the ribbon turns red. Exit positions when the ribbon turns the opposite color or crosses the long moving average.
Swing Trading: When the ribbon holds above the long moving average or breaks out and retests it, look for long positions and exit when the ribbon turns red or crosses the long moving average. When the ribbon holds below the long moving average or breaks down and retests it, look for short positions and exit when the ribbon turns green or crosses the long moving average.
***DETAILS***
This indicator gives early reversal signals very well and waiting for the RSI ribbon to cross the long moving average helps to get you into positions when the market is ready to really move while filtering out some of the noise.
The ribbon and background will change to green or red depending on whether it is currently bullish or bearish.
There is also a label that changes colors and tells you if RSI is bullish or bearish and also whether the RSI ribbon is above or below the long moving average.
Green or red circles will appear on the indicator when there is a bullish or bearish cross of the RSI ribbon and the long moving average.
It also has alerts that trigger when RSI is turning bullish/bearish or when the RSI ribbon is crossing the long moving average.
***CUSTOMIZATION***
Each piece of this indicator can be customized to suit your preferences including the RSI source, length, smoothing length, short moving average length and long moving average length. You can also turn off the labels, signals and long moving average. All of these settings can be managed within the indicator settings input tab.
***MARKETS***
This indicator can be used as a signal on all markets, including stocks, crypto, futures and forex.
***TIMEFRAMES***
This RSI Scalping & Swing Signals indicator can be used on all timeframes.
***TIPS***
Try using numerous indicators of ours on your chart so you can instantly see the bullish or bearish trend of multiple indicators in real time without having to analyze the data. Some of our favorites are Trend Friend Scalp & Swing Trade Signals, Volume Spike Scanner, Buy & Sell Pressure Volume Profile, and Momentum Scalper in combination with this RSI indicator. They all have real time Bullish and Bearish labels as well so you can immediately understand each indicator's trend.

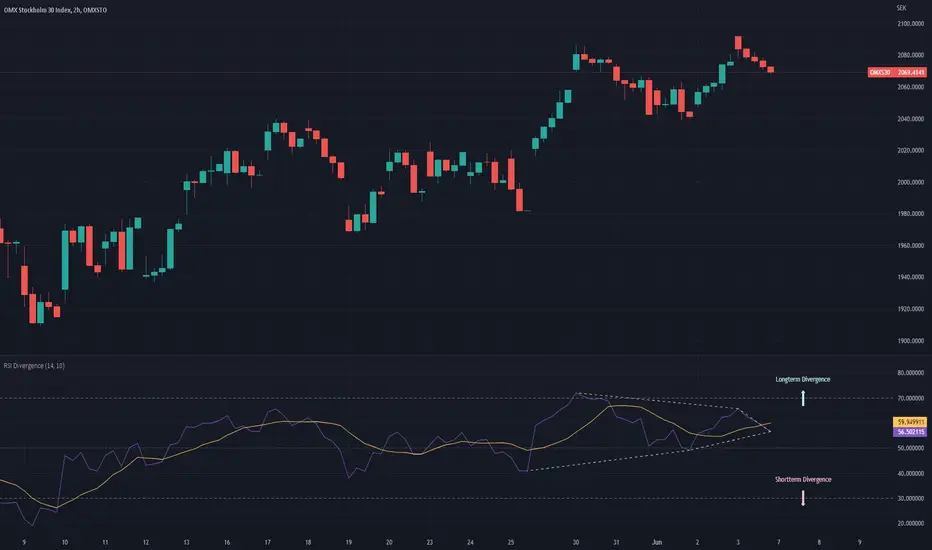
RSI DivergenceThe RSI DIvergence script tries to predict the upper and lower trend-lines for the current security’s RSI.
The script identifies peaks and valleys within the RSI and then tries to draw a trend-line in between the peaks and the valleys. The longest possible trend-line originating from the latest peak/valley will be used to determine whether or not the trend is moving up or down, the slope of the trend-line will then dictate the direction of the trend.
(If no trend line can be drawn from the latest peak/valley, the current value of the RSI will be used as the origin point of the trend-line)
Once the script has identified the trendlines they will be superimposed on the RSI line as dashed lines. The color of the dashed lines will depend on the direction of the trend, an upwards moving trend will be depicted in green,whilst a downwards moving trend will be depicted in red.
Furthermore, the script will draw two arrows, representing the short term trend and the long term trend, as to make it even more clear which direction the two trend-lines have.
If only one trend-line (either upper or lower) can be found, the script will replace the corresponding arrow with a diamond shape instead.
Bogdan Ciocoiu - CoordinatorDescription
The Coordinator is an indicator developed on the back of the RSI algorithm, modified substantially to form a cloud. In addition, the Coordinator uses EMA/SMA to compare the location of the RSI cloud with the chosen moving averages (EMA vs SMA).
This indicator is helpful as it confirms when a trader should enter a position or exit based on the proximity of the RSI cloud to the relevant MA.
Uniqueness
The Coordinator provides unique benefits, including:
It shows the strength of the RSI in the shape of the RSI cloud, using two sets of dimensions (one more long term and one more short-term oriented).
It indicates the positioning of the RSI cloud in conjunction with the relevant moving averages to help traders remain in positions for longer.
It shows the RSI 14 (useful when spotting divergences aligned with the price action).
Open-source
The Coordinator uses the following open-source scripts:
www.tradingview.com

Bogdan Ciocoiu - LitigatorDescription
The Litigator is an indicator that encapsulates the value delivered by the Relative Strength Index, Ultimate Oscillator, Stochastic and Money Flow Index algorithms to produce signals enabling users to enter positions in ideal market conditions. The Litigator integrates the value delivered by the above four algorithms into one script.
This indicator is handy when trading continuation/reversal divergence strategies in conjunction with price action.
Uniqueness
The Litigator's uniqueness stands from integrating the above algorithms into the same visual area and leveraging preconfigured parameters suitable for short term scalping (1-5 minutes).
In addition, the Litigator allows configuring the above four algorithms in such a way to coordinate signals by colour-coding or shape thickness to aid the user with identifying any emerging patterns quicker.
Furthermore, Moonshot's uniqueness is also reflected in the way it has standardised the outputs of each algorithm to look and feel the same, and in doing so, enabling users to plug them in/out as needed. This also includes ensuring the ratios of the shapes are similar (applicable to the same scale).
Open-source
The indicator uses the following open-source scripts/algorithms:
www.tradingview.com
www.tradingview.com
www.tradingview.com
www.tradingview.com

MFI + RSI + MOM With Bull & Bear Trend LabelMOMENTUM + MONEY FLOW INDEX + RELATIVE STRENGTH INDEX WITH BULL & BEAR LABELS
This is a combination of 3 popular indicators. Momentum(MOM), Money Flow Index(MFI) and Relative Strength Index(RSI) along with color changing labels that tell you each indicator's current trend.
The middle white line shows the level that each indicator needs to stay above to be bullish and below for bearish. Watch for all three indicators to cross and hold above or below the mid line for big moves.
It is important to note that these indicators do not need to be going up to be bullish or down to be bearish. They just need to hold above or below the mid line to understand the overall trend.
The momentum indicator is the most relevant in my opinion. If it is holding above the mid line steadily, usually the overall trend will continue upwards so look to buy the dips if the momentum cloud is staying above the white line and vice versa.
It is also important to note that the default settings for this indicator are the 100 period as I find it to be super relevant across most charts but these numbers can be changed in the indicator settings.
Since momentum swings wildly past the normal 0-100 range, it is important to note that the momentum line has been “normalized” to stay within this same range as the rsi and mfi. So if you look at a normal momentum indicator side by side with this indicator it will not look the same however, I find it to be a very good indicator of overall direction so I know the current market sentiment even when price is diverging from the indicator directions.
All of the colors, sources and lengths can be easily customized in the indicator settings input tab.
***HOW TO USE***
When Momentum is above the mid line, it is bullish. When Momentum is below the mid line, it is bearish.
A label on the right side will update in real time to tell you if momentum is Bullish or Bearish for faster recognition of the trend.
When RSI is above the mid line, it is bullish. When Momentum is below the mid line it is bearish.
A label on the right side will update in real time to tell you if RSI is Bullish or Bearish for faster recognition of the trend.
When MFI is above the mid line, it is bullish. When MFI is below the mid line it is bearish.
A label on the right side will update in real time to tell you if MFI is Bullish or Bearish for faster recognition of the trend.
This indicator was built to help you quickly identify the Bullish or Bearish nature of the current trend with a live color changing label so you can glance at the label and understand it's direction without analyzing the indicator data.
***MARKETS***
This indicator can be used as a signal on all markets, including stocks, crypto, futures and forex.
***TIMEFRAMES***
This mom + mfi + rsi indicator can be used on all timeframes.
***TIPS***
Try using numerous indicators of ours on your chart so you can instantly see the bullish or bearish trend of multiple indicators in real time without having to analyze the data. Some of our favorites are our Auto Fibonacci, Directional Movement Index, Volume Profile, Auto Support And Resistance and Money Flow Index in combination with this indicator. They all have real time Bullish and Bearish labels as well so you can immediately understand each indicator's trend.

Rodiz & BA🐷 RSI & EMA + DivergenceRodiz & BA🐷 RSI & EMA + Divergence
Just simply adding Divergence to this already amazing Pig RSI Indicator
KINSKI Multi RSI DivergenceThis extremely useful indicator combines several RSI variants (can be displayed simultaneously or alone) with many setting options. The RSI variants can also be displayed as an extra histogram, which provides additional valuable information. Furthermore, it is possible to set smoothing types, volume and stochastic based calculations for each variant.
Relative Strength Index (RSI)
The Relative Strength Index ( RSI ) is a momentum indicator that measures the extent of recent price changes to analyse overbought or oversold conditions. RSI values range from 0 to 100. In general, RSI divergence means that the RSI indicator is moving in the opposite direction compared to the price. So while the price is moving, the RSI is telling us in advance that we can expect a change in direction.
RSX Indicator
The RSX is the noise-free version of the more familiar RSI oscillator. Normally, any indicator can be smoothed by applying a moving average. However, a major disadvantage of such a method is that there is a time lag between the indicator and the price. The RSX indicator tries to do this without signal delay.
Money Flow Indicator (MFI)
The MFI is essentially the RSI with the added aspect of volume . Because of its close similarity to the RSI , the MFI can be used in very similar ways.
RSI Laguerre
The RSI Laguerre works in the same way as the classic RSI , but is more sensitive to recent prices. When it crosses the signal line at the value of 0.15 from the bottom to the top, a buy signal is created, while overbought markets have values of 0.75 or higher
Detection of divergences
The detection of divergences in the RSI is one of the most important functions of this indicator. The reason is that an divergence is a more reliable signal than the overbought and oversold indicators themselves. You get overbought and oversold signals all the time. However, the divergence is a rare event.
In general, divergence means that the RSI indicator is moving in the opposite direction compared to the price. So while the price is moving, the RSI is telling us in advance that we can expect a change in direction.
Positive divergence
A positive divergence is when the price trend has lower lows and lower highs, while the indicator does the opposite - higher highs and higher lows. The price continues to fall while the RSI indicator begins to rise.
Negative divergence
Negative divergence is the opposite of positive divergence. It applies to uptrends where the price reaches higher highs and higher lows. However, the RSI shows lower highs and lower lows - the price goes up but the RSI goes down. The price closes with higher highs and higher lows, while the indicator shows the opposite - lower lows and lower highs, confirming a negative divergence. As a result, there is a sharp decline in the price.
Have fun using and trying out this flexible indicator!

KINSKI RSI/RSX DivergenceThe Relative Strength Index (RSI) is a momentum indicator that measures the magnitude of recent price changes to analyse overbought or oversold conditions. RSI values range from 0 to 100.
The Relative Strength Index (RSI) is calculated using the following formula: RSI = 100 - 100 / (1 + RS) Where RS = average gain of upward phases during the specified time frame / average loss of downward phases during the specified time frame.
An asset price is considered overbought (due for a correction) if the RSI is above 70 and oversold (due for a recovery) if it is below 30. More extreme values (80/20) are also used to avoid false readings.
In a strong uptrend, the RSI often reaches 70 and above for long periods, and downtrends can remain at 30 or below for long periods.
Divergence detection in RSI is one of the important functions of this indicator. The reason is that an RSI divergence is a more reliable signal than the overbought and oversold indicators themselves. You will get overbought and oversold signals all the time. However, the divergence is a rare event.
In general, RSI divergence means that the RSI indicator is moving in the opposite direction compared to the price. So while the price is moving, the RSI is telling us in advance to expect a change in direction.
Positive RSI divergence
A positive RSI divergence is when the price trend has lower lows and lower highs, while the RSI indicator does the opposite - higher highs and higher lows. The price continues to fall while the RSI indicator begins to rise.
Negative RSI divergence
Negative RSI divergence is the opposite of positive divergence. It applies to uptrends where the price reaches higher highs and higher lows. However, the RSI shows lower highs and lower lows - the price goes up but the RSI goes down. The price closes with higher highs and higher lows, while the RSI indicator does the opposite - lower lows and lower highs, confirming a negative divergence. As a result, there is a sharp decline in the price.
RSX Indicator - Base script: SharkCIA by Jaggedsoft (Linked in the source code)
The RSX is the noise-free variant of the more popular RSI oscillator. Typically, any indicator can be smoothed by applying a moving average. However, a major disadvantage of such a method is that there is a time lag between the indicator and the price. RSX Indicator attempts to do this without signal delay.
What distinguishes this indicator from others of this type?
Display of RSI indicator together/alone with RSX and RSI smoothed
display of the RSI indicator (option: "RSI: On/Off")
display of the RSX indicator (option: "RSX: On/Off")
display of the RSI indicator as smoothed version (option: "RSI Smoothed: On/Off")
offers the possibility to choose between different view variants
many settings for additional information, layout and divergence identification
enables completely new comparison possibilities and insights with the additional RSI variants
Relative Volume Strength Index (MZ RVSI)INTRODUCTION
Volume always plays a role of key indication for price movements and momentum and I always found the same problem with all available volume oscillators and indicators which is that their data is always in compounded form that can’t be easily used in raw form as a parameter in many strategies.
This indicator uses raw volume data from one of following oscillators:
TFS Volume Oscillator
On Balance Volume
Klinger Volume Oscillator
Cumulative Volume Oscillator
Volume Zone Oscillator
Then this data goes through the following process of noise filtration:
Hull Moving Average of input data to reduce noise
Relative Strength Index of HMA
Hull Moving Average of RSI to reduce noise for finalized RVSI
ADDITIONAL FEATURES
Heiken-Ashi: Heiken-Ashi values are optional to use in calculations and I’ve set them to default as I found good results with them.
Slope for Trend Detection: Slope of finalized RVSI is calculated in order to check volume trend direction. Another additional feature of Volume breakouts is also added which is used in dynamic coloring of RVSI. Dynamic color indications are as follows.
Green Color:
Strong Volume Uptrend above volume breakout point
Fuchsia Color:
Weak Volume Uptrend below volume breakout point but slope supported
Red Color:
Strong Volume Downtrend below volume breakout point
Gray Color:
Weak Volume Downtrend above volume breakout point but slope supported
Yellow Color:
Possible trend reversal as slope is flat.
DEFAULTS SETTINGS
Volume length is 30 (Better for timeframes higher than 1H)
Hull Moving Average and RSI length is set to 14
ADDITIONAL APPLICATIONS
This indicator can be used as divergence detection tool for volume same way as RSI is used for price divergence. I’ll soon add divergence signals inside the code and this code can be used in multiple ways as volume breakout indication in strategies for better results.

RSI DINGUE - 3³ DivergenceThis is the updated version for PineScript V5
3x RSI indicator into 1. You can turn on or off all of them.
Each RSI has 2 individual Moving Averages that can also be changed to be "Full RSI" in the settings.
This makes 3x3 = 9 indicators on screen at the same time. (you can turn them on or off)
It has Bullish and Bearish divergence and hidden divergence as well.
Several visual options to show crosses between RSIs and or MAs fill in colors, background colors, midline. Overbought and Oversold levels with signals when entry and exit.
---------------------
In closing, no indicator can give perfect signals, you need to use them in conjunction with other information to make better decisions.
I hope you like my indicators and that they help your trading.
If you have any questions please ask.
Thank you.

MTF Wave Screener [Cryptoheat]The "MTF Wave Screener" is a screener built to be able to scan the market quickly and easily in a very efficient way based on the "MTF Wave Stochastic RSI " function.
therefore it is basically an MTF wave stochastic scanner to monitor a wide scope of charts and know which to look deeper into using the "MTF Wave Stochastic RSI" itself. therefore it is recommended to be used with the other indicator and is considered an additional tool for those who use and master the "MTF Wave Stochastic RSI " indicator. if you do not know how it works, make sure to check it out here and read its description, which is a vital part for this one:
knowing how it works, you should be able to understand what it means for the chart to be Overbought, Oversold or having a Fake-out (mini-wave) on the MTF Wave Stochastic RSI, as well as the meaning of the values of K1, K2, K3 and the gap between K1 and K2. if not, please check it out by visiting the link attached earlier.
This table screener basically writes all the MTF data in a table showing mainly the chart's status as an option of (Oversold, Overbought, Fakeup or Fakedown) as well as the K1, K2, K3, Gap, value change from last candle data of all requested charts. Therefore acting as a market scanner for people who want to save the time needed to scan the whole market manually.
For example:
as you can see the table is showing 'GALA:USDT' pair as being oversold and having k1,k2 and k3 values of 0,0 and 9.76 respectively, therefore if you go check on the MTF Wave Stochastic RSI indicator, you will see that the current pair has a green highlight indicating oversold. and having the K1,K2 and K3 values as indicated on the indicator.
same goes for any other MTF status. Another example is when it shows a FAKEDOWN . Experienced MTF Wave Stoch RSI users know that this means that the MTF curves are formed in a bullish way showing that there is a retrace towards oversold only on the lowest time frame stochastic K1 while the normal time frame stochastic is still overbought. if you check the screener table you will see for example that 'QNTUSDT' pair is showing a FAKEDOWN the gap between K1 and K2 can be seen in the K1 and K2 values as well as the column named Gap val . with it you can determine the strength of that Fakedown. the bigger the Gap Val the higher the Fakeout and the bigger the expected bounce is should it play out.
checking on the QNTUSDT MTF Wave Stoch RSI you will see a clear fakedown between k1 and k2 (gray and blue curves), indicating a possible bounce incoming soon.
Overbought and Fakeup, each mean the opposite of Oversold and Fakedown respectively.
in short all the values contained on that screener table help you picture each chart's individual MTF Wave Stoch RSI of their own without having to check each one by itself. this is a very useful tool for traders who need to scan the market for the MTF data of each coin...
The screener comes with several options. in settings you can change the parameters for overbought, oversold , Fakeup and Fakedown in the settings according to the k1, k2, k3 values and differences. The table is made to screen 33 charts at the same time. to allow you to store more charts it is made in a way that you can choose not only those 33 but also 4 other x 33 watchlists and select the ones you want among them giving you the option to make your own 165 chart's watchlist and save it.
You must know that however, in the event that any of those default charts gets is not valid anymore, for example if a coin gets delisted of an exchange or a stock gets delisted the table will not work until you manually change that pair, even if it is in the alternative watchlists. in that case you will receive a warning message and a black indicator. in that event, please check for the pair that has been delisted and change it to another working pair and save as default.
EMA Cross + Divergence strategy (Div. signals by The Divergent)A sample strategy demonstrating the usage of The Divergent divergence indicator and The Divergent Library .
The Divergent is an advanced divergence indicator which you can easily incorporate into your own strategies.
In order to use this strategy (and to use the signals in your own strategy), you need to have the Pro version of The Divergent applied to your chart.
For more information, please see the comments inlined in the code.
