Mean Reversion IndicatorThis is a mean reversion indicator that anticipates a local trend reversion. Basically, it is a channel with the mid-line serving as a moving mean baseline. Each of the two curves run up and down within this channel bouncing off from the top and bottom bounds. Touching the bounds serves as an indication of a local trend reversal. The reversal signal is stronger when there exists a resonance (symmetry) in the two curves. The background histogram shows a Karobein oscillator that contributes support or resistance for the signal.
Reversion

VIX reversion-Buschi
English:
A significant intraday reversion (commonly used: 3 points) on a high (over 20 points) S&P 500 Volatility Index (VIX) can be a sign of a market bottom, because there is the assumption that some of the "big guys" liquidated their options / insurances because the worst is over.
This indicator shows these reversions (3 points as default) when the VIX was over 20 points. The character "R" is then shown directly over the daily column, the VIX need not to be loaded explicitly.
Deutsch:
Eine deutliche Intraday-Umkehr (3 Punkte im Normalfall) bei einem hohen (über 20 Punkte) S&P 500 Volatility Index (VIX) kann ein Zeichen für eine Bodenbildung im Markt sein, weil möglicherweise einige "große Jungs" ihre Optionen / Versicherungen auflösen, weil das schlimmste vorbei ist.
Dieser Indikator zeigt diese Umkehr (Standardwert: 3 Punkte), wenn der VIX vorher über 20 Punkte lag. Der Buchstabe "R" wird dabei direkt über dem Tagesbalken angezeigt, wobei der VIX nicht explizit geladen werden muss.

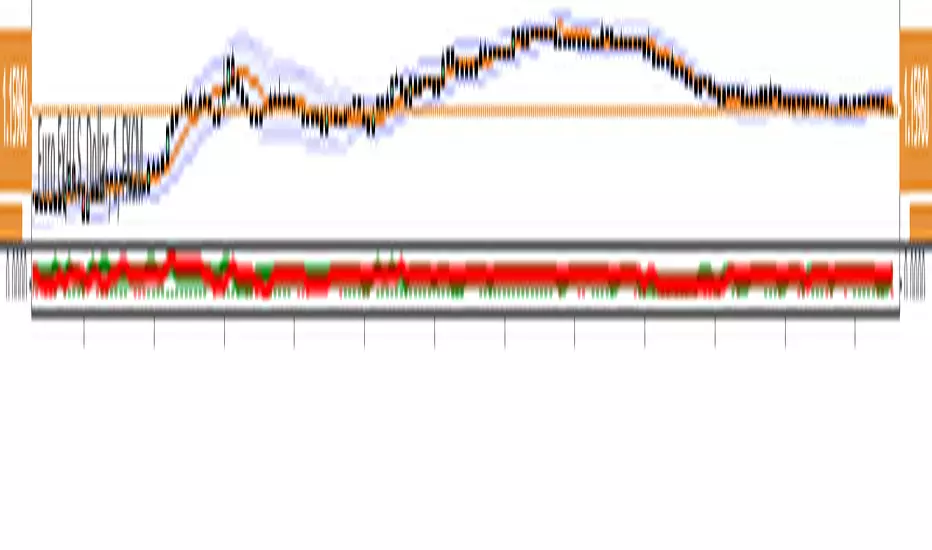
Mean Reversion and Momentum - Updated with gaussiana smoothingMean Reversion and Momentum
Interpretation:
- Divergence means trend reversal
- Parallel movement means trend continuation
Squares above serve as a confirming signal

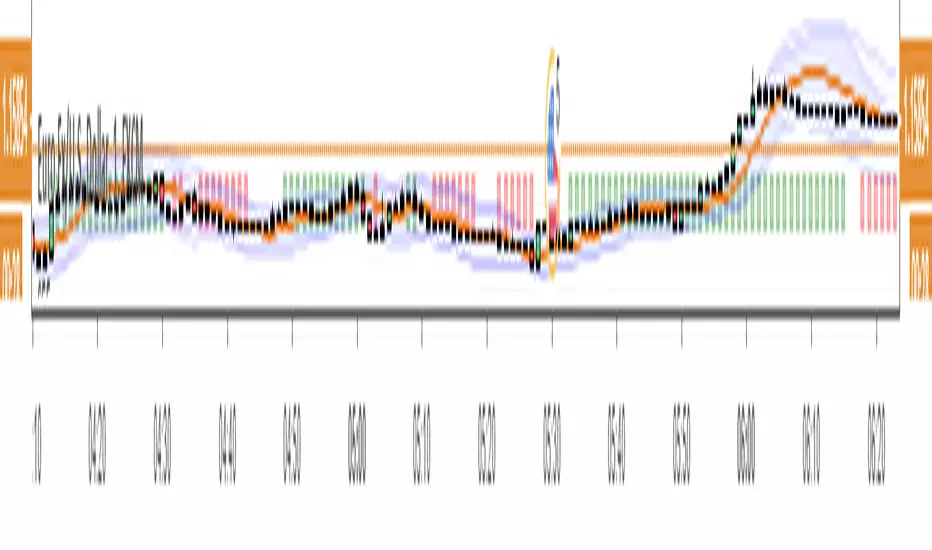
Mean Reversion and Momentum - Indicator versionMean Reversion and Momentum
Interpretation:
- Divergence means trend reversal
- Parallel movement means trend continuation
Squares above serve as a confirming signal
B3 ALMA PendulumB3 Pendulums, quick little indicators that do change print inside the current bar, so beware. It is good for anticipation, but it is important to make sure the current and next bars follow through.
Ever wanted an indicator that really points out the micro term action in the form of a pendulum swing? This my attempt to show the market ups and downs in the smallest amount of lag possible. This indicator is designed to bounce back and forth from 100 to -100 as it shows you the price's relationship to ALMA. Really its just a simple deviance from mean study made to amplify the quick ups and downs, and kind of the neatest on Heikin Ashi setups. It looks like Arabic language at first glance, lol.
This should be easy to template out to your own MA's. ~I hope you are enjoying the B3 scripts, that is now 9 open source shares and a couple protected ones. I still plan on a few more give-a-ways, as I prepare some of the algorithmic things I do for subscription. Feel free to comment about things you would like to see! ~B3

UCS_TTM - Reversion BandsOk, Here we go - Version 1 of TTM Reversion Band goes live.
Link to TTM Reversion Band - www.tradethemarkets.com
Link to TTM Reversion Band Guide - kb.simplertrading.com
John Carters Mastering the trade - www.amazon.com
For the amount of information this has, the price tag is not hefty.
John's RTM Chapter Synopsis - www.tradethemarkets.com
What did I modify?
1. Automated the Daily + and Intraday settings. So Switching to intraday will change the setting automatically.
2. Added text callouts for RTM condition
a. John Carter's Indicator
b. Slope Based (my addition).
Future Improvement Planned.
1. Will Convert this into a system based on John's Indicator from TS.
2. Custom Options for Slope and MA setting for Trade filter.
