Reverse
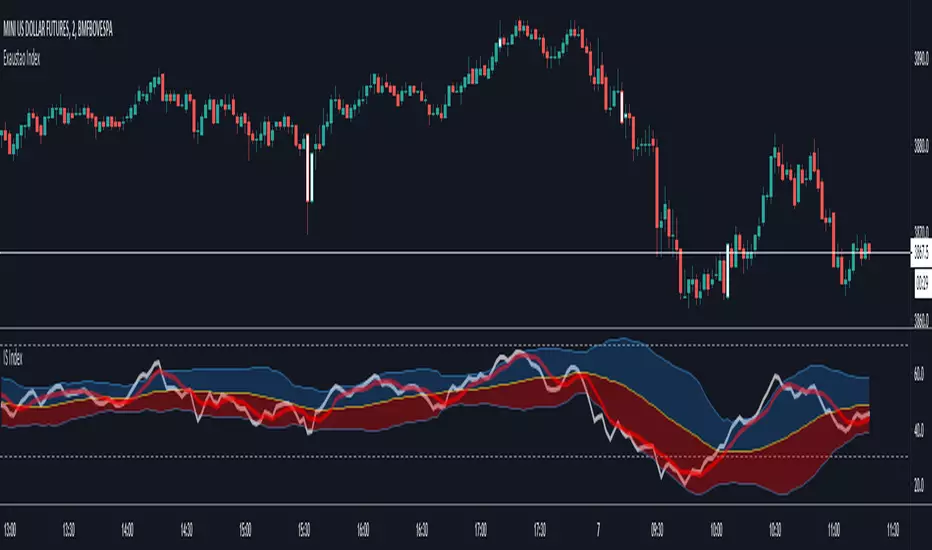
IS - Exaustao IndexIS - Indice de Exaustão
Este indicador está sendo publicado temporariamente. (Aproveitem para utilizar no Brasil usando o MiniDolar **Faz geralmente de 3 a 5ptos
O Objetivo é encontrar investidores;
Indicações de utilização:
B3 - Bolsa Brasileira;
Forex - Mercado Forex Descentralizado;
Melhores pares B3:
WDO
Melhores pares Forex:
AUDJPY
EURJPY
Tempo Grafico: 1 minuto (Ambos os mercados);
Indicações de Venda:
No M1, quando o ativo atingir as paredes, em exato na segunda parede, já ficar preparado para acionar uma venda. O melhor ponto de venda é quando ele se encontra na parede e o candle é colorido de amarelo.
Indicações de Compra:
Exatamente como a venda, realizar a venda quando houver o toque na segunda parede (indicado fazer parcial entre primeira e segunda parede), se o candle estiver entre as paredes e formar um triangulo abaixo do candle, habilita uma compra com stop curto.
Considerações:
Este indicador foi construído com base em muito estudo de volume, foram mais de 2 meses fazendo ele e testando incansavelmente.
Façam o backtest retroativo no grafico no M1 e percebam o quanto ele pode oferecer quando se forma um triangulo abaixo do candle ou um candle amarelo para a venda.
Ele funciona perfeitamente na B3 até as 11h 12h. Depois, como o mercado perde um pouco de liquidez ele nao tem o mesmo indice de eficiencia.
Não aceitar stops longos por se tratar do M1, se habilitar entrada e logo habilitar entrada no sentido contrario não pense duas vezes antes de sair da operação.
Aceite levar até 2 stops por dia com este indicador, se passar disso, o dia não está positivo para o indicador;
Stop:
Vai depender da relação de exposição a banca, geralmente para B3 (WDO) é indicado um stop de 3pts a 4ptos (Acima é força contraria e euforia)
Contato: 41 - 998964223 / 41 - 991154223 (Curitiba/Pr) - Brasil
"Escolha sempre estar ao lado de quem queira crescer e faça acontecer!!!"
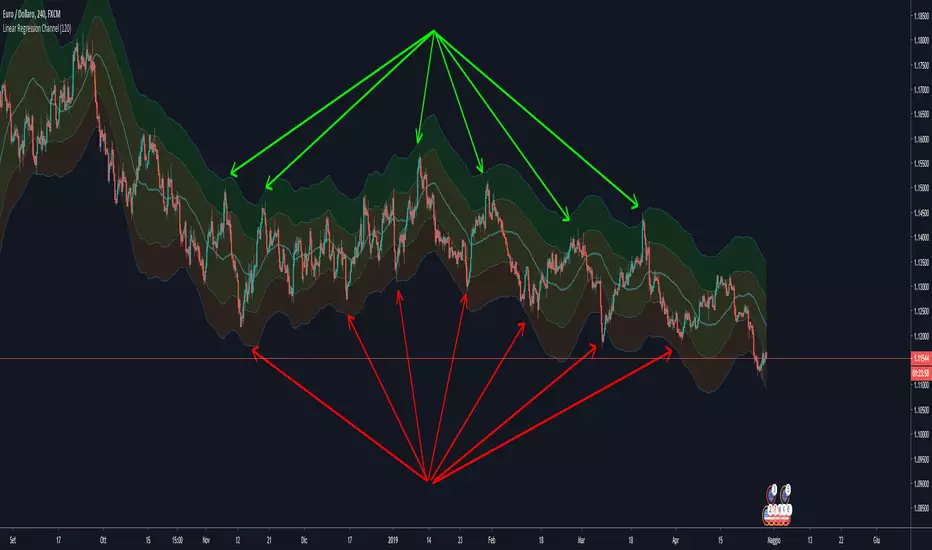
linear regression channelThe linear regression indicator is used for trend identification and trend following in a similar fashion to moving averages.
Best time frames to use the indicator: H1/H4
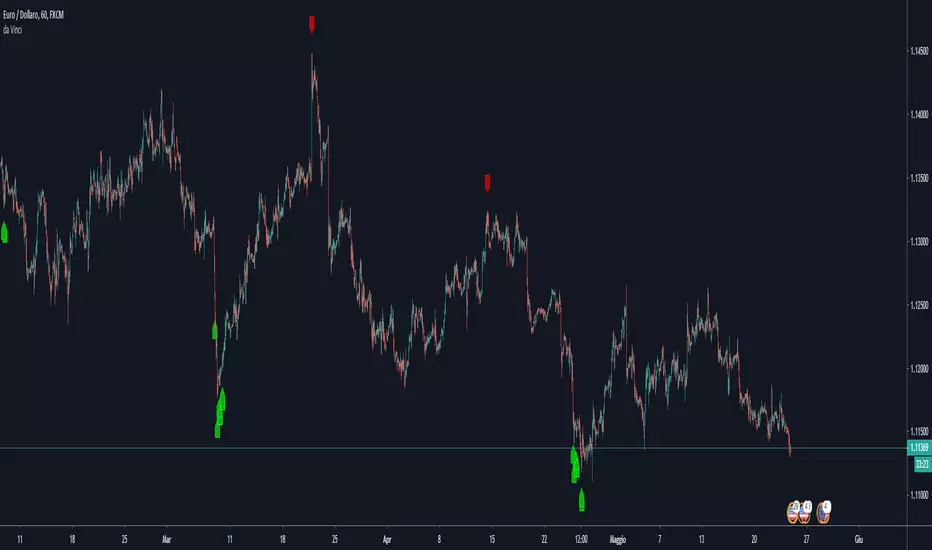
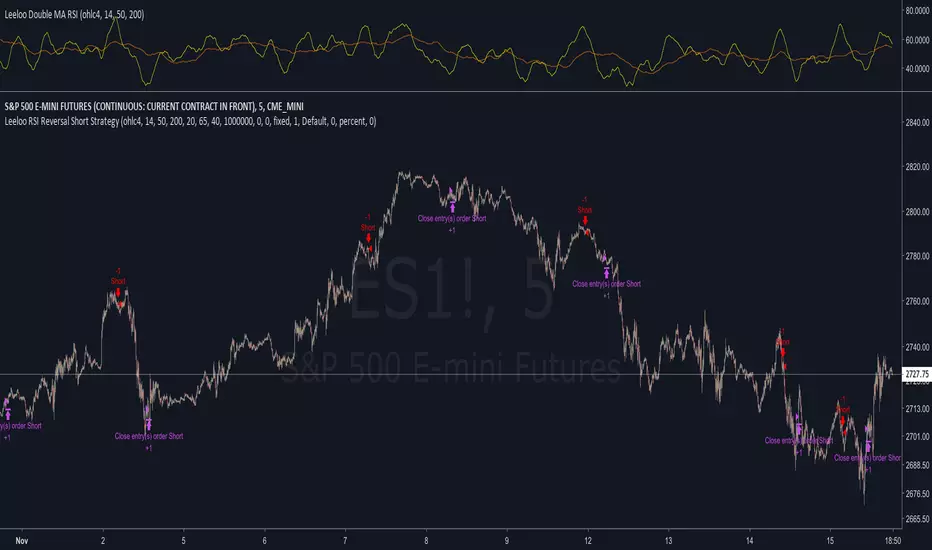
Leeloo RSI Reversal Short StrategyThis strategy is based on applying two moving averages to RSI and then opening a short position when the short-length average is above the slow-length average, has recently changed direction within the last n bars, and is in overbought territory.
Default settings work best on short intervals (5min)
Don't be afraid to use extended hours
Everything is based on last complete bar; once something shows up it is good to go
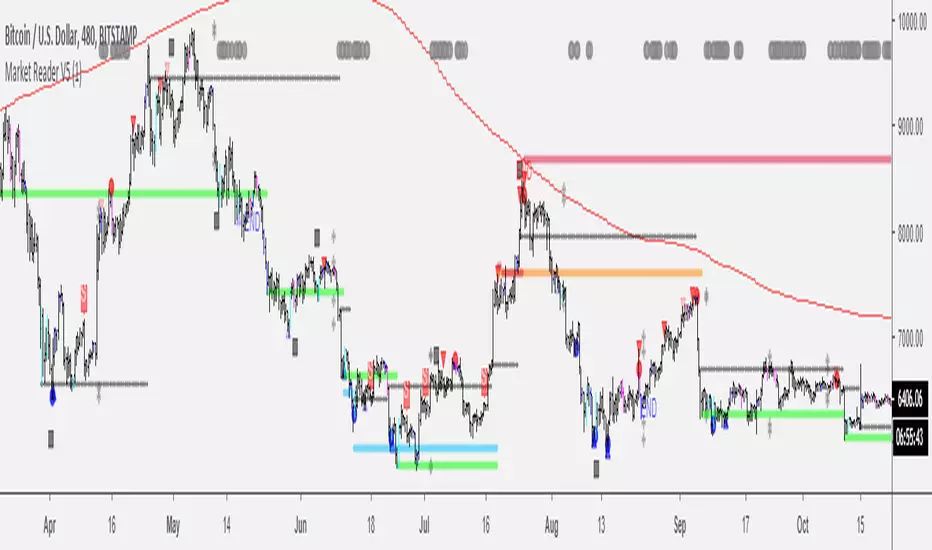
Market Reader [ENG]Market Reader is a very sophisticated indicator giving you:
-Pattern of take profit helping you to enter or exit your position
-Pattern of EXIT giving you the signal of market reversal (See on BTC)
-Key supports and resistances where the market will react
-Early detection of RANGE before the contact with the top or the bottom of the range, it will also give you the target of the top and the bottom of the range
-Pattern of institutional activities, giving you signal that smart money is moving at this level of price
You will also found my complete strategy on my youtube Channel (Market Reader)
Enjoy
1 month free trial 8ask on private message or in comment)
The 30 first subscriber will have a 50% discount
Trend-Reverse Strategy
Trend-Reverse Strategy is a combination of these 2 scripts to use 5 min candle.


Ehlers Reverse Exponential Moving AverageEhlers Reverse Exponential Moving Average script.
This indicator was originally developed by John F. Ehlers (Stocks & Commodities V. 35:10: The Reverse EMA Indicator).

reverse EMA Osc - John EhlersThis an universal oscillator with features such as minimum lag and a single-input parameter that lets it highlight cycle, momentum, and trend components.
It is based on reverse impulse response filter technique applied to EMA.
Color style borrowed from Awesome Oscillator, between one can notice a better lag response with this indicator.
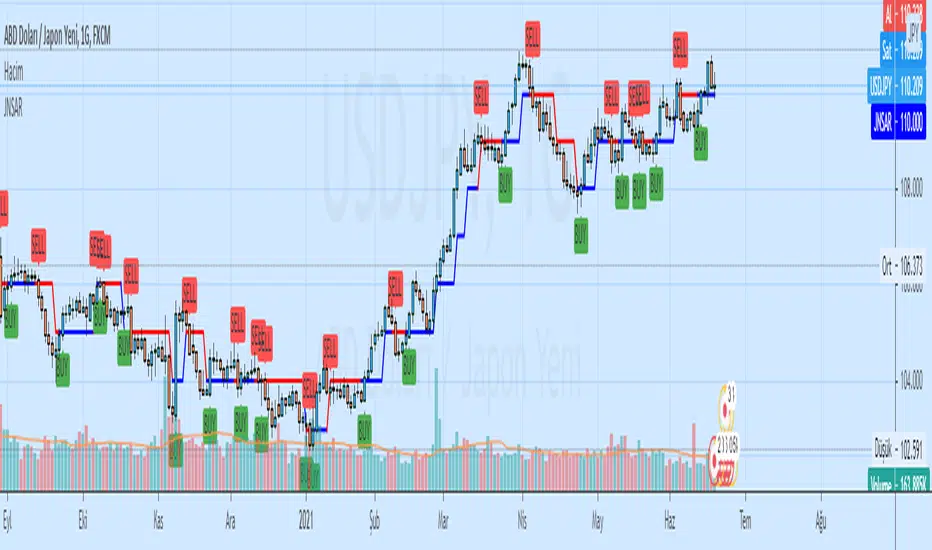
Parabolic GlitterThis indicator overlays a series of Parabolic Stop And Reverses (SARs) to continuously illustrate trends as they form in addition to a range of good possible levels at which to place stop orders.
The Initial Start argument gives the minimum value for the SAR function's "Start" argument. The Increment/Start Ratio argument gives the ratio of the SAR function's "Increment" and "Start" arguments (i.e. SAR default is Start = 0.02, Increment = 0.02, therefore Increment/Start Ratio = 1). The same logic applies to the Max/Start Ratio Argument (i.e. SAR default is Start = 0.02, Max = 0.2, therefore Max/Start Ratio = 10).
The Adaptive Coloring argument determines whether the plotting points are red in downtrends and green in uptrends, or if all the plotted points are given the same color (defaults to silver).

Reverse ParityShows the reverse graph of the forex pairs. Includes three exponential moving avarages. Option to show Bollinger bands.

Reverse Engineering RSI, by Giorgos SiligardosReverse Engineering RSI, by Giorgos Siligardos
The related article is copyrighted material from
Stocks & Commodities.
