Candle Reversal Matrix TFFCandle Reversal Matrix TFF
This "Engulfing + Shooting Star + Evening Star + Hanging Man + Dark Cloud Cover" indicator is a comprehensive candlestick pattern scanner designed to identify key bearish and bullish reversal signals on your TradingView charts.
Key Features:
Bullish Engulfing: Detects strong bullish reversals where a green candle fully engulfs the previous red candle, signaling potential upward momentum.
Bearish Engulfing: Flags bearish reversals where a red candle engulfs the prior green candle, indicating possible downtrend beginnings.
Shooting Star: Identifies candles with a small body near the low and a long upper wick, commonly marking a bearish reversal after an uptrend.
Evening Star: Detects a three-candle bearish reversal pattern characterized by a large green candle, followed by a small indecisive candle, and a strong red candle closing well into the first candle’s body.
Hanging Man: Spots small-bodied candles with long lower shadows after an uptrend, warning of potential bearish reversals.
Dark Cloud Cover: Recognizes a two-candle bearish reversal where a red candle gaps above and closes below the midpoint of the previous green candle.
Visual Cues:
Each pattern is marked on the chart with distinct colored shapes and labels for easy identification:
Green arrows and labels for bullish signals
Red, orange, purple, yellow, and maroon shapes for bearish patterns, each with unique symbols (↓, ☆, EV, HM, DC)
Reversal

Relative Wave: Volatility IncludedFor the setup shown, it is best used with the following scripts I have written:
1. Indicator: Volatility Candle Based
2. Multi-Period Charts (use 2 of them): @ 30m and 1H settings
3. Relative Wave: Volatility Included.
Indicator Description: Relative Wave: Volatility Included (RW: Vol)
Pine Script v6 – Technical Overview
🔍 Purpose
The Relative Wave: Volatility Included (RW: Vol) is a custom oscillator designed to measure price position relative to dynamic upper and lower bounds that are influenced by volatility. It incorporates trend filtering, momentum smoothing, and zone detection, providing a composite view of price waves and potential reversal signals.
🧠 How It Works
1. Core Concept: Relative Position within Volatility Bands
The indicator calculates a Relative Wave Index, which measures where the current price sits between recent upper and lower bands derived from standard deviation. These bounds are sorted over a historical window to filter for sensitivity.
2. Sensitivity & Smoothing
Trend Length (Historical_Bar_Count): Defines how many bars are used to build the volatility-adjusted trend range.
Sensitivity Control: Adjusts how reactive the index is to recent price changes.
EMA Smoothing: Custom exponential moving averages are used to smooth values for fast, slow, and overall momentum.
3. Components & Visuals
RW Short-Term Fast Line: Plotted as colored circles indicating quick changes in trend.
RW Short-Term Slow Line: A smoother trend line for signal filtering.
RW Overall Momentum Line: Step-style line measuring broader directional trend.
RW Wave Line: A smoothed average of recent crests and troughs, acting as a cyclical midline reference.
Zone Lines (5/20/50/80/95): Visual thresholds often used as overbought/oversold regions.
⚙️ Key Inputs & Their Effects
Trend Length: Longer = smoother but laggy trends; shorter = more responsive but volatile.
Sensitivity: Higher values = less sensitivity; lower = more reactive.
Signal Lengths (Fast/Slow/Overall): Control the degree of smoothing for each plotted line.
Crest/Trough Lookback: Determines how crests and troughs are calculated from past wave behavior.
✅ Trade Signal Logic
The script defines bullish and bearish conditions based on the interaction of:
RW Wave direction
Overall Momentum direction
Slow Line behavior
Relative positioning (e.g., below or above 50)
Bullish Example:
RW Wave and Momentum are both rising
Values are below 50 (potential upside room)
Slow Line may be falling or just crossed upward
Bearish Example:
RW Wave and Momentum are falling
Values are above 50 (potential downside room)
Slow Line rising or crossed downward
🎨 Visual Aids & Colors
Green: Bullish momentum
Red: Bearish momentum
Blue/Purple Circles: Transition points and fast line status
White/Midrange Lines: Reference zones (like RSI levels)
📈 Best Use Cases
Identifying shifts in market direction before price breakout
Confirming trend strength using wave/momentum alignment
Spotting oversold/overbought zones with volatility context
Combining with other indicators (e.g., price action or volume)
How the Relative Wave Indicator, Volatility-Based Candle Signals, and Multi-Time Period Charts Work Together
This strategy combines three core components—Relative Wave, Volatility Candle Signals, and Multi-Time Period Analysis—to build a layered, high-probability trading framework.
🔷 1. Relative Wave Indicator (used on 3-minute chart)
The Relative Wave Indicator is a momentum and volatility-based oscillator that tracks price movement within a defined range using historical highs and lows derived from standard deviation bands. It smooths price action using fast and slow custom EMAs to identify underlying trend strength and reversals.
Key Features:
Tracks short-term wave structure
Detects momentum shifts based on rising/falling conditions
Uses color-coded momentum signals to help spot turning points early
The wave line and overall momentum line help confirm the quality of trend setups
🔶 2. Volatility Candle-Based Indicator (used on 3-minute chart)
The Volatility Candle Signal highlights significant price action based on expanding or contracting volatility. This tool helps identify moments of potential breakout or reversal by evaluating candle size, wick structure, and deviation from recent ranges.
Key Purpose:
Pinpoints actionable moments when volatility is entering or exiting the market
Works in tandem with Relative Wave to validate whether a momentum shift is strong enough to act on
🕰 3. Multi-Time Period Chart Confirmation (30-minute & 2-hour)
To avoid false signals and ensure alignment with broader market context, two higher timeframes (30m and 2h) are used as confirmation filters.
How They Integrate:
The 30-minute chart provides mid-range trend direction—ideal for intraday bias
The 2-hour chart offers broader trend context and helps avoid trading against dominant macro trends
These are used as overlays or separate indicators that mirror Relative Wave or other trend-detection tools to show whether the short-term setup aligns with bigger picture momentum
✅ Optimal Setup
Execution Timeframe: 3-minute chart
Confirmation Timeframes: 30-minute and 2-hour charts
Ideal Conditions for Trade Entry:
Relative Wave shows bullish/bearish alignment (e.g., wave and momentum lines rising with value <50 for bulls, >50 for bears)
Volatility candles indicate a breakout or reversal
Both the 30m and 2h multi-timeframe indicators confirm the trend direction or support a momentum shift
This integrated approach minimizes noise and increases confidence in each trade setup by ensuring that short-term signals are supported by volatility behavior and broader market context.

Enhanced Stock Ticker with 50MA vs 200MADescription
The Enhanced Stock Ticker with 50MA vs 200MA is a versatile Pine Script indicator designed to visualize the relative position of a stock's price within its short-term and long-term price ranges, providing actionable bullish and bearish signals. By calculating normalized indices based on user-defined lookback periods (defaulting to 50 and 200 bars), this indicator helps traders identify potential reversals or trend continuations. It offers the flexibility to plot signals either on the main price chart or in a separate lower pane, leveraging Pine Script v6's force_overlay functionality for seamless integration. The indicator also includes a customizable ticker table, visual fills, and alert conditions for automated trading setups.
Key Features
Dual Lookback Indices: Computes short-term (default: 50 bars) and long-term (default: 200 bars) indices, normalizing the closing price relative to the high/low range over the specified periods.
Flexible Signal Plotting: Users can toggle between plotting crossover signals (triangles) on the main price chart (location.abovebar/belowbar) or in the lower pane (location.top/bottom) using the Plot Signals on Main Chart option.
Crossover Signals: Generates bullish (Golden Cross) and bearish (Death Cross) signals when the short or long index crosses above 5 or below 95, respectively.
Visual Enhancements:
Plots short-term (blue) and long-term (white) indices in a separate pane with customizable lookback periods.
Includes horizontal reference lines at 0, 20, 50, 80, and 100, with green and red fills to highlight overbought/oversold zones.
Dynamic fill between indices (green when short > long, red when long > short) for quick trend visualization.
Displays a ticker and legend table in the top-right corner, showing the symbol and lookback periods.
Alert Conditions: Supports alerts for bullish and bearish crossovers on both short and long indices, enabling integration with TradingView's alert system.
Technical Innovation: Utilizes Pine Script v6's force_overlay parameter to plot signals on the main chart from a non-overlay indicator, combining the benefits of a separate pane and chart-based signals in a single script.
Technical Details
Calculation Logic:
Uses confirmed bars (barstate.isconfirmed) to calculate indices, ensuring reliability by avoiding real-time bar fluctuations.
Short-term index: (close - lowest(low, lookback_short)) / (highest(high, lookback_short) - lowest(low, lookback_short)) * 100
Long-term index: (close - lowest(low, lookback_long)) / (highest(high, lookback_long) - lowest(low, lookback_long)) * 100
Signals are triggered using ta.crossover() and ta.crossunder() for indices crossing 5 (bullish) and 95 (bearish).
Signal Plotting:
Main chart signals use force_overlay=true with location.abovebar/belowbar for precise alignment with price bars.
Lower pane signals use location.top/bottom for visibility within the indicator pane.
Plotting is controlled by boolean conditions (e.g., bullishLong and plot_on_chart) to ensure compliance with Pine Script's global scope requirements.
Performance Considerations: Optimized for efficiency by calculating indices only on confirmed bars and using lightweight plotting functions.
How to Use
Add to Chart:
Copy the script into TradingView's Pine Editor and add it to your chart.
Configure Settings:
Short Lookback Period: Adjust the short-term lookback (default: 50 bars) to match your trading style (e.g., 20 for shorter-term analysis).
Long Lookback Period: Adjust the long-term lookback (default: 200 bars) for broader market context.
Plot Signals on Main Chart: Check this box to display signals on the price chart; uncheck to show signals in the lower pane.
Interpret Signals:
Golden Cross (Bullish): Green (long) or blue (short) triangles indicate the index crossing above 5, suggesting a potential buying opportunity.
Death Cross (Bearish): Red (long) or white (short) triangles indicate the index crossing below 95, signaling a potential selling opportunity.
Set Alerts:
Use TradingView's alert system to create notifications for the four alert conditions: Long Index Valley, Long Index Peak, Short Index Valley, and Short Index Peak.
Customize Visuals:
The ticker table displays the symbol and lookback periods in the top-right corner.
Adjust colors and styles via TradingView's settings if desired.
Example Use Cases
Swing Trading: Use the short-term index (e.g., 50 bars) to identify short-term reversals within a broader trend defined by the long-term index.
Trend Confirmation: Monitor the fill between indices to confirm whether the short-term trend aligns with the long-term trend.
Automated Trading: Leverage alert conditions to integrate with bots or manual trading strategies.
Notes
Testing: Always backtest the indicator on your chosen market and timeframe to validate its effectiveness.
Optional Histogram: The script includes a commented-out histogram for the index difference (index_short - index_long). Uncomment the plot(index_diff, ...) line to enable it.
Compatibility: Built for Pine Script v6 and tested on TradingView as of May 27, 2025.
Acknowledgments
This indicator was inspired by the need for a flexible tool that combines lower-pane analysis with main chart signals, made possible by Pine Script's force_overlay feature. Share your feedback or suggestions in the comments below, and happy trading!

Volume Flow OscillatorVolume Flow Oscillator
Overview
The Volume Flow Oscillator is an advanced technical analysis tool that measures buying and selling pressure by combining price direction with volume. Unlike traditional volume indicators, this oscillator reveals the force behind price movements, helping traders identify strong trends, potential reversals, and divergences between price and volume.
Reading the Indicator
The oscillator displays seven colored bands that fluctuate around a zero line:
Three bands above zero (yellow) indicate increasing levels of buying pressure
Three bands below zero (red) indicate increasing levels of selling pressure
The central band represents the baseline volume flow
Color intensity changes based on whether values are positive or negative
Trading Signals
The Volume Flow Oscillator provides several valuable trading signals:
Zero-line crossovers: When multiple bands cross from negative to positive, potential bullish shift; opposite for bearish
Divergences: When price makes new highs/lows but oscillator bands fail to confirm, signals potential reversal
Volume climax: Extreme readings where outer bands stretch far from zero often precede reversals
Trend confirmation: Strong expansion of bands in direction of price movement confirms genuine momentum
Support/resistance: During trends, bands may remain largely on one side of zero, showing continued directional pressure
Customization
Adjust these key parameters to optimize the oscillator for your trading style:
Lookback Length: Controls overall sensitivity (shorter = more responsive, longer = smoother)
Multipliers: Adjust sensitivity spread between bands for different market conditions
ALMA Settings: Fine-tune how the indicator weights recent versus historical data
VWMA Toggle: Enable for additional smoothing in volatile markets
Best Practices
For optimal results, use this oscillator in conjunction with price action and other confirmation indicators. The multi-band approach helps distinguish between minor fluctuations and significant volume events that might signal important market turns.

StockLeave Signal BarThe indicator identifies potential trade entries by highlighting expansion and reversal bars. These are defined by individual bar characteristics and refined by contextual factors such as price position relative to structural boundaries. The purpose is to locate bars that could indicate potential market initiation.
Expansion Bars
The expansion captures bars that breakout from a period of reduced volatility. These often initiate directional movement and are recognized using a two-part definition:
Range Expansion The current bar’s range must exceed the average range. This ensures the move is comparatively large and stands out from recent behavior.
Range Compression The bars before the expansion must be below a threshold of the average range. This confirms a low-volatility lead-up, strengthening the likelihood that the expansion has significance.
This script applies additional filters. A local breakout ensures price breaks the previous bar’s high or low. A strong close confirms directional intent by requiring the close near the bar’s extreme. Mean proximity checks that expansion starts near the mean price using a dynamic buffer relative to bar size. A directional filter blocks signals during extended directional runs. Consecutive suppression prevents multiple expansions to show in succession.
Reversal Bars
Reversal setups aim to identify potential turning points after price has reached a zone of imbalance or extension. These bars typically exhibit long tails and occur near structural boundaries such as the outer Keltner bands. Their design favors short-term price rejection and potential reversal.
Tail Dominance The wick must be at least twice the body and make up a significant portion of the bar’s total range, signaling strong rejection rather than indecision.
Close Location The close should be near the opposite end of the wick, near the low for bearish signals and near the high for bullish, confirming pressure in the reversal direction.
This script applies additional filters. Local extreme ensures the bar marks a local turning point to confirm reversals occur after extension, not within structure. Boundary proximity requires the bar to appear near the outer envelope, aligning bearish signals with the upper band and bullish with the lower, indicating price has reached an area of likely imbalance.
This section also incorporate snapback reversals, designed to capture failed extensions beyond structural boundaries. Unlike single-bar rejections, snapbacks use a two-bar sequence: a strong impulse bar that closes outside the envelope, followed by a reversal bar that closes back inside.
Alert Configuration
The Signal Bars indicator includes an alert function with two built-in conditions to help reduce screen time and focus attention when predefined conditions are met.
Expansion: Alerts when a bar meets all conditions for a valid expansion.
Reversal: Alerts when a bar meets the criteria for a pin bar or snapback reversal.
These are built into the indicator with the alertcondition() function and can be turned on whenever the indicator is applied to a chart. Each alert includes a default message that uses dynamic placeholders; {{ticker}} for the symbol and {{interval}} for the timeframe.
Create a new alert and select the condition “StockLeave Signal Bars.”
Then select from the two options: Expansion and Reversal.
For expansions, select “once per bar” to capture developing momentum.
For reversals, use “once per bar close” to confirm rejection setups.
Apply alerts across multiple timeframes to improve coverage. Lower timeframes are better suited for fast-moving markets, while higher timeframes work well in slower or more selective environments. This process only needs to be done once. The created alerts can then be toggled on or off from the Alerts panel as preferred, without requiring reconfiguration.
Applied Discretion
The indicator functions on fixed logic, but interpretation always takes precedence. Consider price action, structure, volatility, and broader market context. Most signals will not lead to trades; while many may appear in a session, only a select few will align with context and warrant execution based on discretion.

Levels by Touches (v2) [chingybrooks]Levels by Touches (v2)
This script scans the last N bars to identify significant support and resistance levels by counting wick-touches.
How it works:
1. Wick detection – marks a touch whenever upper or lower wick ≥ X% of candle body (or on doji)
2. Level grouping – merges touches within a tolerance of Y ticks
3. Touch weighting – recent touches (in the latter half of lookback) count Z× more
4. Filtering – only plots levels with ≥ M total touches
Inputs:
Bars to scan (N): lookback period (max 200 bars)
Min touches (M): minimum hits to qualify as a level
Tolerance (ticks): price “slop” for grouping nearby touches
Min wick %: wick size threshold as % of body
Recent touch weight (Z): multiplier for touches in the latest half
Use this indicator to spot high-probability S/R zones based on actual price rejections.

Savitzky Flow Bands [ChartPrime]An advanced trend-following tool that applies the Savitzky-Golay smoothing algorithm to price and dynamically adapts trend bands to visualize directional bias and trend strength.
savitzky_golay_filter_w_15_vectors(source) =>
float sum = 0.0
float polynomial = 0.0
float coefficients = array.new(16)
// Predefined 15 coefficients
for i = -4 to 4
coefficients.set(i + 4, i) // from -4 to 5
if i == 4
for j = 5 to -4
for g = 8 to 15
coefficients.set(g, j) // from 5 to -4
// Calculate normalization factor as the sum of absolute values of coefficients
float norm_factor = coefficients.sum()
// Loop through coefficients and calculate the weighted sum
for i = 0 to coefficients.size()-1
sum := sum + coefficients.get(i) * source
// Calculate the smoothed value
for i = 1 to length-1
polynomial := math.sum(sum / norm_factor, i) / i
polynomial
⯁ KEY FEATURES & HOW TO USE
Savitzky-Golay Filtered Line (Basis):
Smooths out price noise using the Savitzky-Golay method, offering a more refined trend path than traditional moving averages. This centerline acts as the trend anchor and visually changes color depending on its slope to reflect the active trend direction.
Dynamic Trend Bands (Upper/Lower):
Constructed from the filtered line with a dynamic offset based on recent price volatility (ATR). These bands shift based on price pressure and are locked once price closes beyond them.
Helpful for identifying breakout moments or exhaustion areas where reversals are likely.
Trend Direction Detection:
A directional signal is confirmed when price breaks and closes above the upper band (uptrend) or below the lower band (downtrend).
Provides a clear and systematic way to identify when a trend begins.
Trend Duration Counter (Visual Decay Line):
A fading overlay line shows how long a trend has been active since the last reversal. The longer the trend persists, the more transparent this extension becomes.
This visual fading effect helps traders anticipate potential trend exhaustion and prepare for reversals or take-profit zones.
Reversal Signals (Diamond Markers):
Diamond shapes are plotted at each market shift, allowing users to visually pinpoint when the trend has flipped.
These markers act as decision zones for entry, exit, or stop-loss adjustments based on directional flow changes.
Color-Based Bar and Candle Painting:
Candles are painted green in uptrends and orange in downtrends, providing an intuitive glance at trend state without needing to interpret numbers.
Helps users stay aligned with the trend visually and avoid counter-trend entries.
⯁ CONCLUSION
The Savitzky Flow Bands indicator offers a modernized, visually rich way to track trend shifts using a scientific smoothing method. With dynamic trend envelopes, color-coded cues, and visual markers, it equips traders with a structured framework to follow the market's flow and make data-driven decisions. Ideal for swing traders, momentum strategists, or any trader looking to trade in sync with the prevailing trend.

Hybrid Momentum Suite [QuantAlgo]The Hybrid Momentum Suite is an advanced momentum-based technical indicator that utilizes a weighted fusion of RSI and CCI, combined with adaptive boundary detection to help traders and investors identify momentum strength and potential reversal zones across different timeframes and asset classes.
🟢 Technical Foundation
The Hybrid Momentum Suite employs a dual-component approach to momentum analysis, incorporating:
Hybrid RSI-CCI Calculation: Uses a customizable ratio for momentum signature creation, allowing traders and investors to balance the characteristics of both indicators
Bi-Directional Component Separation: Automatically separates unified momentum into distinct bullish and bearish forces for independent analysis
Adaptive Impulse Boundary: Uses exponential moving average combined with standard deviation multipliers to detect momentum exhaustion zones
Multi-Level Gradient Visualization: Applies sophisticated layering with varying transparency to show momentum strength and direction changes
The indicator processes price data through multiple filtering stages, applying mathematical principles including weighted averaging, component isolation, and statistical variance analysis. This creates a momentum system that adapts to market volatility while maintaining clarity in directional bias and strength quantification.
🟢 Key Features & Signals
1. Bi-Directional Component Separation
The indicator presents momentum through mathematically isolated histograms that separate bullish and bearish forces for independent analysis.
When bullish momentum is dominant, the bullish component (green) shows greater amplitude than the bearish component.
Similarly, when bearish momentum is dominant, the bearish component (red) shows greater amplitude than the bullish component.
During transitional periods, components may show equal strength, indicating momentum equilibrium.
This visualization provides immediate insights into:
→ Competing market forces simultaneously
→ Momentum exhaustion before reversals
→ Quantified momentum strength across different timeframes
2. Real-Time Status Update
The indicator features a comprehensive analysis dashboard that operates with dynamic strength classification:
The dashboard automatically categorizes momentum from "Very Weak" to "Very Strong" based on component amplitude.
Historical comparison displays previous bar metrics for trend analysis, helping traders and investors understand momentum persistence.
Color-coded visualization matches histogram components for immediate recognition of market bias.
Adaptive positioning offers nine customizable table locations for optimal display across different chart layouts.
Regardless of position, the dashboard displays:
Current momentum direction (BULLISH or BEARISH)
Momentum strength percentage (0-100%)
Previous bar comparison for trend persistence
Active component colors for visual consistency
This comprehensive approach helps traders and investors:
→ Assess current momentum strength quantitatively
→ Identify momentum shifts through historical comparison
→ Make informed decisions based on momentum context
3. Reversal Signal Detection System
The indicator generates trading signals using advanced multi-factor validation:
Exhaustion signals are detected when components cross down after exceeding statistical boundaries, indicating potential momentum reversals.
Trend flip alerts are generated when component dominance changes (bull>bear or bear>bull), signaling directional shifts.
Boundary interaction monitoring tracks crossovers above/below impulse threshold for extreme momentum identification.
Visual markers ( X ) are positioned using mathematical placement algorithms for clear signal identification.
The indicator also features a comprehensive alert system with notifications for:
Bullish potential reversals
Bearish potential reversals
Trend flip signals
Momentum boundary crossings
*Alerts can be customized and delivered through TradingView's notification system, making it easy to stay informed of important momentum developments even when away from the charts.
4. Conditional Bar Coloring
The indicator provides optional price bar coloring based on momentum analysis:
Bars are colored based on dominant momentum component (bullish/bearish).
Reversal conditions are highlighted with specialized coloring (default orange).
Color transparency adjusts based on momentum strength for immediate visual feedback.
Bar coloring can be toggled on/off to suit different chart aesthetics and personal preferences.
🟢 Practical Usage Tips
→ Component Analysis and Interpretation: The indicator visualizes momentum direction and strength through separate components, allowing traders to immediately identify dominant market forces. This helps in assessing potential for continuation or reversal.
→ Signal Generation Strategies: The indicator generates potential trading signals based on component crossovers, boundary violations, and momentum exhaustion. Users can focus on reversal signals at statistical extremes or trend-following signals during component dominance.
→ Multi-Component Assessment: Through its bi-directional approach, the indicator enables users to understand competing forces within the same timeframe. This helps in identifying momentum equilibrium and potential turning points.
🟢 Pro Tips
Adjust RSI/CCI ratio based on market conditions:
→ High ratios (70-100) for mean-reverting markets and longer timeframes
→ Low ratios (0-30) for trending markets and shorter timeframes
→ Default 50/50 for balanced momentum assessment across market types
Fine-tune impulse boundary based on volatility:
→ Lower boundary lengths (20-30) for more frequent reversal signals
→ Higher lengths (40-60) for only major momentum extremes
→ Adjust standard deviation multiplier (2.0-4.0) based on market volatility
Look for confluence between components:
→ Component divergence as early reversal warning
→ Simultaneous extreme readings for high-probability setups
→ Component correlation with price for confirmation
Use for multiple trading approaches:
→ Reversal trading at component extremes near impulse boundary
→ Trend following when components show clear dominance
→ Early momentum shift detection with gradient fading patterns
→ Position sizing based on component strength percentage
Combine with:
→ Support/resistance analysis for strategic entry and exit points
→ Volume indicators for momentum validation
→ Multiple timeframe analysis for broader market context
→ Price action patterns for confirmation of reversal signals

RunRox - Entry Model🎯 RunRox Entry Model is an all-in-one reversal-pattern indicator engineered to help traders accurately identify key price-reversal points on their charts. It will be part of our premium indicator package and improve the effectiveness of your trading strategies.
The primary concept of this indicator is liquidity analysis, making it ideal for Smart Money traders and for trading within market structure. At the same time, the indicator is universal and can be integrated into any strategy. Below, I will outline the full concept of the indicator and its settings so you can better understand how it works.
🧬 CONCEPT
In the screenshot below, I’ll schematically illustrate the core idea of this indicator. It’s one of the patterns that the indicator automatically detects on the chart using a two-timeframe approach. We use the higher timeframe to identify liquidity zones, and the lower timeframe to capture liquidity removal and structure breaks. The schematic is shown in the screenshot below.
Our indicator includes three entry models in total , and I will discuss its functionality and features in more detail later in this post.
💡 FEATURES
Three entry models
PO3 HTF Bar
Entry Area
Optimization for each Entry Area
Filters
HTF FVG
Alert customization
Next, we will examine each entry model in detail.
🟠 ENTRY MODEL 1
The first model is the core one we’ll work with; all other models rely on its structure and construction. In the screenshot below, I’ll schematically show the complete model.
As shown in the screenshot above, we display higher-timeframe candles on the current chart to better visualize the entry model and keep the trader informed of what’s happening on the larger timeframe. The screenshot also highlights both the Long and Short models, as well as the Entry Area, which I will explain in more detail below.
The schematic model on the lower timeframe is shown in the screenshot above. It illustrates that after the Entry Model forms, we draw the Entry Area on the next candle and wait for a price pullback into this zone for the optimal trade entry. Statistically, before moving higher, the price typically revisits the Entry Area, covering the imbalances created by MSS; thus, the Entry Area represents the ideal entry point.
🟩 Entry Area
Once the Entry Model has formed, we focus on identifying the optimal pullback zone for taking a position. To determine which retracement area performs best, we conducted extensive historical backtesting on potential zones and selected those that consistently delivered the strongest results. This process yields Entry Areas with the highest probability of a successful reversal.
On the screenshot above, you can see an example of the Entry Area and which zones carry a higher versus lower probability of reversal. Zones rendered with greater transparency have historically delivered weaker results than the more opaque zones. The deeper-colored areas represent the optimal entry zones and can improve your risk-reward ratio by allowing you to enter at more favorable prices.
It’s important to remember that the entire Entry Area functions as a potential zone for scaling into a position. However, if your risk-to-reward ratio isn’t favorable, you can wait for the price to retrace to lower levels within the Entry Area and enter with a more attractive risk-to-reward.
🟢 Pattern Rating
Each entry model receives a rating in the form of green circles next to its name 🟢. The rating ranges from one to four circles, based on the historical performance of similar patterns. To calculate this rating, we backtest past data by analyzing candle behavior during the model’s formation and assign circles according to how similar patterns performed historically.
Example Ratings:
🟢 – One circle
🟢🟢 – Two circles
🟢🟢🟢 – Three circles
🟢🟢🟢🟢 – Four circles
The more green circles a model has, the more reliable it is—but it’s crucial to rely on your own analysis when identifying strong reversal points on the chart. This rating reflects the model’s historical performance and does not guarantee future results, so keep that in mind!
Below is a screenshot showing four model variations with different ratings on the chart.
⚠️ Unconfirmed Pattern
Entry Model 1 is designed so that, until the higher-timeframe candle closes, the pattern remains unconfirmed and is hidden on the chart. For traders who prefer to see setups as they form, there’s a dedicated feature that displays the unconfirmed pattern at the moment of its appearance - triggered by the Market Structure Shift - before the HTF candle closes. The screenshot below shows what the pattern looks like prior to confirmation.
‼️IMPORTANT: Until the pattern is confirmed and the higher-timeframe candle has closed, the model may disappear from the chart if price reverses and the HTF candle closes below the previous bar. Therefore, this mode is suitable only for experienced traders who want to see market moves in advance. Remember that the pattern can be removed from the chart, so we recommend waiting for the HTF candle to close before deciding to enter a trade.‼️
✂️ Filters
For the primary model, there are four filters designed to enhance entry points or exclude less-confirmed patterns. The filters available in the indicator are:
Bounce Filter
Market Shift Mode
Same Wave Filter
Only with Divergence
I will explain how each of these filters works below.
- Bounce Filter
The Bounce Filter identifies significant deviations of price from its mean and only displays the Entry Model once the asset’s price moves beyond the average level. The screenshot below illustrates how this appears on the chart.
The actual average-price calculation is more sophisticated than what’s shown in the screenshot, that image is just an illustrative example. When the price deviates significantly from the N-bar average, we start looking for the Entry Model. This approach works particularly well in range-bound markets without a clear trend, as it lets you trade strong deviations from the mean.
- Market Shift Mode
This filter works by detecting the initial impulse that triggered the liquidity sweep on the previous higher-timeframe candle, and then holding the Market Structure Shift level at that point after the sweep. If the filter is turned off, price may move higher following the liquidity removal, creating a new MSS level and potentially producing a false structure shift and entry signal on the formed model.
This filter helps you more accurately identify genuine shifts - but keep in mind that the model can still perform well without it, so choose the setting that best suits your trading style.
- Same Wave Filter
The Same Wave Filter removes entry models that form without a clear lower-timeframe structure when liquidity is swept from the previous higher-timeframe candle. In other words, if the prior HTF candle and the current one belong to the same impulse wave - without any retracements on the LTF - the model is filtered out.
Keep in mind that this filter may also exclude patterns that could have produced positive results, so whether to enable it depends on your trading system.
- Only with Divergence
The Only with Divergence filter detects divergence between the lows of successive candles and indicators like RSI. When the low that swept liquidity diverges from the previous candle’s low, the indicator displays a “DIV” label. Although RSI is cited as an example, our divergence calculation is more advanced. This filter highlights patterns where low divergence signals genuine liquidity manipulation and a likely aggressive price reversal.
🌀 Model Settings
Trade Direction: Choose whether to display models for Long or Short trades.
Fractal: Select between automatic fractal detection—which adapts the lower-timeframe (LTF) and higher-timeframe (HTF) candles—or Custom.
Custom Fractal: When Custom is selected, manually specify the LTF and HTF timeframes used to detect the patterns.
History Pattern Limit: Set the maximum number of patterns to display on the chart to keep it clean and uncluttered.
🎨 Model Style
You can flexibly customize the model’s appearance by choosing your preferred line thickness, color, and the other settings we discussed above.
🔵 ENTRY MODEL 2
This model appears under specific conditions when Model 1 cannot form. It’s a price-reversal model constructed according to different rules than the first model. The screenshot below shows how it looks on the chart.
This model forms less frequently than Model 1 but delivers equally strong performance and is displayed as a position-entry zone.
Like the Entry Area in Entry Model 1, this zone is calculated automatically and highlights the best entry levels: areas that showed the strongest historical results are rendered in a brighter shade.
🎨 Model Style
You can flexibly customize the style of Entry Model 2 - its color, opacity, visibility, and the average price of the previous candle.
🟢 ENTRY MODEL 3
Entry Model 3 is a continuation pattern that only forms after Entry Model 1 has completed and delivered the necessary price move to trigger Model 3.
Below is a schematic illustration of how Model 3 is intended to work.
🎨 Model Style
As with the previous models, you can flexibly customize the style of this zone.
⬆️ HTF CANDLES
One of the standout features of this indicator is the ability to plot higher-timeframe (HTF) candles directly on your lower-timeframe (LTF) chart, giving you clear visualization of the entry models and insight into what’s unfolding on the larger timeframe.
You can fully customize the HTF candles - select their style, the number of bars displayed, and tweak various settings to match your personal trading style.
HTF FVG
Fair Value Gaps (FVGs) can also be drawn on the HTF candles themselves, enabling you to spot key liquidity or interest zones at a glance, without switching between timeframes.
Additionally, you can view all significant historical HTF highs and lows, with demarcation lines showing where each HTF candle begins and ends.
All these options let you tailor the HTF candle display on your chart and monitor multiple timeframes’ trends in a single view.
📶 INFO PANEL
Instrument: the market symbol on which the model is detected
Fractal Timeframes: the LTF and HTF fractal periods used to locate the pattern
HTF Candle Countdown: the time remaining until the higher-timeframe candle closes
Trade Direction: the direction (Long or Short) in which the model is searched for entry
🔔 ALERT CUSTOMIZATION
And, of course, you can configure any alerts you need. There are seven alert types available:
Confirmed Entry Model 1
Unconfirmed Entry Model 1
Confirmed Entry Model 2
Confirmed Entry Model 3
Entry Area 1 Trigger
Entry Area 2 Trigger
Entry Area 3 Trigger
You also get a custom macro field where you can enter any placeholders to fully personalize your alerts. Below are example macros you can use in that field.
{{event}} - Event name ('New M1')
{{direction}} - Trade direction ('Long', 'Short')
{{area_beg}} - Entry Area Price
{{area_end}} - Entry Area Price
{{exchange}} - Exchange ('Binance')
{{ticker}} - Ticker ('BTCUSD')
{{interval}} - Timeframe ('1s', '1', 'D')
{{htf}} - High timeframe ('15', '60', 'D')
{{open}}-{{close}}-{{high}}-{{low}} - Candle price values
{{htf_open}}-{{htf_close}}-{{htf_high}}-{{htf_low}} - Last confirmed HTF candle's price
{{volume}} - Candle volume
{{time}} - Candle open time in UTC timezone
{{timenow}} - Signal time in UTC timezone
{{syminfo.currency}} - 'USD' for BTCUSD pair
{{syminfo.basecurrency}} - 'BTC' for BTCUSD pair
✅ USAGE EXAMPLES
Now I’ll demonstrate several ways to apply this indicator across different trading strategies.
Primarily, it’s most effective within the Smart Money framework - where liquidity and manipulation are the core focus - so it integrates seamlessly into your SMC-based approach.
However, it can also be employed in other strategies, such as classic technical analysis or Elliott Wave, to capitalize on reversal points on the chart.
Example 1
The first example illustrates forming a downtrend using a Smart Money strategy. After the market structure shifts and the first BOS is broken, we begin looking for a short entry.
Once Entry Model 1 is established, a Fair Value Gap appears, which we use as our position-entry zone. The nearest target becomes the newly formed BOS level.
In this trade, it was crucial to wait for a strong downtrend to develop before hunting for entries. Therefore, we waited for the first BOS to break and entered the trade to ride the continuation of the downtrend down to the next BOS level.
Example 2
The next example illustrates a downtrend developing with a Fair Value Gap on the 1-hour timeframe. The FVG is also displayed directly on the HTF candles in the chart.
The pattern forms within the HTF Fair Value Gap, indicating that we can balance this inefficiency and ride the continuation of the downtrend.
The target can simply be a 1:2 or 1:3 risk–reward ratio, as in our case.
📌 CONCLUSION
These two examples illustrate how this indicator can be used to identify reversals or trend continuations. In truth, there are countless ways to incorporate this tool, and each trader can adapt the model to fit their own strategy.
Always remember to rely on your own analysis and only enter trades when you feel confident in them.

Equal High/Low (EQH/EQL) [AlgoAlpha]OVERVIEW
This script detects and visualizes Equal High (EQH) and Equal Low (EQL) zones—key liquidity areas where price has previously stalled or reversed. These levels often attract institutional interest due to the liquidity buildup around them. The indicator is built to highlight such zones using dynamic thresholding, overbought/oversold RSI filtering, and adaptive mitigation logic to manage zone relevance over time.
CONCEPTS
Equal Highs/Lows are price points where the market has repeatedly failed to break past a certain high or low, hinting at areas where stop orders and pending interest may be concentrated. These areas are often prime targets for liquidity grabs or reversals. By combining this with RSI filtering, the script avoids false signals during neutral conditions and instead focuses on zones where market pressure is more directional.
FEATURES
Detection Logic: The script identifies EQH and EQL zones by comparing the similarity between recent highs or lows with a dynamic volatility threshold. The `tolerance` input allows users to control how strict this comparison is.
RSI Filtering: If enabled, it only creates zones when RSI is significantly overbought or oversold (based on the `state_thresh` input). This helps ensure zones form only in meaningful market conditions.
Zone Display: Bullish (EQL) zones are shown in grey, while bearish (EQH) zones are in blue. Two horizontal lines mark the zone using wick and body extremes, and a filled area visualizes the zone between them.
Zone Management: Zones automatically extend with price until they’re invalidated. You can choose whether a zone is removed based on wick or body sweeps and whether it requires one or two candle confirmations. Zones also expire after a customizable number of bars.
Alerts: Four alert conditions are built in—when a new EQH/EQL is formed and when one is mitigated—making it easy to integrate into alert-based workflows.
USAGE
Equal highs/lows can be used as liquidity markers, either as entry points or as take-profit targets.
This tool is ideal for liquidity-based strategies and helps traders map out possible reversal or sweep zones that often precede aggressive moves.

Trend Classifier [ChartPrime]Trend Classifier
This is a multi-level trend classification tool that detects bullish, bearish, and ranging conditions using an adaptive smoothing method. It highlights trend strength through color-coded candles and layered bands, making it easy to interpret market momentum visually.
⯁ KEY FEATURES
Classifies trend strength using 3 bullish and 3 bearish levels relative to an adaptive trend line.
Neutral (range) zones are marked when price stays between key bands, often signaling low volatility or consolidation.
Automatically filters band visibility based on current trend direction:
In uptrends, only levels below the price are displayed.
In downtrends, only levels above the price are shown.
Color-coded candles:
Aqua candles for bullish conditions.
Red candles for bearish conditions.
Orange candles during neutral or ranging conditions.
Includes a trend direction change marker (diamond), plotted when a shift in trend is detected.
Plots a central smoothed trend line to anchor the trend bands dynamically.
Displays a trend strength dashboard in the top-right corner with real-time bull and bear scores (0 to 3).
Labels with arrows (▲/▼) show current trend direction and strength on the chart.
⯁ HOW TO USE
Use bull and bear levels (1–3) to assess the momentum of the current trend.
When bull = 0 and bear = 0 , market is considered ranging or consolidating – consider fading or waiting for breakout confirmation.
Trend bands can be used as dynamic support/resistance during trending phases.
Monitor the trend change diamonds to spot potential early reversals.
Combine with volume or oscillator tools for confirmation of strength shifts.
⯁ CONCLUSION
Trend Classifier helps traders stay aligned with the dominant trend while visually breaking down market momentum into levels. Its clean color-coded design and strength dashboard make it ideal for both trend following and range trading strategies.

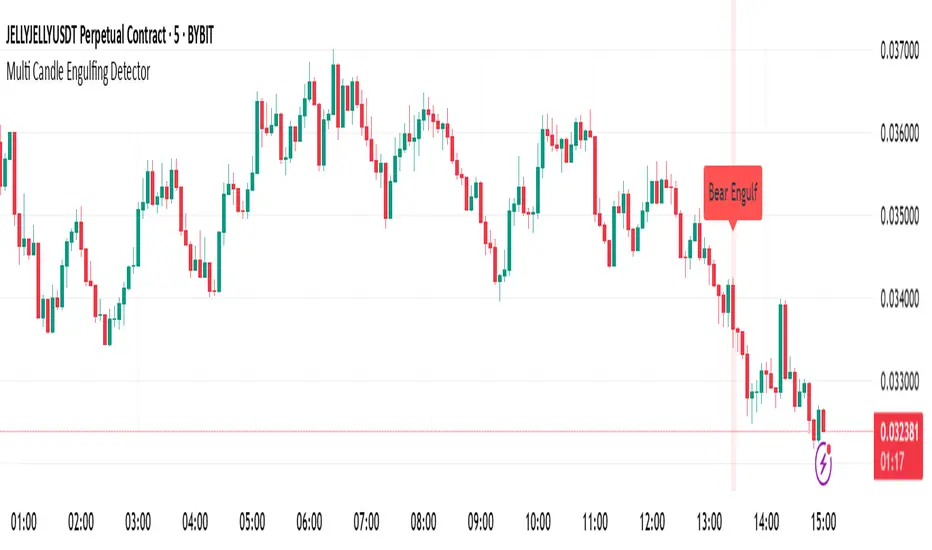
Multi Candle Engulfing Detector🔍 Multi Candle Engulfing Detector
This indicator identifies powerful engulfing candles that consume three or more previous candles — a signal often tied to strong market reversals or continuation moves.
🧠 Features
Detects candles that fully engulf the previous 3 or more candles
Optional filtering: only trigger when the engulfed candles are of the opposite color
Customizable engulf count for greater pattern control
Clear bullish and bearish signal labels on the chart
Alerts integrated: get notified the moment a setup forms
Background highlighting for enhanced visibility
⚙️ Settings
Minimum Number of Candles to Engulf: Default is 3, but can be adjusted
Require Opposite Color: When enabled, the engulfing candle must be opposite in color to the engulfed ones (e.g., green engulfing red)
📈 Use Cases
Spot strong reversal signals at tops and bottoms
Confirm breakout momentum on trend continuation
Use in confluence with other tools like volume or support/resistance
🚨 Alerts
Alerts fire when a bullish or bearish engulfing pattern is detected, allowing for mobile, email, or webhook notifications.
✅ Notes
This script is fully customizable and can be extended into a strategy or scanning tool. Feedback and suggestions are always welcome!
Market Structure Confluence [AlgoAlpha]OVERVIEW
This script is called "Market Structure Confluence" and it combines classic market structure analysis with a dynamic volatility-based band system to detect shifts in trend and momentum more reliably. It tracks key swing points (higher highs, higher lows, lower highs, lower lows) to define the trend, then overlays a basis and ATR-smoothed volatility bands to catch rejection signals and highlight potential inflection points in the market.
CONCEPTS
Market structure is the foundation of price action trading, focusing on the relationship between successive highs and lows to understand trend conditions. Break of Structure (BOS) and Change of Character (CHoCH) events are important because they signal when a market might be shifting direction. This script enhances traditional structure by integrating volatility bands, which act like dynamic support/resistance zones based on ATR, allowing it to capture momentum surges and rejections beyond just structural shifts.
FEATURES
Swing Detection: It detects and labels Higher Highs (HH), Higher Lows (HL), Lower Highs (LH), and Lower Lows (LL) based on user-defined time horizons, helping traders quickly spot the trend direction.
BOS and CHoCH Lines: When a previous swing point is broken, the script automatically plots a Break of Structure (BOS) line. If the break represents a major trend reversal (a CHoCH), it is marked differently to separate simple breakouts from real trend changes.
Rejection Signals: Special arrows plot when price pierces a band and then pulls back, suggesting a potential trap move or rejection signal in the direction of the new structure.
Alerts: Built-in alerts for structure breaks, CHoCHs, swing points, rejections at bands, and trend flips make it easy to automate setups without manually watching the chart.
USAGE
Set your preferred swing detection size depending on your timeframe and trading style — smaller numbers for intraday, larger numbers for swing trading. Choose whether you want BOS/CHoCH confirmed by candle closes or by wick breaks. Use the volatility band settings to fine-tune how tightly or loosely the bands hug the price, adjusting sensitivity based on market conditions. When a BOS or CHoCH occurs, or when a rejection happens at the bands, the script will highlight it clearly and optionally trigger alerts. Watch for combinations where both structure breaks and volatility band rejections happen together — those are high-quality trade signals. This setup works best when used with basic trend filtering and higher timeframe confirmation.

Liquidity Trap Reversal Pro (Radar v2)Liquidity Trap Reversal Pro (Radar v2) is a non-repainting indicator designed to detect hidden liquidity traps at key swing highs and lows. It combines wick analysis, volume spike detection, and optional trend and exhaustion filters to identify high-probability reversal setups.
🔷 Features:
Non-Repainting: Pivots confirmed after lookback period, no future leaking.
Volume Spike Detection: Filters traps that occur during major liquidity events.
EMA Trend Filter (Optional): Focus on traps aligned with the prevailing trend.
Higher Timeframe Trend Filter (Optional): Confirm traps using a higher timeframe EMA bias.
Exhaustion Guard (Optional): Prevents traps after overextended moves based on ATR stretch.
Clean Visuals: Distinct plots for raw trap points vs confirmed traps.
Alerts Included: Set alerts for confirmed high/low liquidity traps.
📚 How to Use:
Watch for Trap Signals:
A Trap High signal suggests a potential bearish reversal.
A Trap Low signal suggests a potential bullish reversal.
Use Confirmed Signals for Best Entries:
Confirmed traps fire only after price moves opposite to the trap direction, adding reliability.
Use Trend Filters to Improve Accuracy:
In an uptrend (price above EMA), prefer Trap Lows (buy setups).
In a downtrend (price below EMA), prefer Trap Highs (sell setups).
Use the Exhaustion Guard to Avoid Bad Trades:
This filter blocks signals when price has moved too far from trend, helping avoid late entries.
Recommended Settings:
Best used on 15-minute, 1-hour, or 4-hour charts.
Trend filter ON for trending markets.
Exhaustion guard ON for volatile or stretched markets.
📈 Important Notes:
This script does not repaint once a pivot is confirmed.
Alerts trigger only on confirmed trap signals.
Always combine signals with sound risk management and trading strategy.
Disclaimer:
This script is for educational purposes only. It is not investment advice or a guarantee of results. Always do your own research before trading.

[Stop!Loss] ADR Signal ADR Signal - a technical indicator located in a separate window, which displays by default the 80%-level , as well as the 100%-level of the average daily range (ADR) for the last 10 days and compares it with the current intraday range. The indicator helps not only with the use of a mathematical-statistical method to identify a potential reversal at the moment during intraday trading, but can also serves as an effective assistant in risk management.
👉 Basic mechanics of the indicator
Firstly, this indicator tracks the performance of the standard ATR indicator on the daily chart, in other words, ADR (Average Daily Range).
Important ❗️The ATR (Average True Range) indicator was created by J. Welles Wilder Jr. He first introduced ATR in his book "New Concepts in Technical Trading Systems", published in 1978. Wilder developed this indicator to measure market volatility to help traders estimate the range of price movements. This indicator is built into TradingView, more details can be found by link: www.tradingview.com
Like ATR , ADR calculates the average true range for a specified period. In this case, the distance in points from the maximum of each day to its minimum is calculated, after which the arithmetic mean is calculated - this is ADR .
👉 Visualization
ADR Signal is located in a separate window on the chart and has 3 levels:
1) "ADR level" (green line) - the same parameter, the calculations of which are briefly described above. There is 100%-level of ATR on the daily chart (ADR).
2) "Current level" (red line) - this is the current price passage within the day, calculated in points. At the start of a new day, this parameter is reset. Therefore, in the indicator window, this line has sharp drops at the start of a new trading day: "A new trading day - the instrument's power reserve is renewed again".
3) "Signal level" (blue line) - this is an individually customized value that demonstrates a certain part of the ADR parameter.
👉 Inputs
1) - is responsible for the ATR indicator period, the value of which will always be calculated on the daily chart. The default value is "10", that is, ATR is calculated for the last 10 days (not including the current one).
2) - signal level (in %). The default value is "0.8", that is, 80%-level of the ADR parameter (set earlier) is calculated.
👉 Style
1) - by default, this level is colored "blue".
2) - by default, this level is colored "red".
3) - by default, this level is colored "green".
👉 How to use this indicator
Important❗️ The two methods of the use of the ADR Signal indicator described below will be most effective when trading intraday (which is highlighted quite well below), so it is more logical to use the indicator information on time periods H1 and below.
1) Identifying potential reversals during intraday trading:
The ADR Signal indicator can be used as a potential individual reversal strategy.
Important ❗️It should be noted that using it in it without additional confirming analysis tools will be a rather aggressive trading approach. Therefore, it is best to support the entry point in particular with other methods.
In this case, the crossing of the red line (the number of points passed within the current day, that is, from the minimum of the current day to its maximum) and the blue line (color of the Signal level based on the default settings), indicates that the trading instrument has passed 80% (based on the default settings for the "Signal level") of its average distance from the maximum to the minimum over the past 10 days (based on the default settings for the "ADR Length"). Such a situation in the context of the mathematical-statistical approach indicates a probable reversal, since the "power reserve" of this instrument is mostly exhausted, so one can expect with a higher probability, at least, a price stop and possibly a reversal. In case of crossing of the red line and the green one (ADR level), it says again that based on the mathematical-statistical approach, this trading instrument has completely exhausted its intraday "power reserve". In this situation, a stop or reversal of the price will be even more likely.
Of course, using the "Signal level" parameter, one can filter out even more reliable situations for potential price reversals within a day, namely, by specifying, for example, 1.5 in the field of this parameter. Under such conditions, in the case of crossing the red and blue lines (based on the default style settings), to say that the trading instrument has passed 150% of its average distance over the last 10 days (based on the default style settings "ADR length"). In this case, the probability of a stop or reversal of the price increases even more.
2) Use in risk management:
In terms of risk management, this indicator is more applicable to open trades. For example, if one had an open Buy-position (especially if it is an intraday trade) and the price has raised significantly during the day, then the crossing of the red line with the blue line , and especially the red line with the green line , may indicate that the price will most likely stop growing, since the "power reserve" is almost or completely exhausted for this instrument within the current day. In this case, one can, at a minimum, move the trade to breakeven or even partially fix the profit.
We will continue to discuss the methods of using this indicator and strategies based on it here. And we are always waiting for your reactions and feedback on this topic 💬.
Thank you for your support 🚀

Zen MIG Reversal V1**Zen MIG Reversal V1**
Zen MIG Reversal is a pattern-based indicator that highlights rare reversal setups.
It’s designed to support traders in visually identifying potential turning points, especially following strong momentum or gap-style moves.
**How it works:**
- **Bullish Reversal:**
Detects 3 consecutive bullish candles. The third bar must have a low above the high of the first bar and below the 20 EMA. When this occurs, a light blue box is drawn across the 3-bar range, from high to the current bar’s low. A blue arrow appears below the prior bar.
- **Bearish Reversal:**
Detects 3 consecutive bearish candles. The third bar must have a high below the low of the first bar and above the 20 EMA. A light red box is drawn from low to the current bar’s high. A red arrow appears above the prior bar.
- Optional settings allow you to:
- Show or hide the EMA line
- Toggle the arrows
- Adjust smoothing settings for context
**Purpose:**
It’s best used for discretionary analysis, journaling, or studying price behavior in momentum-driven environments.
**Disclaimer:**
This script is for educational and informational purposes only. It does not provide financial advice or trade recommendations. Always backtest and use proper risk management before applying any indicator to live trading.

Adaptive Support & Resistance Levels [StabTrading]The Adaptive S&R Levels indicator is designed to study support and resistance levels by synthesizing multiple well-known techniques for identifying these zones. It aims to provide traders with reliable price levels that reflect the collective perspective of market participants, using historical price action and projective techniques for extreme conditions.
💡 Introduction: Identified Problem
Traders often draw support and resistance lines using varied methods, leading to inconsistencies in where these levels are placed on charts. This variability can reduce the effectiveness of individual levels, as price may not react strongly to zones that lack broad recognition. The Adaptive S&R Levels indicator addresses this by aggressively averaging multiple established techniques to create support and resistance lines that align with what most traders are likely to identify, increasing the probability of price reactions.
🚀 How it Works: Overview
The indicator employs a multi-technique algorithm to generate support and resistance levels, ensuring they represent a consensus of trader perspectives.
🚀 How it Works: Chart Levels Display and Styling
Support levels, displayed in green below the current price, and resistance levels, shown in red above the price, are plotted clearly on the chart. Levels are numbered sequentially (e.g., v1, v2) as they move further from the current price, providing a visual hierarchy of proximity. Extreme levels, labeled as "Extreme Support" or "Extreme Resistance," are plotted in a bolder color to distinguish them as the outermost boundaries, maintaining the same green (support) and red (resistance) color scheme for consistency.
🚀 How it Works: Historical Price Action Algorithm
For areas with available historical data, the algorithm analyzes price action using a variety of recognized methods for drawing support and resistance, such as pivot points, swing highs/lows, and volume-based zones. It calculates a weighted average of these techniques to produce a “regression fit” line that reflects the accumulation of levels traders might draw. By prioritizing areas where multiple methods converge, the indicator identifies zones likely to be significant to a wide audience, enhancing their relevance.
🚀 How it Works: Projective Techniques Algorithm
In scenarios without recent historical price action—such as all-time highs or lows—the indicator employs an alternative algorithm that combines projective techniques commonly used by traders. These include Fibonacci extensions, Measured Moves (price projections), Psychological Milestones (e.g., round numbers), Channel/Trendline Extrapolation, and Time-Based Targets (inspired by methods like Gann techniques). The algorithm seeks a confluence of these methods to draw support and resistance levels that align with what most traders would consider significant in such conditions. These levels maintain the same green (support) and red (resistance) color scheme, with numbering based on their distance from the price.
🚀 How it Works: Noise Parameter Adjustment
Users can adjust a noise parameter to control the number of displayed levels. Lower settings show more lines, reflecting a broader range of potential zones but with less confluence. Higher settings increase the required confluence of techniques, resulting in fewer lines that have a higher probability of eliciting a price reaction. This customization allows traders to tailor the indicator to their preferred timeframe or trading style.
🔥 Features
Confluence-Based Levels: Support and resistance lines are derived from a weighted average of multiple techniques, aiming to mirror the levels most traders would recognize.
Extreme Levels: Generates support and resistance in areas without historical price action, using techniques like Fibonacci extensions and Measured Moves.
Color-Coded Display: Green support levels appear below the current price, and red resistance levels appear above, with extreme levels in a bolder shade for distinction.
Adjustable Noise Parameter: Users can modify the confluence threshold to display more lines (lower settings) or fewer, higher-probability lines (higher settings).
📈 Implementing the System
1. Adjust Settings
Set the noise parameter based on your trading style (0.1 to 10).
Use lower values for more frequent levels, suitable for scalping or short-term analysis.
Use higher values for fewer, higher-confluence levels, ideal for swing trading or longer-term strategies.
Adjust for your timeframe: Settings tend to be lower on shorter timeframes and higher on longer timeframes.
2. Identify Levels
Monitor green support levels below the price for potential buying zones, noting their numbered proximity (v1, v2, etc.).
Observe red resistance levels above the price for potential selling or shorting zones, noting their numbered proximity.
Note extreme levels (labeled "Extreme Support" or "Extreme Resistance") in areas like all-time highs, which may act as key reversal points.
3. Evaluate Price Reactions
Track how price interacts with the plotted levels to assess their effectiveness, considering their proximity to price.
Observe performance in bullish, bearish, or ranging markets to understand the indicator’s behavior at different levels.
Test different noise parameter settings across various assets and timeframes to find the optimal balance for your approach.
4. Layering Trades with Levels
Use the numbered levels to layer into a trade: for example, enter a partial position at a closer support level (e.g., v1) and add to it at a further level (e.g., v2) if price continues to decline, spreading risk across multiple zones.
Layer out of a trade by taking partial profits at each resistance level as price rises (e.g., reduce position at v1, then v2), or fully exit at an "Extreme Resistance" level to maximize gains while managing exposure.
🔶 Conclusion
The Adaptive S&R Levels indicator provides a framework for studying support and resistance by averaging multiple trader-recognized techniques. With its ability to handle both historical and extreme price scenarios, numbered levels for visual hierarchy, and customizable noise settings, it offers a versatile tool for analyzing key price levels. Designed for educational use, it encourages traders to test and observe how these consensus-driven levels align with market behavior within broader analysis.

Volume NodesVolume Nodes Indicator:
What This Indicator Does:
The Volume Nodes indicator identifies and visualizes statistically significant volume events on your chart, helping you identify important price levels where substantial trading activity has occurred. Unlike standard volume indicators, Volume Nodes:
Uses statistical analysis (z-scores) to identify truly abnormal volume bars
Calculates accurate buy/sell volume ratios by analyzing all lower timeframe data
Identifies the Volume Point of Control (VPOC) for high volume areas
Visualizes significant volume ranges as they extend across the chart
Tracks when price interacts with these important levels
Key Features:
High Volume Detection: Highlights bars with unusually high volume (z-score above threshold)
Low Volume Detection: Highlights bars with unusually low volume (z-score below threshold)
VPOC Lines: Horizontal lines showing the exact price level with maximum volume concentration
Volume Range Fills: Shaded areas showing the entire price range with significant volume
Accurate Volume Metrics: Shows true buy/sell volume ratios or delta percentages derived from lower timeframe data
How to Use It in Your Trading: **Move to front in the visual order on chart**
Step 1: Identify Important Volume Zones
High Volume Bars (green/red candles) indicate where significant buying or selling has occurred
VPOC Lines extending from these bars show you the exact price level with highest volume
Range Fills show you the entire zone where significant volume occurred
Step 2: Use These Levels for Trading Decisions
Support/Resistance: VPOC lines often act as support or resistance levels
Breakout Validation: Breakouts on high volume are more likely to be valid
Low Volume Warning: Low volume bars (yellow) often indicate indecision or potential reversals
Trading with Volume Flow: Use the buy/sell ratio or delta % to confirm the strength and direction of moves
Step 3: Monitor Price Interaction with Volume Zones
When price approaches a VPOC line, watch for reaction (bounce or breakout)
When price enters a volume range area, increased volatility often follows
When price crosses a VPOC line, the line changes transparency indicating it's been tested
Tips for Optimal Use
Higher Timeframes: The indicator works exceptionally well on higher timeframes (4H, daily, weekly) where volume patterns are more significant
Range Trading: Use volume nodes to identify the boundaries of trading ranges
Combine with Price Action: Look for price action confirmation (rejections, engulfing patterns) at VPOC levels
Multiple Timeframe Analysis: Compare volume nodes across different timeframes to find confluent levels
Alert Setup: Set up alerts for when price enters important volume zones or crosses VPOC lines
Reversal Signals: High volume bars with significant wicks often signal exhaustion points where smart money is transferring positions. Bullish candles with long upper wicks suggest sellers absorbing buying pressure at highs, while bearish candles with long lower wicks indicate buyers stepping in at lows - both potentially signaling momentum shifts that precede reversals.
The indicator is particularly valuable for identifying levels where large players have been active in the market and are likely to defend or act again in the future.

Aurora Flow Oscillator [QuantAlgo]The Aurora Flow Oscillator is an advanced momentum-based technical indicator designed to identify market direction, momentum shifts, and potential reversal zones using adaptive filtering techniques. It visualizes price momentum through a dynamic oscillator that quantifies trend strength and direction, helping traders and investors recognize momentum shifts and trading opportunities across various timeframes and asset class.
🟢 Technical Foundation
The Aurora Flow Oscillator employs a sophisticated mathematical approach with adaptive momentum filtering to analyze market conditions, including:
Price-Based Momentum Calculation: Calculates logarithmic price changes to measure the rate and magnitude of market movement
Adaptive Momentum Filtering: Applies an advanced filtering algorithm to smooth momentum calculations while preserving important signals
Acceleration Analysis: Incorporates momentum acceleration to identify shifts in market direction before they become obvious
Signal Normalization: Automatically scales the oscillator output to a range between -100 and 100 for consistent interpretation across different market conditions
The indicator processes price data through multiple filtering stages, applying mathematical principles including exponential smoothing with adaptive coefficients. This creates an oscillator that dynamically adjusts to market volatility while maintaining responsiveness to genuine trend changes.
🟢 Key Features & Signals
1. Momentum Flow and Extreme Zone Identification
The oscillator presents market momentum through an intuitive visual display that clearly indicates both direction and strength:
Above Zero: Indicates positive momentum and potential bullish conditions
Below Zero: Indicates negative momentum and potential bearish conditions
Slope Direction: The angle and direction of the oscillator provide immediate insight into momentum strength
Zero Line Crossings: Signal potential trend changes and new directional momentum
The indicator also identifies potential overbought and oversold market conditions through extreme zone markings:
Upper Zone (>50): Indicates strong bullish momentum that may be approaching exhaustion
Lower Zone (<-50): Indicates strong bearish momentum that may be approaching exhaustion
Extreme Boundaries (±95): Mark potentially unsustainable momentum levels where reversals become increasingly likely
These zones are displayed with gradient intensity that increases as the oscillator moves toward extremes, helping traders and investors:
→ Identify potential reversal zones
→ Determine appropriate entry and exit points
→ Gauge overall market sentiment strength
2. Customizable Trading Style Presets
The Aurora Flow Oscillator offers pre-configured settings for different trading approaches:
Default (80,150): Balanced configuration suitable for most trading and investing situations.
Scalping (5,80): Highly responsive settings for ultra-short-term trades. Generates frequent signals and catches quick price movements. Best for 1-15min charts when making many trades per day.
Day Trading (8,120): Optimized for intraday movements with faster response than default settings while maintaining reasonable signal quality. Ideal for 5-60min or 4h-12h timeframes.
Swing Trading (10,200): Designed for multi-day positions with stronger noise filtering. Focuses on capturing larger price swings while avoiding minor fluctuations. Works best on 1-4h and daily charts.
Position Trading (14,250): For longer-term position traders/investors seeking significant market trends. Reduces false signals by heavily filtering market noise. Ideal for daily or even weekly charts.
Trend Following (16,300): Maximum smoothing that prioritizes established directional movements over short-term fluctuations. Best used on daily and weekly charts, but can also be used for lower timeframe trading.
Countertrend (7,100): Tuned to detect potential reversals and exhaustion points in trends. More sensitive to momentum shifts than other presets. Effective on 15min-4h charts, as well as daily and weekly charts.
Each preset automatically adjusts internal parameters for optimal performance in the selected trading context, providing flexibility across different market approaches without requiring complex manual configuration.
🟢 Practical Usage Tips
1/ Trend Analysis and Interpretation
→ Direction Assessment: Evaluate the oscillator's position relative to zero to determine underlying momentum bias
→ Momentum Strength: Measure the oscillator's distance from zero within the -100 to +100 range to quantify momentum magnitude
→ Trend Consistency: Monitor the oscillator's path for sustained directional movement without frequent zero-line crossings
→ Reversal Detection: Watch for oscillator divergence from price and deceleration of movement when approaching extreme zones
2/ Signal Generation Strategies
Depending on your trading approach, multiple signal strategies can be employed:
Trend Following Signals:
Enter long positions when the oscillator crosses above zero
Enter short positions when the oscillator crosses below zero
Add to positions on pullbacks while maintaining the overall trend direction
Countertrend Signals:
Look for potential reversals when the oscillator reaches extreme zones (±95)
Enter contrary positions when momentum shows signs of exhaustion
Use oscillator divergence with price as additional confirmation
Momentum Shift Signals:
Enter positions when oscillator changes direction after establishing a trend
Exit positions when oscillator direction reverses against your position
Scale position size based on oscillator strength percentage
3/ Timeframe Optimization
The indicator can be effectively applied across different timeframes with these considerations:
Lower Timeframes (1-15min):
Use Scalping or Day Trading presets
Focus on quick momentum shifts and zero-line crossings
Be cautious of noise in extreme market conditions
Medium Timeframes (30min-4h):
Use Default or Swing Trading presets
Look for established trends and potential reversal zones
Combine with support/resistance analysis for entry/exit precision
Higher Timeframes (Daily+):
Use Position Trading or Trend Following presets
Focus on major trend identification and long-term positioning
Use extreme zones for position management rather than immediate reversals
🟢 Pro Tips
Price Momentum Period:
→ Lower values (5-7) increase sensitivity to minor price fluctuations but capture more market noise
→ Higher values (10-16) emphasize sustained momentum shifts at the cost of delayed response
→ Adjust based on your timeframe (lower for shorter timeframes, higher for longer timeframes)
Oscillator Filter Period:
→ Lower values (80-120) produce more frequent directional changes and earlier response to momentum shifts
→ Higher values (200-300) filter out shorter-term fluctuations to highlight dominant market cycles
→ Match to your typical holding period (shorter holding time = lower filter values)
Multi-Timeframe Analysis:
→ Compare oscillator readings across different timeframes for confluence
→ Look for alignment between higher and lower timeframe signals
→ Use higher timeframe for trend direction, lower for earlier entries
Volatility-Adaptive Trading:
→ Use oscillator strength to adjust position sizing (stronger = larger)
→ Consider reducing exposure when oscillator reaches extreme zones
→ Implement tighter stops during periods of oscillator acceleration
Combination Strategies:
→ Pair with volume indicators for confirmation of momentum shifts
→ Use with support/resistance levels for strategic entry and exit points
→ Combine with volatility indicators for comprehensive market context

Bullish & Bearish Engulfing ProHello Traders!
Overview
The Bullish & Bearish Engulfing Pro indicator is a powerful pattern recognition tool that identifies key reversal points and trend continuation opportunities. These engulfing patterns often mark the beginning of a significant price move and are widely used in technical analysis. For example, in an uptrend, a Bullish Engulfing pattern can provide an ideal pullback entry signal.
This indicator combines traditional candlestick theory with advanced technical filters like trend direction and volatility analysis to offer traders precise, high-confidence signals.
Key Features :
Accurate pattern detection:
Uses refined algorithms to detect true Bullish and Bearish Engulfing patterns, filtering out noise and false positives.
Trend filter:
Customizable Simple Moving Average (SMA) ensures trades are aligned with the market’s broader trend, improving trade success rates.
Volatility awareness:
ATR-based filtering ensures that only statistically significant engulfing patterns are highlighted.
Visual clarity:
Bullish and Bearish Engulfing patterns are displayed with distinct, customizable colors and labels for instant recognition.
Flexible customization:
Users can adjust detection criteria, SMA settings, and visual options to suit their personal strategy.
Filtered signal display:
Option to visualize filtered-out signals to better understand how the logic makes its decisions.
Bullish Engulfing Pattern
Appears after a downtrend or during a pullback in an uptrend
Consists of two candles
A smaller bearish candle
Followed by a larger bullish candle that completely engulfs the previous body
Bearish Engulfing Pattern
Appears after an uptrend or during a pullback in a downtrend
Consists of two candles
A smaller bullish candle
Followed by a larger bearish candle that completely engulfs the previous body
Key differences in this implementation
What makes this indicator unique
Trend and volatility filters
Ensure patterns occur in meaningful market conditions
Comprehensive pattern analysis:
Factors in candle body ratios, wick sizes, and relative size to past candles for smarter detection
Adaptive to market conditions:
Dynamic thresholds based on ATR allow pattern recognition to adjust to different volatility regimes
Educational value:
Visualizing rejected patterns helps traders build intuition and refine their discretion
How to Trade with this Indicator
Engulfing patterns can signal strong reversals or pullback continuations. Use them with trend and volume confirmation to maximize their effectiveness.
snapshot
Bullish Opportunities:
Look for Bullish Engulfing patterns (aqua-colored candles and labels) during or after a pullback in an uptrend.
Bearish Opportunities:
Watch for Bearish Engulfing patterns (orange-colored candles and labels) during or after a rally in a downtrend.
Entry: Enter on the next bar open after the engulfing candle completes.
Stop loss: 2 ticks below/above the engulfing candle’s low/high.
Take profit: Aim for at least a 2R target, a swing high/low or manage the tradewith a trailing stop.
Trend Alignment:
For higher win probability, take trades only in the direction of the SMA-defined trend.
Note: To ensure the candle coloring appears correctly, place the indicator at the top of the object tree.

Reversal Strength Meter – Adib NooraniThe Reversal Strength Meter is an oscillator designed to identify potential reversal zones based on supply and demand dynamics. It uses smoothed stochastic logic to reduce noise and highlight areas where momentum may be weakening, signaling possible market turning points.
🔹 Smooth, noise-reduced stochastic oscillator
🔹 Custom zones to highlight potential supply and demand imbalances
🔹 Non-repainting, compatible across all timeframes and assets
🔹 Visual-only tool — intended to support discretionary trading decisions
This oscillator assists scalpers and intraday traders in tracking subtle shifts in momentum, helping them identify when a market may be preparing to reverse — always keeping in mind that trading is based on probabilities, not certainties.
📘 How to Use the Indicator Efficiently
For Reversal Trading:
Buy Setup
– When the blue line dips below the 20 level, wait for it to re-enter above 20.
– Look for reversal candlestick patterns (e.g., bullish engulfing, hammer, or morning star).
– Enter above the pattern’s high, with a stop loss below its low.
Sell Setup
– When the blue line rises above the 80 level, wait for it to re-enter below 80.
– Look for bearish candlestick patterns (e.g., bearish engulfing, inverted hammer, or evening star).
– Enter below the pattern’s low, with a stop loss above its high.
🛡 Risk Management Guidelines
Risk only 0.5% of your capital per trade
Book 50% profits at a 1:1 risk-reward ratio
Trail the remaining 50% using price action or other supporting indicators

Reversal Scalping Ribbon - Adib NooraniThe Reversal Scalping Ribbon is a trend-following overlay tool designed to visually identify potential reversal zones based on price extremes and dynamic volatility bands. It calculates adaptive upper and lower bands using price action and custom ATR logic, helping traders quickly assess market direction and possible turning points
🔹 Volatility-adjusted bands based on price highs/lows
🔹 Color-coded ribbons to indicate trend bias and potential reversal shifts
🔹 No repainting, works on all timeframes and assets
🔹 Visual-only display, no trade signals — supports discretion-based entries
This ribbon is designed for scalpers and intraday traders to spot reversal setups with clarity. It enhances your trading by showing real-time market bias without unnecessary distractions. By focusing on probabilities, it helps to improve decision-making in fast-paced environments
How to use the indicator efficiently
For Reversal Trading:
Buy: When price closes below the green ribbon with a red candle, then re-enters with a green candle. Enter above the high of the green candle with a stop loss below the lowest low of the recent green/red candles
Sell: When price closes above the red ribbon with a green candle, then re-enters with a red candle. Enter below the low of the red candle with a stop loss above the highest high of the recent red/green candles
Risk Management:
Limit risk to 0.5% of your capital per trade
Take 50% profit at a 1:1 risk-reward ratio
For the remaining 50%, trail using the lower edge of the green band for buys and the upper edge of the red band for sells

Trend Targets [AlgoAlpha]OVERVIEW
This script combines a smoothed trend-following model with dynamic price rejection logic and ATR-based target projection to give traders a complete visual framework for trading trend continuations. It overlays on price and automatically detects potential trend shifts, confirms rejections near dynamic support/resistance, and displays calculated stop-loss and take-profit levels to support structured risk-reward management. Unlike traditional indicators that only show trend direction or signal entries, this tool brings together a unique mix of signal validation, volatility-aware positioning, and layered profit-taking to guide decision-making with more context.
CONCEPTS
The core trend logic is built on a custom Supertrend that uses an ATR-based band structure with long smoothing chains—first through a WMA, then an EMA—allowing the trend line to respond to major shifts while ignoring noise. A key addition is the use of rejection logic: the script looks for consolidation candles that "hug" the smoothed trend line and counts how many consecutive bars reject from it. This behavior often precedes significant moves. A user-defined threshold filters out weak tests and highlights only meaningful rejections.
FEATURES
Trend Detection : Automatically identifies trend direction using a smoothed Supertrend (WMA + EMA), with shape markers on trend shifts and color-coded bars for clarity.
Rejection Signals : Detects price rejections at the trend line after a user-defined number of consolidation bars; plots ▲/▼ icons to highlight strong continuation setups.
Target Projection : On trend confirmation, plots entry, stop-loss (ATR-based), and three dynamic take-profit levels based on customizable multiples.
Dynamic Updates : All levels (entry, SL, TP1–TP3) auto-adjust based on volatility and are labeled in real time on the chart.
Customization : Users can tweak trend parameters, rejection confirmation count, SL/TP ratios, smoothing lengths, and appearance settings.
Alerts : Built-in alerts for trend changes, rejection events, and when TP1, TP2, or TP3 are reached.
Chart Overlay : Plots directly on price chart with minimal clutter and clearly labeled levels for easy trading.
USAGE
Start by tuning the Supertrend factor and ATR period to fit your asset and timeframe—higher values will catch bigger swings, lower values catch faster moves. The confirmation count should match how tightly you want to filter rejection behavior—higher values make signals rarer but stronger. When the trend shifts, the indicator colors the bars and line accordingly, and if enabled, plots the full entry-TP-SL structure. Rejection markers appear only after enough qualifying bars confirm price pressure at the trend line. This is especially useful for continuation plays where price retests the trend but fails to break it. All calculations are based on volatility (ATR), so targets naturally adjust with market conditions. Add alerts to get notified of important signals even when away from the chart.
