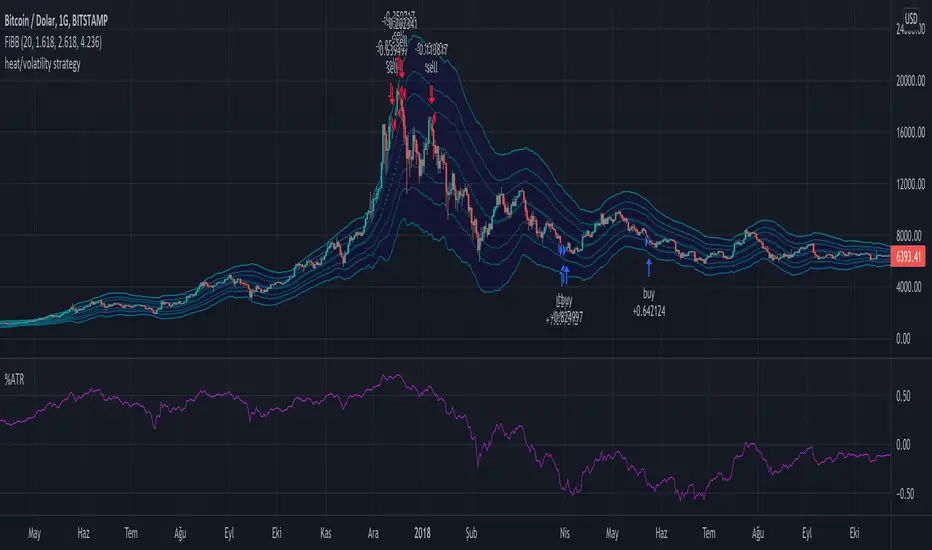
Long Term Heat/Volatility - Accumulation/Distribution v1This is a strategy specifically made for 1D BTC/USD with the aim of capturing cycle tops and bottoms. It's mainly based on two indicators: 21d average of ATR (volatility) and (BTC.price - 180d sma)/BTC.price (heat). The strategy only signals buys or sells after occurrences of high volatility, followed by extremely high or low heat values. It's optimized for utilizing accumulation and distribution at lower and higher prices respectively with respect to last 14 days. 2nd version will include dynamic dollar cost averaging during the accumulation and distribution periods.
Relative Strength Index (RSI)
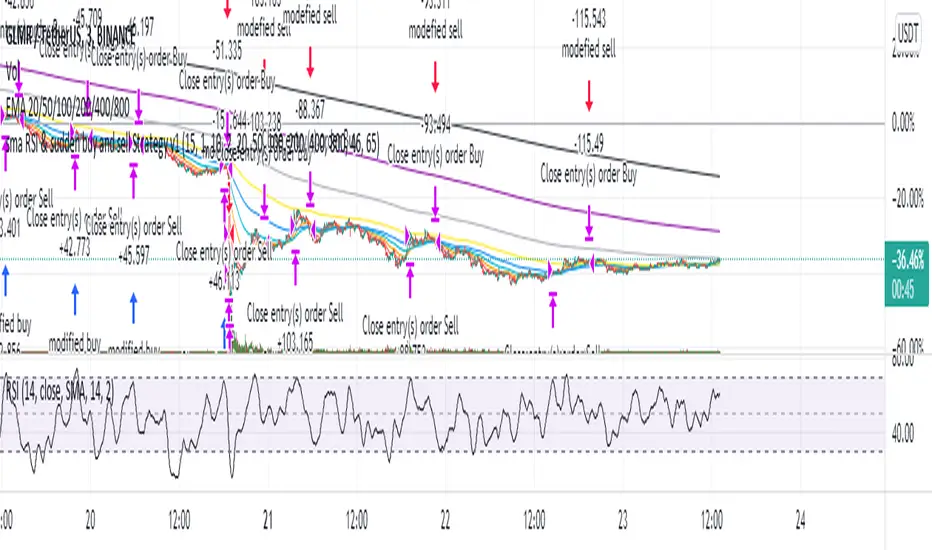
sma RSI & sudden buy and sell Strategy v1This strategy uses mostly three things:-
1. average RSI (sma rsi over a period)
2. sudden buy and sudden sell (usually to infer the change in trend or direction)
3. various EMAs ( used as a filter)
I mostly build it to work on a 3min crypto chart but it should work on any timeframe or any symbol.
Settings - Length -RSI length (hardly needed to be changed but sometimes it doubles the net profit)(+/-2)
instant length - a sudden increase or decrease in the price calculated by the length of RSI (+/-10)
Bars - No of candles to verify before starting /closing the strategy (+/-20)
Lookbackno2 - another variable to verify ema opening/closing (hardly needed to change)
emas - values of different EMAs (you can change if you want but I don't recommend it though)
over40 and over60 - the value of overbuying and overselling(+/-10)
In future, I will probably add ADX or use machine learning to filter out results
It works well considering 0.05% commission per entry and exit (total of 1% per trade)
you can message me for any query or suggestions.
BTC Cap Dominance RSI StrategyThis strategy is based on the BTC Cap Dominance RSI indicator, which is a combination of the RSI of Bitcoin Market Cap and the RSI of Bitcoin Dominance. The concept of this strategy is to get a good grasp of the bitcoin market flow by combining bitcoin dominance as well as bitcoin market cap.
BTC Cap Dominance (BCD) RSI is defined as:
BCD RSI = (BTC Cap RSI + BTC Dominance RSI) / 2
Case 1 (Bull market):
Both Cap RSI and Dominance RSI values are high
Case 2 (Neutral market):
Cap RSI is high but Dominance RSI is low
Cap RSI is low but Dominance RSI is high
Case 3 (Bear market):
Both Cap RSI and Dominance RSI values are low
When the BCD RSI value closes the candle above the Bull level, it triggers a long signal and when the value closes below the Bear level, it triggers a short signal.
(Note) Please note that TradingView's market cap symbols (CRYPTOCAP:TOTAL and CRYPTOCAP:TOTAL2) started in January 2020, so strategy backtesting is possible from this point on.
(Note) Since the real-time BCD RSI value does not come out with this strategy, it is recommended to use it together because the current value can be known and the long-short signal can be predicted in advance by using a separate BCD RSI Index together.
If "Use Combination of dominance RSI ?" is not checked in addition to the recommended default value of the strategy, the recommended values are Length (14), Bull level (74), Bear level (25).
_______________________________________________________________________
이 전략은 비트코인 시가총액의 RSI와 비트코인 도미넌스 RSI를 조합하여 만든 BTC Cap Dominance RSI 지표를 기반으로 만들어졌습니다. 이 전략의 컨셉은 비트코인 시가총액뿐만 아니라 비트코인 도미넌스를 조합함으로써 비트코인 시장 흐름을 잘 파악할 수 있도록 하는 것입니다.
BTC Cap Dominance (BCD) RSI는 다음과 같이 정의하였습니다.
BCD RSI = (BTC Cap RSI + BTC Dominance RSI) / 2
Case 1 (강세 장):
Cap RSI와 Dominance RSI 값 모두 높은 경우
Case 2 (횡보 장):
Cap RSI는 높지만 Dominance RSI는 낮은 경우
Cap RSI는 낮지만 Dominance RSI는 높은 경우
Case 3 (약세 장):
Cap RSI와 Dominance RSI 값 모두 낮은 경우
BCD RSI 값이 Bull level 위에서 캔들 마감할 경우 long 신호를 트리거하고 Bear level 아래에서 캔들 마감할 경우 short 신호를 트리거합니다.
(주의) 트레이딩뷰의 시가총액 심볼들 (CRYPTOCAP:TOTAL과 CRYPTOCAP:TOTAL2)이 2020년 1월부터 시작하였으므로 이 시점부터 전략 백테스팅이 가능한 점을 유의하십시오.
(주의) 이 전략은 실시간 BCD RSI 값이 나오지 않기 때문에 별도의 BCD RSI Index를 함께 사용하면 현재 값을 알 수 있어 롱숏 신호를 사전에 예측할 수 있으므로 함께 사용하기를 권장합니다.
전략의 추천 기본값 외에 "Use Combination of dominance RSI ?"를 체크하지 않는 경우 권장하는 값은 Length (14), Bull level (74), Bear level (25) 입니다.

RSI StrategyThis RSI strategy will allow you to go long when RSI is overbought and go short when RSI is oversold. You can also change the checked boxes to reverse this. Uncheck "Overbought Go Long & Oversold Go Short" and check "Overbought Go Short & Oversold Go Long" to use this reversed option.
You can also choose to use an ema filter as an additional qualifier for entry. Uncheck "No EMA Filter" and check "Use EMA Filter" if you want to use it.
Be sure to enter slippage and commission into the properties to give you realistic results.
I've also built in backtesting date ranges and the ability to trade only within certain times of day and have it close all trades at the end of that time frame. This is especially useful for day trading stocks. To specify a time from use the format 0930-1100 or whatever your trading hours will be. Check off "Enable Close Trade At End Of Time Frame" to close the trade at the end of your trading hours.
You can also specify a % based take profit and stop loss. Also keep in mind that the way this code is designed if you use the stop loss and/or take profit and it reaches either target and closes, then it will immediately re-enter if the condition for long or short entry is true.
Finally there's custom alert fields so you can send custom alert messages for strategy entry and exit for use with automated trading services. Simply enter your messages in the fields within the strategy properties and then put {{strategy.order.alert_message}} in your alert message body and it will dynamically pull in the appropriate message.

MA Bollinger Bands + RSI This script uses the standard deviation of a given moving average along with an RSI direction.
When: rsi crossover neutral line + price crossover lower deviation boundary => long
When: rsi crossunder neutral line + price crossunder upper deviation boundary => short

5min Williams Fractals scalping (3commas)Another strategy I'm learning Pine Script on. It is inspired by a MoneyZG youtube strategy called "Easy 5 Minute Scalping Strategy (Simple to Follow Scalping Trading Strategy)".
Again this is a one order per trade strategy compatible with the 3commas bot (works also with the free 3commas subscription). This strategy is based on the signals from Williams Fractals, taking the signals in reverse - red triangle indicates a bottom and hence we go long. The green triangle indicates a top so we go short. By default these signals are only accepted if they occur between the two Emas. However, you can also turn this off and when a WF signal comes in, only the current price has to be between the Emas. Stop loss is set to the current Ema slow and the take profit is a multiple of the distance to the slow ema.
Like previously I have added different filters as well as the ability to view essential things like the WF signal and Emas. I hope the script will help you to be more successful and if so it would be great if you could share here your setups, or tips on what would be good to refine to make it an even a more profitable strategy. Kind of a community approach so that we help each other out :).
Instructions for the 3commas connector:
1. First, you need to prepare 3commas Long/Short bots that will only listen to custom TV signals.
2. Inputs for the 3commas bot can be found at the end of the user inputs.
3. Once you have entered the required details into the inputs, turn on 3commas comments. They should appear on the chart (looks messy).
4. Now you can add the alert where you should paste the 3commas Webhook URL: 3commas.io
5. For the alert message text insert the placeholder {{strategy.order.comment}} and delete the rest.
6. Once the alert is saved, you can turn off those 3commas comments to have a clearer chart.
7. With a new alert, the bot and trade should launch.
In the near future I would like to publish more scripts that will carry similar elements as the first two, incl. compatibility with 3commas (I don't have access to another bot system). I will choose some strategies myself, but I will also be glad for some tips on what strategy would be good to do and is still missing here on Tradingview (short youtube videos or brief strategy manuals would be great).
Thanks and keep it up
PS: My screen values starting at Long Target Profit and ending at Pullback NOT greater than: 1.5; 1.5; 0; ON; 1; 2; OFF; 17; 36; ON; 0.05; ON; Chart; 14; 46; 50; 48.5; 51; OFF; 1; ON; 4; 2.

3RSI 3CCI BB 5orders DCA strategy+This strategy is just an attempt to find the indicator values for the trading bot service that I use (link in profile). Due to the use of the “request.security” function in the code, the indicators can be redrawn, but this is not important in history. The strategy used only 5 orders for the "DCA" - bot, located at the same distance in the price overlap range. I only use this strategy when trading in pairs against bitcoin.
Эта стратегия – просто попытка подобрать значения индикаторов для сервиса торговых ботов, который я использую (ссылка в профиле). Из-за использования в коде функции «request.security» возможна перерисовка индикаторов, но на истории это не важно. В стратегии использовано всего 5 ордеров для «DCA» - бота, находящихся на одинаковом расстоянии в диапазоне перекрытия цены. Я использую данную стратегию только при торговле в парах к биткоину.

Zendog V3 backtest DCA bot 3commasMAJOR UPDATE:
- Update to Pinescript v5
- MAJOR refactor for the logic of how orders are placed. BO order is placed when the condition is first encountered and we are not in a deal.
The extra SO orders (if based on price movement) are all placed on the next candle after BO order, instead of each being placed one after another.
Take profit (if percentage) and Stop loss are placed on the first candle after BO order because if BO and TP are on the same candle TV does not execute properly.
These changes should improve strategy accuracy when multiple prices are hit by the same candle.
- NEW FEATURE: Support to Stop deal using an external indicator (i.e. stop long deal when RSI > 80)
- NEW FEATURE: Support to trigger Safety orders using an external indicator (i.e. trigger each additional SO when RSI < 10, regardless of price movement)
The price movement logic may be implemented in the indicator that plots start / end signals. The SO size is calculated using the configuration of steps.
- NEW FEATURE: Safety order command for 3commas bot. This is implemented using Add funds in the quote currency (for pair BTCUSDT the quote currency is USDT)
The SO size is calculated using the configuration of steps, for exact order size (and price) use the built-in Steps table.
- NEW FEATURE: Addition of extra columns to the steps table: Required price for TP, Required % change for TP, Required % change for BEP (Breakeven point)
- Update to steps table to remove prices when Safety orders are not based on % price change
- The code is opensource. I will not be able to sustain merges for the script, but feel free to use and develop your own version and ping me on discord to review them
and maybe include in the original script

RSI Average Swing BotThis is a modified RSI version using as a source a big length(50 candles) and an average of all types of sources for candle calculations such as ohlc4, close, high, open, hlc3 and hl2.
In this case we are going to use a 0-1 scale for an easier calculation, where 0.5 is going to be our middle point.
Above 0.5 we consider a bullish possibility.
Below 0.5 we consider a bearish possibility.
I made a small example bot using that initial logic, together with 2 exit points for long or short positions.
If there are any questions, let me know !

MZ SRSI Strategy V1.0Strategy Introduction
This strategy starts from selection of 1st Moving Average from one of following:
SMA
EMA
DEMA
TEMA
LRC
WMA
MF
VAMA
TMA
HMA
JMA
Kijun v2
EDSMA
McGinley
Then it calculates the RSI of selected 1st Moving Average
In the end it calculates Moving Average of previously calculated RSI and for this purpose 2nd Moving Average is also selected from above list.
Cross of RSI and its Moving Average generates Strategy Alerts
Only long trades are enabled currently
Default Settings
I've set the default selection to the perfect options for 1D and 4h timeframes. You can modify both MAs selection and their length according to your selected timeframe.
Following default settings are used:
Heiken Ashi Candles are selected by default as source
1st Moving Average selection is set to LRC (Linear Regression Curve)
Length of 1st Moving Average is set to 50
RSI length is set to 2 because it is supposed to be fast
2nd Moving Average of RSI is set to TMA (Triangular Moving Average)
Length of 1st Moving Average is set to 5
Start date is set to 2011
Backtesting can also be done selecting %age of equity
Suggestions for Usage
Mostly winning trades have no prominent drawdown so losing trades can be abolished with Stoploss. Would soon add Stoploss, MTF and Takeprofit options in next version. Also if you want an alerts version of it then just comment below and would publish it later. I’ve found this strategy useful on 1D and 4h timeframes with described default settings.

Bollinger Band Breakout Positional Strategy- BN -15M This strategy consists of following criteria:
Buy:
1. Candle should have RSI is above 60 and Close above Bollinger band upper limit
2. Exit When candle is closed below 20MA
Sell:
1. Candle should have RSI is above 40 and Close below Bollinger band lower limit
2. Exit When candle is closed above 20MA
Checkout results.

RSI + MA StrategyHello, everyone!
We have just released an innovative strategy for TradingView. It allows you to facilitate the trading process when you have to use both indicators.
This strategy is:
User-friendly
Configurable
Equipped with the combination of Relative Strength Index (RSI) and Moving Average (MA) indicators
Designed with all required functions to manage positions
Features
The RSI+MA strategy can:
Identify entry points for Long and Short positions.
Depict RSI and MA values concerning each other.
Reduce visual congestion and import usability thanks to using a combo of 2 indicators.
Allow using pivot trading. The RSI+MA strategy will enter a Long position according to the Short position conditions. And vice versa.
Note! If you want to open a Long position, the RSI line should cross MA from top to bottom. If you want to open a Short position, RSI has to cross MA from bottom to top.
Parameters
We have equipped our strategy with more than 14 additional parameters. So, you can configure the EA according to your needs!
Inputs :
Use Reverse Trade — allows swapping Long and Short positions opening conditions.
Resolution — allows you to view an indicator with data on a higher or lower timeframe on the current chart.
RSI Length
RSI Source: Open, High, Low, Close, HL2, HLC3, OHLC4
Show MA — allows you to enable or disable MA displaying.
MA Length
MA Offset
Style:
RSI — RSI indicator line color and style settings.
MA — MA indicator line color and style configuration.
Upper Band — allows customizing line style, color, and RSI upper bound value.
Lower Band — allows you to customize line style, color, and RSI lower bound value.
Background — background color setting within the RSI upper and lower borders.
Precision — number of decimals for RSI values.
Note! Try RSI+MA on your demo account first before going live.

RSI StrategySimple way how to use RSI and MA indicators for trading.
What we use:
• RSI
• SMA calculated by RSI (title: SMA_RSI)
• Delta of RSI and SMA_RSI (title: delta)
• SMA calculated by delta of RSI and SMA & RSI (title: SMA_RSI2)
Logic:
Upon the fact that we use the difference between two indicators that have similar values ( RSI and SMA_RSI), we get number around zero. Next, result is smoothed by calculated the SMA . This is the blue/purple line that appears on the chart - SMA_RSI2.
The trade open when SMA_RSI2 cross over the threshold. The trade close when SMA_RSI2 cross under the threshold below.
Also, the usual EMA 200 is used as a filter, which you can switch on or switch off.

Supertrend + RSI Strategy [Alose]This strategy combines the best of both indicators (Supertrend & RSI).
As we know, Supertrend is excellent at finding changes in the market trend and thus finding the best entries, however in my opinion it has a great weakness and it is that it does not know how to find the best exit point.
For this reason I decided to combine it with the RSI that we know usually knows the highest and lowest rebound points of the price, thus managing to find the best exit point for the strategy.
The best thing about combining these 2 indicators is that our trades will obtain better profits in less time.
LONG ENTRY
When SuperTrend changes its direction and it is less than 0.
LONG EXIT
There are two ways to close the trade:
When RSI is overbought, you can choose the "Overbought Level " inside the strategy settings (Default: 72).
When SuperTrend changes its direction and it is grater than 0.
SHORT ENTRY (You can enable short entries in strategy settings)
When SuperTrend changes its direction and it is grater than 0.
LONG EXIT
There are two ways to close the trade:
When RSI is oversold, you can choose the "Oversold Level " inside the strategy settings (Default: 28).
When SuperTrend changes its direction and it is less than 0.

RSI StrategyThis RSI strategy is different than most in that it doesn't pick a buy signal based on the RSI rising above a specific number (usually 30). Instead, it creates a 14 day exponential moving average of the Relative Strength Index and uses the following two conditions together to trigger a buy:
Entry conditions:
Condition1: Rising of the RSI's moving average for (user defined) candles in a row
Condition 2: The RSI is < 70
The reasoning behind condition 1 is that we are trying to buy into a rising trend, the moving average helps to confirm the trend, whereas the RSI rising above a specific number (usually 30) gives us no real indication that the asset will increase and produces less wins overall. The reasoning behind condition 2 is to avoid buying at the top of a climb.
Exit conditions:
Condition 1: The RSI moving average is falling
Condition 2: Close < Trailing stop activation Level
Condition 3: We have at least (user defined) % profit
The reasoning behind sell condition 1 is a falling RSI moving average (down trend starting). The close has to be under the trailing stop activation level, if we've triggered the trailing stop, we want the trailing stop to do it's job and not exit the trade until the trailing stop takes us out. The reasoning behind condition 3 is to not exit without at least some profit (user defined).

Cumulative RSI StrategyI suppose nothing drives a point home like a 10+ year backtest! A couple of weeks ago I published a custom indicator called the Cumulative RSI. This indicator was straight out of chapter 9 of "Short Term Trading Strategies That Work." Today I am publishing a basic sample strategy in that uses the Cumulative RSI as its only entry and exit signals on a Nasdaq 100 leveraged index ETF (TQQQ). In this example, the indicator is being used as a longer term strategy with just 10% leverage over the account equity and a $25k start balance.
If I had it 10 years ago I would probably be retired! I'm sharing because I've found that it can provide an edge when determining exit/take profit points for trades. Many traders wait for a price reversal / trailing-stop to exit a trade when it starts losing. I've found that, using tools like the Cumulative RSI, you can achieve better exit points over the long term. Disclaimer: Even though this example significantly beats buy and hold, I wouldn't advise using it as a stand-alone strategy without significant additions/modifications to strategy and risk management functions.

RSI Overbought Oversold Divergence Strategy w/ Buy/Sell SignalsThis indicator is a copy of my RSI Overbought/Oversold Divergence Indicator with-Alerts
Only difference is that the alerts are disabled, instead it uses tradingviews strategy tester signals
If you want alerts just use the other indicator

Williams Fractals StrategyThis indicator made with using Williams Fractals, 20 50 100 Moving Averages and Relative Strength Index. You can easily find entry points by using Long (L), Short (S) signals.
Note : Settings are optimized for BTC:USDT Perpetual 15min TF. For use different pairs or TFs you may need to change settings.

TemaVWAPRSI StrategyExchange: Kraken
Timeframe: 5m
Pair: ETH/USD
If you use this for any other exchange or pair, you'll have to tweak the settings, most importantly are the trailing stop ticks. This strategy is currently in what I would call beta mode. It uses the volume weighted average price indicator, rate of change, two triple exponential moving averages and the relative strength index to find buy and sell signals.

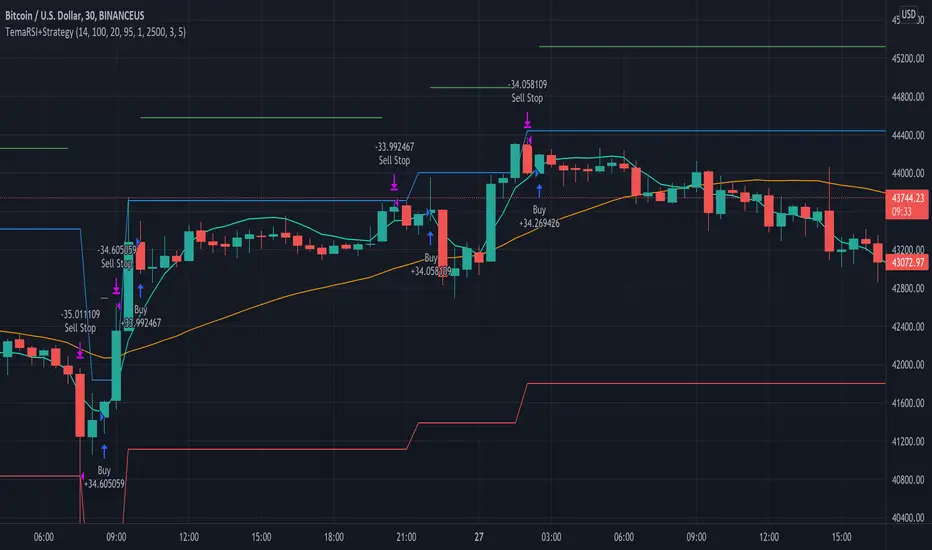
TemaRSI StrategyThis strategy uses a triple exponential moving average (Tema) and RSI to find buy points and uses stops, trailing stops and take profit to exit. Draft 1.
Take Profit On Trend (by BHD_Trade_Bot)The purpose of strategy is to detect long-term uptrend and short-term downtrend so that you can easy to take profit.
The strategy also using BHD unit to detect how big you win and lose, so that you can use this strategy for all coins without worry about it have different percentage of price change.
ENTRY
The buy order is placed on assets that have long-term uptrend and short-term downtrend:
- Long-term uptrend condition: ema200 is going up (rsi200 greater than 51)
- Short-term downtrend condition: 2 last candles are down price (use candlestick for less delay)
CLOSE
The sell order is placed when take profit or stop loss:
- Take profit: price increase 1 BHD unit
- Stop loss: price decrease 2 BHD units
The strategy use $15 and trading fee is 0.1% for each order. So that, in the real-life, if you are using trade bot, it will need $1500 for trading 100 coins at the same time.
Pro tip : The 1-hour time frame for altcoin/USDT has the best results on average.

PSAR + EMA/TEMA/RSI/OBVThe Parabolic Stop-and-Reservse (PSAR) is a trend indicator, intended to capture reversal signals and show entry and exit points. The PSAR is bullish when the PSAR is below the candle body (usually indicated by a dot) and bearish when the PSAR is above the candle body. The PSAR generally only moves in the direction of the trend, making it useful for markets with an upward or downward trend, as well as swing markets. It is weaker when the market it sideways, as it can be prone to frequent flips (bull-to-bear or vice versa) in markets where a predominant trend is not present.
In order to combat the tendency for rapid swings in the PSAR, it is commonly paired with a second indicator. Often, this is a moving average (MA) to confirm the PSAR signal. Here is a common example:
PSAR + 2 EMAs: A trade would consider entering long when the PSAR is bullish and the fast EMA is above the short EMA.
PSAR + 3 EMAs: As above, but the trader could also add a very long EMA (200, for example) and use that as an additional filter.
In addition to using EMA, other MAs can be used and may be more appropriate to certain instruments and timeframes. Using TEMA, for example, may result in less lag but introduce more noise. Likewise, the Ehler's MAMA is an option.
Some traders use other indicators as PSAR confirmation signals, such as the relative strength index (RSI) on on-balance volume (OBV). The strategy is similar:
bullish PSAR + RSI oversold = consider long entry
bullish PSAR + OBV oscillator > 0 = consider long entry
The strategy presented here is based on my PSAR + EMA + TEMA study. Any of the above strategies are supported by this script:
1. The PSAR is the primary signal.
2. Confirmation is provided by any of the following: EMA , TEMA , Ehler's MAMA , RSI , or OBV.
3. You may use a third EMA (set to 200 as the default) to filter entries -- if used, the strategy will only show signals if the price is above the third (additional) EMA .
For example, a normal long signal would be a bullish PSAR + fast EMA > slow EMA + price > ema 200.
In addition, you may use a SL, which is set to the PSAR dots shown. You may also limit the backtesting dates. (Please note in the chart above, I do not have a limit on the trading dates. I believe this exaggerates the success of the strategy, but the house rules demand I not limit the timeframe to show you a more accurate picture.)

EMR Strategy [H1 Backtesting]EMR Strategy base on EMA, MACD and RSI to supply signal on time frame H1.
Details of Rule as below:
===
1.EMA
+ Time frame: H1
+ Periods: 25, 100 (~ EMA 25 H4), 600 (~ EMA 25 D1)
===
2.MACD
+ Time frame: H1
+ Periods: 12,26,9
===
3.RSI
+ Time frame: H1
+ Periods: 14
===
4.Trading Rule
4.1.Long Position
+ MACD>0 and RSI>50 and close price moving above EMA 25
+ Close price crossed EMA 100 or crossed EMA 600 at the first time
4.2.Short Position
+ MACD<0 and RSI<50 and close price moving below EMA 25
+ Close price crossed EMA 100 or crossed EMA 600 at the first time
===
5.Money Management
+ This strategy concentrate into winrate.
+ So use trailing stop to protect your profits.
+ And use stoploss to avoid big loss on trades.
