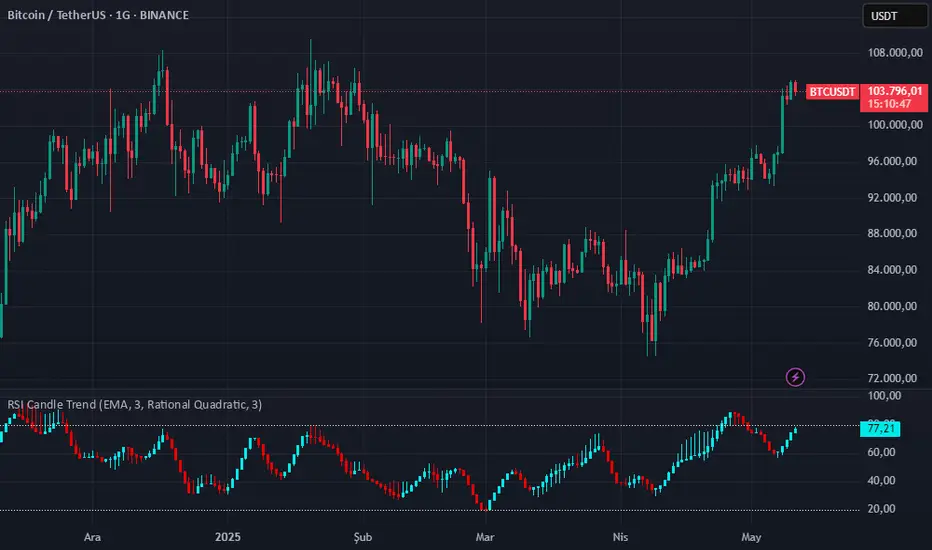
RSI Candle Trend🎯 Purpose:
This TradingView script is designed to visualize trend strength using RSI values as candle data, instead of traditional price candles. It transforms RSI data into custom candles using various smoothing and filtering methods (like Heikin-Ashi, Linear Regression, Rational Quadratic Filter, or McGinley Dynamic). It allows traders to:
📌Track RSI-based momentum using visual candle representation
📌Apply advanced smoothing/filters to the RSI to reduce noise
📌Highlight candle trend strength using dynamic coloring
📌Identify overbought/oversold zones using reference lines (RSI 80 and 20)
🧩 How It Works:
It calculates RSI values for open, high, low, close prices.
These RSI values are then optionally smoothed with user-selected moving averages (EMA, SMA, etc.).
Depending on the selected mode (Normal, Heikin-Ashi, Linear, Rational Quadratic), the RSI values are transformed into synthetic candles.
Candles are colored cyan (uptrend) or red (downtrend) based on RSI movement.
⚙️ Key Inputs:
Method: Type of moving average to smooth the RSI (e.g. EMA, SMA, VWMA, etc.)
Length: Length for RSI and smoothing filters
Candle: Type of candle transformation (Normal, Heikin-Ashi, Linear, Rational Quadratic)
Rational Quadratic: Parameter for the Rational Quadratic smoothing method
📊 Outputs:
Custom candles plotted using RSI-transformed values
Candle colors based on RSI strength:
Cyan for strong bullish RSI movement
Red for strong bearish RSI movement
Horizontal lines at RSI levels 80 and 20 (overbought/oversold)
🧠 Why Use This Indicator?
Unlike traditional RSI indicators that show a line, this tool:
Converts RSI into candle-style visualization
Helps traders visually interpret trend strength, reversals, or continuation patterns
Offers more refined control over RSI behavior and filtering
Provides a unique blend of momentum and candle analysis
❗Important Note:
This script is provided for educational purposes and does not constitute financial advice. Traders and investors should conduct their research and analysis before making any trading decisions.
Relative Strength Index (RSI)
AP IFTCCIv2/IFTStoch/IFTRSI Multi-TimeframeMulti-Timeframe IFT-CCI/Stoch/RSI Composite
This enhanced indicator combines three powerful oscillators—Inverse Fisher Transform (IFT) versions of the Commodity Channel Index (CCI), Stochastic, and Relative Strength Index (RSI)—into a unified multi-timeframe analysis tool. Originally developed by John Ehlers (pioneer of cyclical analysis and signal processing in trading systems) and adapted by KIVANC (@fr3762), this version adds dual-timeframe capability to compare indicator values across different chart resolutions.
Key Features:
Triple Oscillator Composite
IFT-CCI: Smoothed CCI values transformed via Ehlers' Inverse Fisher Transform (blue-gold)
IFT-Stochastic: Classic stochastic oscillator processed through IFT (blue)
IFT-RSI: RSI oscillator converted to IFT format (magenta)
Composite Average Line: Combined average of all three indicators (green)
Multi-Timeframe Analysis
Compare primary and secondary timeframes (e.g., 1H vs. 4H, daily vs. weekly)
Primary timeframe plots use solid lines with 80% opacity
Secondary timeframe (optional) uses dashed/circle markers with 40% opacity
Key Levels
Overbought (+0.75) and oversold (-0.75) reference lines
Zero-centerline for momentum direction bias
Applications:
Trend Confirmation: Align higher timeframe signals with lower timeframe entries
Divergence Detection: Spot inter-timeframe discrepancies in momentum
Regime Filter: Use higher timeframe composite values to filter trades
Technical Basis:
Inverse Fisher Transform: Compresses oscillator values into bounded (-1 to +1) range while emphasizing extreme moves
Dual WMA Smoothing: Combines initial calculation smoothing (WMA1) with final output smoothing (WMA2)
Exponential Scaling: (e^2x - 1)/(e^2x + 1) formula converts Gaussian-like distributions to bounded outputs
Credits:
Original Concept: John Ehlers (IFT methodology, cyclical analysis foundations)
Initial Implementation: KIVANC (@fr3762 on Twitter) for the base IFT-CCI/Stoch/RSI script
Multi-Timeframe Adaptation: for cross-resolution analysis capabilities
This tool is particularly effective for traders seeking to align multiple timeframes while using Ehlers' noise-reduction techniques. The composite average line provides a consensus view, while the individual oscillators help identify component strength/weakness.

Adaptive Volume-Weighted RSI (AVW-RSI)Concept Summary
The AVW-RSI is a modified version of the Relative Strength Index (RSI), where each price change is weighted by the relative trading volume for that period. This means periods of high volume (typically driven by institutions or “big money”) have a greater influence on the RSI calculation than periods of low volume.
Why AVW-RSI Helps Traders
Avoids Weak Signals During Low Volume
Standard RSI may show overbought/oversold zones even during low-volume periods (e.g., during lunch hours or after news).
AVW-RSI gives less weight to these periods, avoiding misleading signals.
Amplifies Strong Momentum Moves
If RSI is rising during high volume, it's more likely driven by institutional buying—AVW-RSI reflects that stronger by weighting the RSI component.
Filters Out Retail Noise
By prioritizing high-volume candles, it naturally discounts fakeouts caused by thin markets or retail-heavy moves.
Highlights Institutional Entry/Exit
Useful for spotting hidden accumulation/distribution that classic RSI would miss.
How It Works (Calculation Logic)
Traditional RSI Formula Recap
RSI = 100 - (100 / (1 + RS))
RS = Average Gain / Average Loss (over N periods)
Modified Step – Apply Volume Weight
For each period
Gain_t = max(Close_t - Close_{t-1}, 0)
Loss_t = max(Close_{t-1} - Close_t, 0)
Weight_t = Volume_t / AvgVolume(N)
WeightedGain_t = Gain_t * Weight_t
WeightedLoss_t = Loss_t * Weight_t
Weighted RSI
AvgWeightedGain = SMA(WeightedGain, N)
AvgWeightedLoss = SMA(WeightedLoss, N)
RS = AvgWeightedGain / AvgWeightedLoss
AVW-RSI = 100 - (100 / (1 + RS))
Visual Features on Chart
Line Color Gradient
Color gets darker as volume weight increases, signaling stronger conviction.
Overbought/Oversold Zones
Traditional: 70/30
Suggested AVW-RSI zones: Use dynamic thresholds based on historical volatility (e.g., 80/20 for high-volume coins).
Volume Spike Flags
Mark RSI turning points that occurred during volume spikes with a special dot/symbol.
Trading Strategies with AVW-RSI
1. Weighted RSI Divergence
Regular RSI divergence becomes more powerful when volume is high.
AVW-RSI divergence with volume spike is a strong signal of reversal.
2. Trend Confirmation
RSI crossing above 50 during rising volume is a good entry signal.
RSI crossing below 50 with high volume is a strong exit or short trigger.
3. Breakout Validation
Price breaking resistance + AVW-RSI > 60 with volume = Confirmed breakout.
Price breaking but AVW-RSI < 50 or on low volume = Potential fakeout.
Example Use Case
Stock XYZ is approaching a resistance zone. A trader sees:
Standard RSI: 65 → suggests strength.
Volume is 3x the average.
AVW-RSI: 78 → signals strong momentum with institutional backing.
The trader enters confidently, knowing this isn't just low-volume hype.
Limitations / Tips
Works best on liquid assets (Forex majors, large-cap stocks, BTC/ETH).
Should be used alongside price action and volume analysis—not standalone.
Periods of extremely high volume (news events) might need smoothing to avoid spikes.

Adaptive RSI | Lyro RSThe Adaptive RSI | 𝓛𝔂𝓻𝓸 𝓡𝓢 indicator enhances the traditional Relative Strength Index (RSI) by integrating adaptive smoothing techniques and dynamic bands. This design aims to provide traders with a nuanced view of market momentum, highlighting potential trend shifts and overbought or oversold conditions.
Key Features
Adaptive RSI Calculation: Combines fast and slow Exponential Moving Averages (EMAs) of the RSI to capture momentum shifts effectively.
Dynamic Bands: Utilizes a smoothed standard deviation approach to create upper and lower bands around the adaptive RSI, aiding in identifying extreme market conditions.
Signal Line: An additional EMA of the adaptive RSI serves as a signal line, assisting in confirming trend directions.
Customizable Color Schemes: Offers multiple predefined color palettes, including "Classic," "Mystic," "Accented," and "Royal," with an option for users to define custom colors for bullish and bearish signals.
How It Works
Adaptive RSI Computation: Calculates the difference between fast and slow EMAs of the RSI, producing a responsive oscillator that adapts to market momentum.
Band Formation: Applies a smoothing factor to the standard deviation of the adaptive RSI, generating dynamic upper and lower bands that adjust to market volatility.
Signal Line Generation: Computes an EMA of the adaptive RSI to act as a signal line, providing additional confirmation for potential entries or exits.
Visualization: Plots the adaptive RSI as color-coded columns, with colors indicating bullish or bearish momentum. The dynamic bands are filled to visually represent overbought and oversold zones.
How to Use
Identify Momentum Shifts: Observe crossovers between the adaptive RSI and the signal line to detect potential changes in trend direction.
Spot Overbought/Oversold Conditions: Monitor when the adaptive RSI approaches or breaches the dynamic bands, signaling possible market extremes.
Customize Visuals: Select from predefined color palettes or define custom colors to align the indicator's appearance with personal preferences or chart themes.
Customization Options
RSI and EMA Lengths: Adjust the lengths of the RSI, fast EMA, slow EMA, and signal EMA to fine-tune the indicator's sensitivity.
Band Settings: Modify the band length, multiplier, and smoothing factor to control the responsiveness and width of the dynamic bands.
Color Schemes: Choose from predefined color modes or enable custom color settings to personalize the indicator's appearance.
⚠️ DISCLAIMER ⚠️: This indicator alone is not reliable and should be combined with other indicator(s) for a stronger signal.
RSI-EMA-Crossing with Donchian-Stop-LossThe Donchian RSI Indicator is a visual tool that combines momentum and trend analysis to identify high-quality long opportunities based on RSI crossovers, price action, and Donchian channel dynamics.
How It Works
Momentum Signal: A bullish RSI crossover is detected when the RSI crosses above its moving average.
Trend Filter: A signal is only valid if the crossover occurs while the price is above its moving average – filtering out entries against the prevailing trend.
Signal Candle: The high of the crossover candle is stored.
Entry Trigger: A valid signal occurs when a later candle closes above that signal high.
Stop-Loss (Visual Only)
The lower band of the Donchian Channel acts as a visual reference for a dynamic stop-loss level.
Features
Customizable RSI, Donchian Channel, and moving average lengths
Selectable MA types: SMA, EMA, WMA, VWMA, HMA
Signal candle highlighted (yellow background)
Entry points labeled on the chart
Price MA and Donchian Channel plotted
Trend filter improves signal quality by confirming upward bias
Use Case
Designed for swing and position traders
Optimized for use on daily or 4H charts

C&B Auto MK5C&B Auto MK5.2ema BullBear
Overview
The C&B Auto MK5.2ema BullBear is a versatile Pine Script indicator designed to help traders identify bullish and bearish market conditions across various timeframes. It combines Exponential Moving Averages (EMAs), Relative Strength Index (RSI), Average True Range (ATR), and customizable time filters to generate actionable signals. The indicator overlays on the price chart, displaying EMAs, a dynamic cloud, scaled RSI levels, bull/bear signals, and market condition labels, making it suitable for swing trading, day trading, or scalping in trending or volatile markets.
What It Does
This indicator generates bull and bear signals based on the interaction of two EMAs, filtered by RSI thresholds, ATR-based volatility, a 50/200 EMA trend filter, and user-defined time windows. It adapts to market volatility by adjusting EMA lengths and RSI thresholds. A dynamic cloud highlights trend direction or neutral zones, with candlestick coloring in neutral conditions. Market condition labels (current and historical) provide real-time trend and volatility context, displayed above the chart.
How It Works
The indicator uses the following components:
EMAs: Two EMAs (short and long) are calculated on a user-selected timeframe (1, 5, 15, 30, or 60 minutes). Their crossover or crossunder triggers potential bull/bear signals. EMA lengths adjust based on volatility (e.g., 10/20 for volatile markets, 5/10 for non-volatile).
Dynamic Cloud: The area between the EMAs forms a cloud, colored green for bullish trends, red for bearish trends, or a user-defined color (default yellow) for neutral zones (when EMAs are close, determined by an ATR-based threshold). Users can widen the cloud for visibility.
RSI Filter: RSI is scaled to price levels and plotted on the chart (optional). Signals are filtered to ensure RSI is within volatility-adjusted bull/bear thresholds and not in overbought/oversold zones.
ATR Volatility Filter: An optional filter ensures signals occur during sufficient volatility (ATR(14) > SMA(ATR, 20)).
50/200 EMA Trend Filter: An optional filter restricts bull signals to bullish trends (50 EMA > 200 EMA) and bear signals to bearish trends (50 EMA < 200 EMA).
Time Filter: Signals are restricted to a user-defined UTC time window (default 9:00–15:00), aligning with active trading sessions.
Market Condition Labels: Labels above the chart display the current trend (Bullish, Bearish, Neutral) and optionally volatility (e.g., “Bullish Volatile”). Up to two historical labels persist for a user-defined number of bars (default 5) to show recent trend changes.
Visual Aids: Bull signals appear as green triangles/labels below the bar, bear signals as red triangles/labels above. Candlesticks in neutral zones are colored (default yellow).
The indicator ensures compatibility with standard chart types (e.g., candlestick or bar charts) to produce realistic signals, avoiding non-standard types like Heikin Ashi or Renko.
How to Use It
Add to Chart: Apply the indicator to a candlestick or bar chart on TradingView.
Configure Settings:
Timeframe: Choose a timeframe (1, 5, 15, 30, or 60 minutes) to match your trading style.
Filters:
Enable/disable the ATR volatility filter to focus on high-volatility periods.
Enable/disable the 50/200 EMA trend filter to align signals with the broader trend.
Enable the time filter and set custom UTC hours/minutes (default 9:00–15:00).
Cloud Settings: Adjust the cloud width, neutral zone threshold, color, and transparency.
EMA Colors: Use default trend-based colors or set custom colors for short/long EMAs.
RSI Display: Toggle the scaled RSI and its thresholds, with customizable colors.
Signal Settings: Toggle bull/bear labels and set signal colors.
Market Condition Labels: Toggle current/historical labels, include/exclude volatility, and adjust decay period.
Interpret Signals:
Bull Signal: A green triangle or “Bull” label below the bar indicates potential bullish momentum (EMA crossover, RSI above bull threshold, within time window, passing filters).
Bear Signal: A red triangle or “Bear” label above the bar indicates potential bearish momentum (EMA crossunder, RSI below bear threshold, within time window, passing filters).
Neutral Zone: Yellow candlesticks and cloud (if enabled) suggest a lack of clear trend; consider range-bound strategies or avoid trading.
Market Condition Labels: Check labels above the chart for real-time trend (Bullish, Bearish, Neutral) and volatility status to confirm market context.
Monitor Context: Use the cloud, RSI, and labels to assess trend strength and volatility before acting on signals.
Unique Features
Volatility-Adaptive EMAs: Automatically adjusts EMA lengths based on ATR to suit volatile or non-volatile markets, reducing manual configuration.
Neutral Zone Detection: Uses an ATR-based threshold to identify low-trend periods, helping traders avoid choppy markets.
Scaled RSI Visualization: Plots RSI and thresholds directly on the price chart, simplifying momentum analysis relative to price.
Flexible Time Filtering: Supports precise UTC-based trading windows, ideal for day traders targeting specific sessions.
Historical Market Labels: Displays recent trend changes (up to two) with a decay period, providing context for market shifts.
50/200 EMA Trend Filter: Aligns signals with the broader market trend, enhancing signal reliability.
Notes
Use on standard candlestick or bar charts to ensure accurate signals.
Test the indicator on a demo account to optimize settings for your market and timeframe.
Combine with other analysis (e.g., support/resistance, volume) for better decision-making.
The indicator is not a standalone system; use it as part of a broader trading strategy.
Limitations
Signals may lag in fast-moving markets due to EMA-based calculations.
Neutral zone detection may vary in extremely volatile or illiquid markets.
Time filters are UTC-based; ensure your platform’s timezone settings align.
This indicator is designed for traders seeking a customizable, trend-following tool that adapts to volatility and provides clear visual cues with robust filtering for bullish and bearish market conditions.

Triple Stoch and RSI (4 assets)4 Hour Green Dots -
This indicator looks at four different assets and shows when the RSI and 3 different stochastic RSI levels are all oversold.
You can optionally add Red dots when they are all overbought but doesn't seem to be as accurate.
The assets and levels are all customizable.

Fibonacci - RSI OscillatorIndicator Overview
The Fibonacci RSI Oscillator calculates the Relative Strength Index (RSI) based on a dynamically adjusting level derived from recent price action and a fixed Fibonacci ratio (0.236). This differs from standard RSI, which is calculated directly on the closing price. The objective is to measure momentum relative to a level that adapts to recent peaks and valleys.
Core Calculation Mechanism
Peak/Valley Tracking: The script identifies the highest high (state_peak) and lowest low (state_valley) since the last detected change in short-term directional bias (state_dir).
Dynamic Level Calculation: A level (state_dyn_level) is calculated using a fixed 0.236 Fibonacci ratio relative to the tracked peak and valley:
If bias is up: state_dyn_level = state_peak - (state_peak - state_valley) * 0.236
If bias is down: state_dyn_level = state_valley + (state_peak - state_valley) * 0.236
This level adjusts automatically when a new peak or valley is established in the current directional bias. If price crosses the dynamic level against the current bias, the bias flips, and the level recalculates.
Optional Source Smoothing: The calculated state_dyn_level can optionally be smoothed using a user-selected moving average (SMA, EMA, WMA, HMA, RMA) before the RSI calculation.
RSI Calculation: The standard RSI formula is applied to the (optionally smoothed) state_dyn_level series to produce the primary oscillator value (val_primary_osc).
Signal Line: A moving average (type and length configurable) is calculated on the val_primary_osc to generate the val_sig_line.
Key Features & Components
Dynamic Fibonacci Level: The core input for the RSI calculation, based on recent peaks/valleys and the 0.236 ratio.
Fibonacci Level RSI: The primary oscillator line representing the RSI of the dynamic level.
Signal Line: A moving average of the primary RSI line.
Overbought/Oversold Levels: User-defined threshold lines.
Optional Source Smoothing: Configurable MA smoothing applied to the dynamic level before RSI calculation.
Gradient RSI Color : Option to color the primary RSI line based on its value relative to OB/Mid/OS levels.
Zone & OB/OS Fills: Visual fills for the 0-50 / 50-100 zones and specific fills when the RSI enters OB/OS territory.
Background Gradient: Optional vertical background color gradient based on the RSI's position between 0 and 100.
Configurable Parameters: Inputs for lengths, MA types, OB/OS levels, colors, line widths, and feature toggles.
Visual Elements Explained
Fibonacci Level RSI Line: The main plotted oscillator (color/gradient/width configurable).
Signal Line: The moving average of the RSI line (color/width/MA type configurable).
OB/OS Lines: Horizontal lines plotted at the set OB/OS levels (color/width configurable).
Mid-Line (50): Horizontal line plotted at 50 (color/width configurable).
Zone Fills:
Background fill between 0-50 and 50-100 (colors configurable).
Conditional fill between the RSI line and the 50 line when RSI > OB level or RSI < OS level (colors configurable).
Background Gradient: Optional background coloring where transparency varies vertically with the RSI level (base colors and transparency range configurable).
Configuration Options
Users can adjust the following parameters in the indicator settings:
Smoothing: Enable/disable dynamic level smoothing; set length and MA type.
RSI: Set the RSI calculation length.
Signal Line: Set the signal line smoothing length and MA type.
Levels: Define Overbought and Oversold numeric thresholds.
Visuals: Configure colors and widths for the RSI line, signal line, OB/OS lines, mid-line, zone fills, and OB/OS fills.
Gradients: Enable/disable and configure colors for the RSI line gradient; enable/disable and configure colors/transparency for the background gradient.
Interpretation Notes
The oscillator reflects the momentum of the dynamic Fibonacci level, not directly the price. Divergences, OB/OS readings, and signal line crossovers should be interpreted in this context.
The behavior may differ from standard RSI, potentially offering a smoother output or highlighting different momentum patterns depending on market structure and volatility.
As with any indicator, signals should be used in conjunction with other analysis methods and risk management practices. It is not designed as a standalone trading system.
Risk Disclaimer:
Trading involves significant risk. This indicator is provided for analytical purposes only and does not constitute financial advice. Past performance is not indicative of future results. Use sound risk management practices and never trade with capital you cannot afford to lose.

MTF Stochastic RSIOverview: MTF Stochastic RSI
is a momentum-tracking tool that plots the Stochastic RSI oscillator for up to four user-
defined timeframes on a single panel. It provides a compact yet powerful view of how
momentum is aligning or diverging across different timeframes, making it suitable for both
scalpers and swing traders looking for multi-timeframe confirmation.
What it does:
Calculates Stochastic RSI values using the RSI of price as the base input and applies
smoothing for stability.
Aggregates and displays the values for four customizable TF (e.g., 5min, 15min, 1h, 4h).
Highlights potential support and resistance zones in the oscillator space using adaptive zone
logic.
Optionally draws dynamic support/resistance zone lines in the oscillator space based on
historical turning points.
How it works:
Each timeframe uses the same RSI and Stoch calculation settings but runs independently via
the request.security() function.
Stochastic RSI is calculated by first applying the RSI to price, then applying a stochastic
formula on the RSI values, and finally smoothing the %K output.
Adaptive overbought and oversold thresholds adjust based on ATR-based volatility and simple
trend filtering (e.g., price vs EMA).
When a crossover above the oversold zone or a crossunder below the overbought zone
occurs, the script checks for proximity to previously stored zones and either adjusts or
records a new one.
These zones are stored and re-plotted as dotted support/resistance levels within the
oscillator space.
What it’s based on:
The indicator builds upon traditional Stochastic RSI by applying it to multiple timeframes in
parallel.
Zone detection logic is inspired by the idea of oscillator-based support/resistance levels.
Volatility-adjusted thresholds are based on ATR (Average True Range) to make the
overbought/oversold zones responsive to market conditions.
How to use it:
Look for alignment across timeframes (e.g., all four curves pushing into the overbought
region suggests strong trend continuation).
Reversal risk increases when one or more higher timeframes are diverging or showing signs of
cooling while lower timeframes are still extended.
Use the zone lines as soft support/resistance references within the oscillator—retests of
these zones can indicate strong reversal opportunities or continuation confirmation.
This script is provided for educational and informational purposes only. It does not constitute financial advice, trading recommendations, or an offer to buy or sell any financial instrument. Always perform your own due diligence, use proper risk management, and consult a qualified financial professional before making any trading decisions. Past performance does not guarantee future results. Use this tool at your own discretion and risk.

COT3 - Flip Strength Index - Invincible3This indicator uses the TradingView COT library to visualize institutional positioning and potential sentiment or trend shifts. It compares the long% vs short% of commercial and non-commercial traders for both Pair A and Pair B, helping traders identify trend strength, market overextension, and early reversal signals.
🔷 COT RSI
The COT RSI normalizes the net positioning difference between non-commercial and commercial traders over (N=13, 26, and 52)-week periods. It ranges from 0 to 100, highlighting when sentiment is at bullish or bearish extremes.
COT RSI (N)= ((NC - C)−min)/(max-min) x100
🟡 COT Index
The COT Index tracks where the current non-commercial net position lies within its 1-year and 3-year historical range. It reflects institutional accumulation or distribution phases.
Strength represents the magnitude of that positioning bias, visualized through normalized RSI-style metrics.
COT Index (N)= (NC net)/(max-min) x100
🔁 Flip Detection
Flip refers to the crossovers between long% and short%, indicating a change in directional bias among trader groups. When long positions exceed shorts (or vice versa), it signals a possible market flip in sentiment or trend.
For example, Pair B commercial flip is calculated as:
Long% = (Long/Open Interest)×100
Short% = (Short/Open Interest)×100
Flip = Long%−Short%
A bullish flip occurs when long% overtakes short%, and vice versa for a bearish flip. These flips often precede price trend changes or confirm sentiment breakouts.
Flip captures how far current positioning deviates from historical norms — highlighting periods of institutional overconfidence or exhaustion, often leading to significant market turns.
This combination offers a multi-layered edge for identifying when smart money is flipping direction, and whether that flip has strong conviction or is likely to fade.
..........................................................................................................................................................

RSI Full Forecast [Titans_Invest]RSI Full Forecast
Get ready to experience the ultimate evolution of RSI-based indicators – the RSI Full Forecast, a boosted and even smarter version of the already powerful: RSI Forecast
Now featuring over 40 additional entry conditions (forecasts), this indicator redefines the way you view the market.
AI-Powered RSI Forecasting:
Using advanced linear regression with the least squares method – a solid foundation for machine learning - the RSI Full Forecast enables you to predict future RSI behavior with impressive accuracy.
But that’s not all: this new version also lets you monitor future crossovers between the RSI and the MA RSI, delivering early and strategic signals that go far beyond traditional analysis.
You’ll be able to monitor future crossovers up to 20 bars ahead, giving you an even broader and more precise view of market movements.
See the Future, Now:
• Track upcoming RSI & RSI MA crossovers in advance.
• Identify potential reversal zones before price reacts.
• Uncover statistical behavior patterns that would normally go unnoticed.
40+ Intelligent Conditions:
The new layer of conditions is designed to detect multiple high-probability scenarios based on historical patterns and predictive modeling. Each additional forecast is a window into the price's future, powered by robust mathematics and advanced algorithmic logic.
Full Customization:
All parameters can be tailored to fit your strategy – from smoothing periods to prediction sensitivity. You have complete control to turn raw data into smart decisions.
Innovative, Accurate, Unique:
This isn’t just an upgrade. It’s a quantum leap in technical analysis.
RSI Full Forecast is the first of its kind: an indicator that blends statistical analysis, machine learning, and visual design to create a true real-time predictive system.
⯁ SCIENTIFIC BASIS LINEAR REGRESSION
Linear Regression is a fundamental method of statistics and machine learning, used to model the relationship between a dependent variable y and one or more independent variables 𝑥.
The general formula for a simple linear regression is given by:
y = β₀ + β₁x + ε
β₁ = Σ((xᵢ - x̄)(yᵢ - ȳ)) / Σ((xᵢ - x̄)²)
β₀ = ȳ - β₁x̄
Where:
y = is the predicted variable (e.g. future value of RSI)
x = is the explanatory variable (e.g. time or bar index)
β0 = is the intercept (value of 𝑦 when 𝑥 = 0)
𝛽1 = is the slope of the line (rate of change)
ε = is the random error term
The goal is to estimate the coefficients 𝛽0 and 𝛽1 so as to minimize the sum of the squared errors — the so-called Random Error Method Least Squares.
⯁ LEAST SQUARES ESTIMATION
To minimize the error between predicted and observed values, we use the following formulas:
β₁ = /
β₀ = ȳ - β₁x̄
Where:
∑ = sum
x̄ = mean of x
ȳ = mean of y
x_i, y_i = individual values of the variables.
Where:
x_i and y_i are the means of the independent and dependent variables, respectively.
i ranges from 1 to n, the number of observations.
These equations guarantee the best linear unbiased estimator, according to the Gauss-Markov theorem, assuming homoscedasticity and linearity.
⯁ LINEAR REGRESSION IN MACHINE LEARNING
Linear regression is one of the cornerstones of supervised learning. Its simplicity and ability to generate accurate quantitative predictions make it essential in AI systems, predictive algorithms, time series analysis, and automated trading strategies.
By applying this model to the RSI, you are literally putting artificial intelligence at the heart of a classic indicator, bringing a new dimension to technical analysis.
⯁ VISUAL INTERPRETATION
Imagine an RSI time series like this:
Time →
RSI →
The regression line will smooth these values and extend them n periods into the future, creating a predicted trajectory based on the historical moment. This line becomes the predicted RSI, which can be crossed with the actual RSI to generate more intelligent signals.
⯁ SUMMARY OF SCIENTIFIC CONCEPTS USED
Linear Regression Models the relationship between variables using a straight line.
Least Squares Minimizes the sum of squared errors between prediction and reality.
Time Series Forecasting Estimates future values based on historical data.
Supervised Learning Trains models to predict outputs from known inputs.
Statistical Smoothing Reduces noise and reveals underlying trends.
⯁ WHY THIS INDICATOR IS REVOLUTIONARY
Scientifically-based: Based on statistical theory and mathematical inference.
Unprecedented: First public RSI with least squares predictive modeling.
Intelligent: Built with machine learning logic.
Practical: Generates forward-thinking signals.
Customizable: Flexible for any trading strategy.
⯁ CONCLUSION
By combining RSI with linear regression, this indicator allows a trader to predict market momentum, not just follow it.
RSI Full Forecast is not just an indicator — it is a scientific breakthrough in technical analysis technology.
⯁ Example of simple linear regression, which has one independent variable:
⯁ In linear regression, observations ( red ) are considered to be the result of random deviations ( green ) from an underlying relationship ( blue ) between a dependent variable ( y ) and an independent variable ( x ).
⯁ Visualizing heteroscedasticity in a scatterplot against 100 random fitted values using Matlab:
⯁ The data sets in the Anscombe's quartet are designed to have approximately the same linear regression line (as well as nearly identical means, standard deviations, and correlations) but are graphically very different. This illustrates the pitfalls of relying solely on a fitted model to understand the relationship between variables.
⯁ The result of fitting a set of data points with a quadratic function:
_________________________________________________
🔮 Linear Regression: PineScript Technical Parameters 🔮
_________________________________________________
Forecast Types:
• Flat: Assumes prices will remain the same.
• Linreg: Makes a 'Linear Regression' forecast for n periods.
Technical Information:
ta.linreg (built-in function)
Linear regression curve. A line that best fits the specified prices over a user-defined time period. It is calculated using the least squares method. The result of this function is calculated using the formula: linreg = intercept + slope * (length - 1 - offset), where intercept and slope are the values calculated using the least squares method on the source series.
Syntax:
• Function: ta.linreg()
Parameters:
• source: Source price series.
• length: Number of bars (period).
• offset: Offset.
• return: Linear regression curve.
This function has been cleverly applied to the RSI, making it capable of projecting future values based on past statistical trends.
______________________________________________________
______________________________________________________
⯁ WHAT IS THE RSI❓
The Relative Strength Index (RSI) is a technical analysis indicator developed by J. Welles Wilder. It measures the magnitude of recent price movements to evaluate overbought or oversold conditions in a market. The RSI is an oscillator that ranges from 0 to 100 and is commonly used to identify potential reversal points, as well as the strength of a trend.
⯁ HOW TO USE THE RSI❓
The RSI is calculated based on average gains and losses over a specified period (usually 14 periods). It is plotted on a scale from 0 to 100 and includes three main zones:
• Overbought: When the RSI is above 70, indicating that the asset may be overbought.
• Oversold: When the RSI is below 30, indicating that the asset may be oversold.
• Neutral Zone: Between 30 and 70, where there is no clear signal of overbought or oversold conditions.
______________________________________________________
______________________________________________________
⯁ ENTRY CONDITIONS
The conditions below are fully flexible and allow for complete customization of the signal.
______________________________________________________
______________________________________________________
🔹 CONDITIONS TO BUY 📈
______________________________________________________
• Signal Validity: The signal will remain valid for X bars .
• Signal Sequence: Configurable as AND or OR .
📈 RSI Conditions:
🔹 RSI > Upper
🔹 RSI < Upper
🔹 RSI > Lower
🔹 RSI < Lower
🔹 RSI > Middle
🔹 RSI < Middle
🔹 RSI > MA
🔹 RSI < MA
📈 MA Conditions:
🔹 MA > Upper
🔹 MA < Upper
🔹 MA > Lower
🔹 MA < Lower
📈 Crossovers:
🔹 RSI (Crossover) Upper
🔹 RSI (Crossunder) Upper
🔹 RSI (Crossover) Lower
🔹 RSI (Crossunder) Lower
🔹 RSI (Crossover) Middle
🔹 RSI (Crossunder) Middle
🔹 RSI (Crossover) MA
🔹 RSI (Crossunder) MA
🔹 MA (Crossover) Upper
🔹 MA (Crossunder) Upper
🔹 MA (Crossover) Lower
🔹 MA (Crossunder) Lower
📈 RSI Divergences:
🔹 RSI Divergence Bull
🔹 RSI Divergence Bear
📈 RSI Forecast:
🔹 RSI (Crossover) MA Forecast
🔹 RSI (Crossunder) MA Forecast
🔹 RSI Forecast 1 > MA Forecast 1
🔹 RSI Forecast 1 < MA Forecast 1
🔹 RSI Forecast 2 > MA Forecast 2
🔹 RSI Forecast 2 < MA Forecast 2
🔹 RSI Forecast 3 > MA Forecast 3
🔹 RSI Forecast 3 < MA Forecast 3
🔹 RSI Forecast 4 > MA Forecast 4
🔹 RSI Forecast 4 < MA Forecast 4
🔹 RSI Forecast 5 > MA Forecast 5
🔹 RSI Forecast 5 < MA Forecast 5
🔹 RSI Forecast 6 > MA Forecast 6
🔹 RSI Forecast 6 < MA Forecast 6
🔹 RSI Forecast 7 > MA Forecast 7
🔹 RSI Forecast 7 < MA Forecast 7
🔹 RSI Forecast 8 > MA Forecast 8
🔹 RSI Forecast 8 < MA Forecast 8
🔹 RSI Forecast 9 > MA Forecast 9
🔹 RSI Forecast 9 < MA Forecast 9
🔹 RSI Forecast 10 > MA Forecast 10
🔹 RSI Forecast 10 < MA Forecast 10
🔹 RSI Forecast 11 > MA Forecast 11
🔹 RSI Forecast 11 < MA Forecast 11
🔹 RSI Forecast 12 > MA Forecast 12
🔹 RSI Forecast 12 < MA Forecast 12
🔹 RSI Forecast 13 > MA Forecast 13
🔹 RSI Forecast 13 < MA Forecast 13
🔹 RSI Forecast 14 > MA Forecast 14
🔹 RSI Forecast 14 < MA Forecast 14
🔹 RSI Forecast 15 > MA Forecast 15
🔹 RSI Forecast 15 < MA Forecast 15
🔹 RSI Forecast 16 > MA Forecast 16
🔹 RSI Forecast 16 < MA Forecast 16
🔹 RSI Forecast 17 > MA Forecast 17
🔹 RSI Forecast 17 < MA Forecast 17
🔹 RSI Forecast 18 > MA Forecast 18
🔹 RSI Forecast 18 < MA Forecast 18
🔹 RSI Forecast 19 > MA Forecast 19
🔹 RSI Forecast 19 < MA Forecast 19
🔹 RSI Forecast 20 > MA Forecast 20
🔹 RSI Forecast 20 < MA Forecast 20
______________________________________________________
______________________________________________________
🔸 CONDITIONS TO SELL 📉
______________________________________________________
• Signal Validity: The signal will remain valid for X bars .
• Signal Sequence: Configurable as AND or OR .
📉 RSI Conditions:
🔸 RSI > Upper
🔸 RSI < Upper
🔸 RSI > Lower
🔸 RSI < Lower
🔸 RSI > Middle
🔸 RSI < Middle
🔸 RSI > MA
🔸 RSI < MA
📉 MA Conditions:
🔸 MA > Upper
🔸 MA < Upper
🔸 MA > Lower
🔸 MA < Lower
📉 Crossovers:
🔸 RSI (Crossover) Upper
🔸 RSI (Crossunder) Upper
🔸 RSI (Crossover) Lower
🔸 RSI (Crossunder) Lower
🔸 RSI (Crossover) Middle
🔸 RSI (Crossunder) Middle
🔸 RSI (Crossover) MA
🔸 RSI (Crossunder) MA
🔸 MA (Crossover) Upper
🔸 MA (Crossunder) Upper
🔸 MA (Crossover) Lower
🔸 MA (Crossunder) Lower
📉 RSI Divergences:
🔸 RSI Divergence Bull
🔸 RSI Divergence Bear
📉 RSI Forecast:
🔸 RSI (Crossover) MA Forecast
🔸 RSI (Crossunder) MA Forecast
🔸 RSI Forecast 1 > MA Forecast 1
🔸 RSI Forecast 1 < MA Forecast 1
🔸 RSI Forecast 2 > MA Forecast 2
🔸 RSI Forecast 2 < MA Forecast 2
🔸 RSI Forecast 3 > MA Forecast 3
🔸 RSI Forecast 3 < MA Forecast 3
🔸 RSI Forecast 4 > MA Forecast 4
🔸 RSI Forecast 4 < MA Forecast 4
🔸 RSI Forecast 5 > MA Forecast 5
🔸 RSI Forecast 5 < MA Forecast 5
🔸 RSI Forecast 6 > MA Forecast 6
🔸 RSI Forecast 6 < MA Forecast 6
🔸 RSI Forecast 7 > MA Forecast 7
🔸 RSI Forecast 7 < MA Forecast 7
🔸 RSI Forecast 8 > MA Forecast 8
🔸 RSI Forecast 8 < MA Forecast 8
🔸 RSI Forecast 9 > MA Forecast 9
🔸 RSI Forecast 9 < MA Forecast 9
🔸 RSI Forecast 10 > MA Forecast 10
🔸 RSI Forecast 10 < MA Forecast 10
🔸 RSI Forecast 11 > MA Forecast 11
🔸 RSI Forecast 11 < MA Forecast 11
🔸 RSI Forecast 12 > MA Forecast 12
🔸 RSI Forecast 12 < MA Forecast 12
🔸 RSI Forecast 13 > MA Forecast 13
🔸 RSI Forecast 13 < MA Forecast 13
🔸 RSI Forecast 14 > MA Forecast 14
🔸 RSI Forecast 14 < MA Forecast 14
🔸 RSI Forecast 15 > MA Forecast 15
🔸 RSI Forecast 15 < MA Forecast 15
🔸 RSI Forecast 16 > MA Forecast 16
🔸 RSI Forecast 16 < MA Forecast 16
🔸 RSI Forecast 17 > MA Forecast 17
🔸 RSI Forecast 17 < MA Forecast 17
🔸 RSI Forecast 18 > MA Forecast 18
🔸 RSI Forecast 18 < MA Forecast 18
🔸 RSI Forecast 19 > MA Forecast 19
🔸 RSI Forecast 19 < MA Forecast 19
🔸 RSI Forecast 20 > MA Forecast 20
🔸 RSI Forecast 20 < MA Forecast 20
______________________________________________________
______________________________________________________
🤖 AUTOMATION 🤖
• You can automate the BUY and SELL signals of this indicator.
______________________________________________________
______________________________________________________
⯁ UNIQUE FEATURES
______________________________________________________
Linear Regression: (Forecast)
Signal Validity: The signal will remain valid for X bars
Signal Sequence: Configurable as AND/OR
Condition Table: BUY/SELL
Condition Labels: BUY/SELL
Plot Labels in the Graph Above: BUY/SELL
Automate and Monitor Signals/Alerts: BUY/SELL
Linear Regression (Forecast)
Signal Validity: The signal will remain valid for X bars
Signal Sequence: Configurable as AND/OR
Condition Table: BUY/SELL
Condition Labels: BUY/SELL
Plot Labels in the Graph Above: BUY/SELL
Automate and Monitor Signals/Alerts: BUY/SELL
______________________________________________________
📜 SCRIPT : RSI Full Forecast
🎴 Art by : @Titans_Invest & @DiFlip
👨💻 Dev by : @Titans_Invest & @DiFlip
🎑 Titans Invest — The Wizards Without Gloves 🧤
✨ Enjoy!
______________________________________________________
o Mission 🗺
• Inspire Traders to manifest Magic in the Market.
o Vision 𐓏
• To elevate collective Energy 𐓷𐓏

Kalman Filtered RSI | [DeV]The Kalman Filtered RSI indicator is an advanced tool designed for traders who want precise, noise-free market insights. By enhancing the classic Relative Strength Index (RSI) with a Kalman filter, this indicator delivers a smoother, more reliable view of market momentum, helping you identify trends, reversals, and overbought/oversold conditions with greater accuracy. It’s an ideal choice for traders seeking clear signals amidst market volatility, giving you a competitive edge across any trading environment.
The RSI measures momentum by analyzing price movements over a set period, typically 14 bars. It calculates the average of price gains on up days and the average of price losses on down days, then compares these to produce a value between 0 and 100. An RSI above 70 often indicates an overbought market that may reverse downward, while below 30 suggests an oversold market that could reverse upward. RSI is great for spotting momentum shifts, potential reversals, and trend strength, but it can be noisy in choppy markets, leading to misleading signals.
That's where the Kalman filter comes in; it enhances the RSI by applying a sophisticated smoothing process that predicts the RSI’s next value based on its historical trend, then updates this prediction with the actual RSI reading. It operates in two phases: prediction and correction. In the prediction phase, it uses the previous filtered RSI and adds uncertainty from process noise (Q), which is derived from the historical variance of RSI changes, reflecting how much the RSI might unexpectedly shift. In the correction phase, it calculates a Kalman gain based on the ratio of prediction uncertainty to measurement noise (R), which is determined from the variance between raw RSI and a smoothed version, indicating the raw data’s noisiness. This gain weights how much the filter trusts the new RSI versus the prediction, blending them to produce a smoothed RSI that reduces noise while staying responsive to real trends, outperforming simpler methods like moving averages that often lag or oversmooth.
With the Kalman Filtered RSI, you get a refined view of momentum, making it easier to spot trends and reversals with clarity. This indicator’s ability to dynamically adapt to market changes delivers timely, reliable signals, making it a powerful addition to your trading strategy for any market or timeframe.

Stochastic and RSI2 entriesStochastic and RSI2 entries, v1.0
This indicator combines Stochastic and RSI to facilitate "RSI2" entry signals. Buy signals will be shown at the bottom.
The default configuration uses non-standard settings for the underlying indicators to tailor it for this type of entry strategy.
This is an entry strategy that tries to find entries close to "the dip".
A combination of Stochastic crossovers, VWAP, daily SMA50 and daily SMA200 are used to verify buy signals.
This indicator is written for bullish signals and aims to find the start of short trends or cheap entries for longer positions.
Like with any strategy, some signals will be false, and the user is advised to do some own research before using the buy signals for actual entries.
Happy trading!

RSI Strength & Consolidation Zones (Zeiierman)█ Overview
RSI Strength & Consolidation Zones (Zeiierman) is a hybrid momentum and volatility visualization tool that blends enhanced RSI interpretation with ADX-driven consolidation detection. This indicator doesn't just show where RSI is trending — it interprets how strong that trend is, when that strength changes, and where the market may be consolidating in anticipation of breakout movement.
Using a combination of Kalman-filtered RSI, custom-built DMI/ADX, and low-volatility zone recognition, it gives traders a dynamic RSI with strength-based coloring, while also highlighting consolidation zones to spot breakout opportunities.
█ Its uniqueness
Traditional RSI indicators lack context. They may show you when the market is overbought or oversold, but they won’t tell you how strong that condition is, or whether it’s likely to result in continuation or consolidation.
This tool aims to solve that by introducing adaptive strength metrics and structural compression zones, allowing traders to anticipate when the market is likely preparing for a move.
█ How It Works
⚪ Enhanced RSI
Combines traditional RSI and a custom RSI implementation
Smooths both through a Kalman filter for trend direction
Final RSI line reflects smoothed consensus between manual and built-in RSI
Adds an RSI + Strength overlay to show when the directional conviction is increasing
⚪ ADX-Driven Strength Layer
Directional Movement Index (DMI) is calculated both manually and with built-in smoothing
The average ADX value is used to calculate a strength modifier
When ADX exceeds 20, RSI is dynamically enhanced or dampened to reflect directional force
Resulting visual: RSI appears stronger or weaker based on confirmed trend conditions
⚪ Consolidation Zone Detection
When ADX falls below 20, the indicator enters a consolidation zone state
Boxes are drawn dynamically to contain the price within these low-volatility structures
Once the price breaks out of the zone, the indicator plots a breakout signal (▲ or ▼)
⚪ Breakouts
Breakout markers are placed at the first close outside the consolidation box
These signals serve as early indicators for potential trend continuation or reversal
█ How to Use
⚪ Confirm Momentum Strength
Use the RSI + Strength line to determine whether current momentum is backed by trend conviction. If strength expands alongside rising RSI, the move has confirmation.
⚪ Consolidations Zones
When RSI is around the midline, and a consolidation box appears, expect lower volatility and a range-bound market, followed by a breakout.
⚪ Use Breakout Signals for Entry
Look for ▲ or ▼ markers as early triggers. These often coincide with volume expansions or structural breaks.
█ Settings Explained
RSI Length – Number of bars used for RSI. Shorter = more sensitive.
DMI Length – Used in both custom and built-in ADX/DI calculations.
ADX Smoothing – Smooths the trend strength signal. Higher values = smoother strength detection.
Trend Confirmation (Filter Strength) – Adjusts the responsiveness of the Kalman filter.
-----------------
Disclaimer
The content provided in my scripts, indicators, ideas, algorithms, and systems is for educational and informational purposes only. It does not constitute financial advice, investment recommendations, or a solicitation to buy or sell any financial instruments. I will not accept liability for any loss or damage, including without limitation any loss of profit, which may arise directly or indirectly from the use of or reliance on such information.
All investments involve risk, and the past performance of a security, industry, sector, market, financial product, trading strategy, backtest, or individual's trading does not guarantee future results or returns. Investors are fully responsible for any investment decisions they make. Such decisions should be based solely on an evaluation of their financial circumstances, investment objectives, risk tolerance, and liquidity needs.

CyberCandle SwiftEdgeCyberCandle SwiftEdge
Overview
CyberCandle SwiftEdge is a cutting-edge, AI-inspired trading indicator designed for traders seeking precision and clarity in trend-following and swing trading. Powered by SwiftEdge, it combines Heikin Ashi candles, a gradient-colored Exponential Moving Average (EMA), and a Relative Strength Index (RSI) to deliver clear buy and sell signals. Featuring glowing visuals, dynamic signal icons, and a customizable RSI dashboard in the top-right corner, this script offers a futuristic interface for identifying high-probability trade setups on various timeframes (e.g., 1H, 4H).
What It Does
CyberCandle SwiftEdge integrates three powerful components to generate actionable trading signals:
Heikin Ashi Candles: Smooths price action to highlight trends, reducing market noise and making reversals easier to spot.
Gradient EMA: A 100-period EMA with dynamic color transitions (blue/cyan for uptrends, red/pink for downtrends) to confirm market direction.
RSI Dashboard: A neon-lit display showing RSI levels, indicating overbought (>70), oversold (<30), or neutral (30-70) conditions.
Buy and sell signals are marked with prominent, glowing icons (triangles and arrows) based on trend direction, momentum, and specific Heikin Ashi patterns. The script’s customizable parameters allow traders to tailor the strategy to their preferences, balancing signal frequency and precision.
How It Works
The strategy leverages the synergy of Heikin Ashi, EMA, and RSI to filter trades and highlight opportunities:
Trend Direction: The price must be above the EMA for buy signals (bullish trend) or below for sell signals (bearish trend). The EMA’s gradient color shifts based on its slope, visually reinforcing trend strength.
Momentum Confirmation: RSI must exceed a user-defined threshold (default: 50) for buy signals or fall below it for sell signals, ensuring momentum supports the trade.
Candle Patterns: Buy signals require a green Heikin Ashi candle (close > open), with the two prior candles having minimal upper wicks (≤5% of candle body) and being red (indicating a retracement). Sell signals require a red candle, minimal lower wicks, and two prior green candles.
RSI Dashboard: Positioned in the top-right corner, it features a glowing circle (red for overbought, green for oversold, blue for neutral), the current RSI value, and a status indicator (triangle for extremes, square for neutral). This provides instant momentum insights without cluttering the chart.
By combining Heikin Ashi’s trend clarity, EMA’s directional filter, and RSI’s momentum validation, CyberCandle SwiftEdge minimizes false signals and highlights trades with strong potential. Its vibrant, AI-like visuals make it easy to interpret at a glance.
How to Use It
Add to Chart: In TradingView, search for "CyberCandle SwiftEdge" and add it to your chart. Set the chart to Heikin Ashi candles for optimal compatibility.
Interpret Signals:
Buy Signal: Large green triangles and arrows appear below candles when the price is above the EMA, RSI is above the buy threshold (default: 50), and conditions for a bullish retracement are met. Consider entering a long position with a 1:2 risk/reward ratio.
Sell Signal: Large red triangles and arrows appear above candles when the price is below the EMA, RSI is below the sell threshold (default: 50), and conditions for a bearish retracement are met. Consider entering a short position.
RSI Dashboard: Monitor the top-right dashboard. A red circle (RSI > 70) suggests caution for buys, a green circle (RSI < 30) indicates potential buying opportunities, and a blue circle (RSI 30-70) signals neutrality.
Customize Parameters: Open the indicator’s settings to adjust:
EMA Length (default: 100): Increase (e.g., 200) for longer-term trends or decrease (e.g., 50) for shorter-term sensitivity.
RSI Length (default: 14): Adjust for more (e.g., 7) or less (e.g., 21) responsive momentum signals.
RSI Buy/Sell Thresholds (default: 50): Set higher (e.g., 55) for buys or lower (e.g., 45) for sells to require stronger momentum.
Wick Tolerance (default: 0.05): Increase (e.g., 0.1) to allow larger wicks, generating more signals, or decrease (e.g., 0.02) for stricter conditions.
Require Retracement (default: true): Disable to remove the two-candle retracement requirement, increasing signal frequency.
Trading: Use signals in conjunction with the RSI dashboard and market context. For example, avoid buy signals if the RSI dashboard is red (overbought). Always apply proper risk management, such as setting stop-losses based on recent lows/highs.
What Makes It Original
CyberCandle SwiftEdge stands out due to its futuristic, AI-inspired visual design and user-friendly customization:
Neon Aesthetics: Glowing Heikin Ashi candles, gradient EMA, and dynamic signal icons (triangles and arrows) with RSI-driven transparency create a high-tech, immersive experience.
RSI Dashboard: A compact, top-right display with a neon circle, RSI value, and adaptive status indicator (triangle/square) provides instant momentum insights without cluttering the chart.
Customizability: Users can fine-tune EMA length, RSI parameters, wick tolerance, and retracement requirements via TradingView’s settings, balancing signal frequency and precision.
Integrated Approach: The synergy of Heikin Ashi’s trend clarity, EMA’s directional strength, and RSI’s momentum validation offers a cohesive strategy that reduces false signals.
Why This Combination?
The script combines Heikin Ashi, EMA, and RSI for a complementary effect:
Heikin Ashi smooths price fluctuations, making it ideal for identifying sustained trends and retracements, which are critical for the strategy’s signal logic.
EMA provides a reliable trend filter, ensuring signals align with the broader market direction. Its gradient color enhances visual trend recognition.
RSI adds momentum context, confirming that signals occur during favorable conditions (e.g., RSI > 50 for buys). The dashboard makes RSI intuitive, even for non-technical users.
Together, these components create a balanced system that captures trend reversals after retracements, validated by momentum, with a visually engaging interface that simplifies decision-making.
Tips
Best used on volatile assets (e.g., BTC/USD, EUR/USD) and higher timeframes (1H, 4H) for clearer trends.
Experiment with parameters in the settings to match your trading style (e.g., increase wick tolerance for more signals).
Combine with other analysis (e.g., support/resistance) for higher-confidence trades.
Note
This indicator is for informational purposes and does not guarantee profits. Always backtest and use proper risk management before trading.

RSI Candlestick Oscillator [LuxAlgo]The RSI Candlestick Oscillator displays a traditional Relative Strength Index (RSI) as candlesticks. This indicator references OHLC data to locate each candlestick point relative to the current RSI Value, leading to a more accurate representation of the Open, High, Low, and Close price of each candlestick in the context of RSI.
In addition to the candlestick display, Divergences are detected from the RSI candlestick highs and lows and can be displayed over price on the chart.
🔶 USAGE
Translating candlesticks into the RSI oscillator is not a new concept and has been attempted many times before. This indicator stands out because of the specific method used to determine the candlestick OHLC values. When compared to other RSI Candlestick indicators, you will find that this indicator clearly and definitively correlates better to the on-chart price action.
Traditionally, the RSI indicator is simply one running value based on (typically) the close price of the chart. By introducing high, low, and open values into the oscillator, we can better gauge the specific price action throughout the intrabar movements.
Interactions with the RSI levels can now take multiple forms, whether it be a full-bodied breakthrough or simply a wick test. Both can provide a new analysis of price action alongside RSI.
An example of wick interactions and full-bodied interactions can be seen below.
As a result of the candlestick display, divergences become simpler to spot. Since the candlesticks on the RSI closely resemble the candlesticks on the chart, when looking for divergence between the chart and RSI, it is more obvious when the RSI and price are diverging.
The divergences in this indicator not only show on the RSI oscillator, but also overlay on the price chart for clearer understanding.
🔹 Filtering Divergence
With the candlesticks generating high and low RSI values, we can better sense divergences from price, since these points are generally going to be more dramatic than the (close) RSI value.
This indicator displays each type of divergence:
Bullish Divergence
Bearish Divergence
Hidden Bullish Divergence
Hidden Bearish Divergence
From these, we get many less-than-useful indications, since every single divergence from price is not necessarily of great importance.
The Divergence Filter disregards any divergence detected that does not extend outside the RSI upper or lower values.
This does not replace good judgment, but this filter can be helpful in focusing attention towards the extremes of RSI for potential reversal spotting from divergence.
🔶 DETAILS
In order to get the desired results for a display that resembles price action while following RSI, we must scale. The scaling is the most important part of this indicator.
To summarize the process:
Identify a range on Price and RSI
Consider them as equal to create a scaling factor
Use the scaling factor to locate RSI's "Price equivalent" Upper, Lower, & Mid on the Chart
Use those prices (specifically the RSI Mid) to check how far each OHLC value lies from it
Use those differences to translate the price back to the RSI Oscillator, pinning the OHLC values at their relative location to our anchor (RSI Mid)
🔹 RSI Channel
To better understand, and for your convenience, the indicator includes the option to display the RSI Channel on the chart. This channel helps to visualize where the scaled RSI values are relative to price.
If you analyze the RSI channel, you are likely to notice that the price movement throughout the channel matches the same movement witnessed in the RSI Oscillator below. This makes sense since they are the exact same thing displayed on different scales.
🔹 Scaling the Open
While the scaling method used is important, and provides a very close view of the real price bar's relative locations on the RSI oscillator… It is designed for a single purpose.
The scaling does NOT make the price candles display perfectly on the RSI oscillator.
The largest place where this is noticeable is with the opening of each candle.
For this reason, we have included a setting that modifies the opening of each RSI candle to be more accurate to the chart's price candles.
This setting positions the current bar's opening RSI candlestick value accurately relative to the price's open location to the previous closing price. As seen below.
🔶 SETTINGS
🔹 RSI Candles
RSI Length: Sets the Length for the RSI Oscillator.
Overbought/Oversold Levels: Sets the Overbought and Oversold levels for the RSI Oscillator.
Scale Open for Chart Accuracy: As described above, scales the open of each candlestick bar to more accurately portray the chart candlesticks.
🔹 Divergence
Show on Chart: Choose to display divergence line on the chart as well as on the Oscillator.
Divergence Length: Sets the pivot width for divergence detection. Normal Fractal Pivot Detection is used.
Divergence Style: Change color and line style for Regular and Hidden divergences, as well as toggle their display.
Divergence Filter: As described above, toggle on or off divergence filtering.
🔹 RSI Channel
Toggle: Display RSI Channel on Chart.
Color: Change RSI Channel Color

ICT Swiftedge# ICT SwiftEdge: Advanced Market Structure Trading System
**Overview**
ICT SwiftEdge is a powerful trading system built upon the foundation of ICTProTools' ICT Breakers, licensed under the Mozilla Public License 2.0 (mozilla.org). This script has been significantly enhanced by to combine market structure analysis with modern technical indicators and a sleek, AI-inspired statistics dashboard. The goal is to provide traders with a comprehensive tool for identifying high-probability trade setups, managing exits, and tracking performance in a visually intuitive way.
**Credits**
This script is a derivative work based on the original "ICT Breakers" by ICTProTools, used with permission under the Mozilla Public License 2.0. Significant enhancements, including RSI-MA signals, trend filtering, dynamic timeframe adjustments, dual exit strategies, and an AI-style statistics dashboard, were developed by . We express our gratitude to ICTProTools for their foundational work in market structure analysis.
**What It Does**
ICT SwiftEdge integrates multiple trading concepts to help traders identify and manage trades based on market structure and momentum:
- **Market Structure Analysis**: Identifies Break of Structure (BOS) and Market Structure Shift (MSS) patterns, which signal potential trend continuations or reversals. BOS indicates a continuation of the current trend, while MSS highlights a shift in market direction, providing key entry points.
- **RSI-MA Signals**: Generates "BUY" and "SELL" signals when BOS or MSS patterns align with the Relative Strength Index (RSI) smoothed by a Moving Average (RSI-MA). Signals are filtered to occur only when RSI-MA is above 50 (for buys) or below 50 (for sells), ensuring momentum supports the trade direction.
- **Trend Filtering**: Prevents multiple signals in the same trend, ensuring only one buy or sell signal per trend direction, reducing noise and improving trade clarity.
- **Dynamic Timeframe Adjustment**: Automatically adjusts pivot points, RSI, and MA parameters based on the selected chart timeframe (1M to 1D), optimizing performance across different market conditions.
- **Flexible Exit Strategies**: Offers two user-selectable exit methods:
- **Trailing Stop-Loss (TSL)**: Exits trades when price moves against the position by a user-defined distance (in points), locking in profits or limiting losses.
- **RSI-MA Exit**: Exits trades when RSI-MA crosses the 50 level, signaling a potential loss of momentum.
- Users can enable either or both strategies, providing flexibility to adapt to different trading styles.
- **AI-Style Statistics Dashboard**: Displays real-time trade performance metrics in a futuristic, neon-colored interface, including total trades, wins, losses, win/loss ratio, and win percentage. This helps traders evaluate the system's effectiveness without external tools.
**Why This Combination?**
The integration of these components creates a synergistic trading system:
- **BOS/MSS and RSI-MA**: Combining market structure breaks with RSI-MA ensures entries are based on both price action (structure) and momentum (RSI-MA), increasing the likelihood of high-probability trades.
- **Trend Filtering**: By limiting signals to one per trend, the system avoids overtrading and focuses on significant market moves.
- **Dynamic Adjustments**: Timeframe-specific parameters make the system versatile, suitable for scalping (1M, 5M) or swing trading (4H, 1D).
- **Dual Exit Strategies**: TSL protects profits during trending markets, while RSI-MA exits are ideal for range-bound or reversing markets, catering to diverse market conditions.
- **Statistics Dashboard**: Provides immediate feedback on trade performance, enabling data-driven decision-making without manual tracking.
This combination balances technical precision with user-friendly visuals, making it accessible to both novice and experienced traders.
**How to Use**
1. **Add to Chart**: Apply the script to any TradingView chart.
2. **Configure Settings**:
- **Chart Timeframe**: Select your chart's timeframe (1M to 1D) to optimize parameters.
- **Structure Timeframe**: Choose a timeframe for market structure analysis (leave blank for chart timeframe).
- **Exit Strategy**: Enable Trailing Stop-Loss (`useTslExit`), RSI-MA Exit (`useRsiMaExit`), or both. Adjust `tslPoints` for TSL distance.
- **Show Signals/Labels**: Toggle `showSignals` and `showExit` to display "BUY", "SELL", and "EXIT" labels.
- **Dashboard**: Enable `showDashboard` to view trade statistics. Customize colors with `dashboardBgColor` and `dashboardTextColor`.
3. **Trading**:
- Look for "BUY" or "SELL" labels to enter trades when BOS/MSS aligns with RSI-MA.
- Exit trades at "EXIT" labels based on your chosen strategy.
- Monitor the statistics dashboard to track performance (total trades, win/loss ratio, win percentage).
4. **Alerts**: Set up alerts for BOS, MSS, buy, sell, or exit signals using the provided alert conditions.
**License**
This script is licensed under the Mozilla Public License 2.0 (mozilla.org). The source code is available for review and modification under the terms of this license.
**Compliance with TradingView House Rules**
This publication adheres to TradingView's House Rules and Scripts Publication Rules. It provides a clear, self-contained description of the script's functionality, credits the original author (ICTProTools), and explains the rationale for combining indicators. The script contains no promotional content, offensive language, or proprietary restrictions beyond MPL 2.0.
**Note**
Trading involves risk, and past performance is not indicative of future results. Always backtest and validate the system on your preferred markets and timeframes before live trading.
Enjoy trading with ICT SwiftEdge, and let data-driven insights guide your decisions!

Sentiment Bias Gauge📌 Overview
The Sentiment Bias Gauge (SBG) is a unique overlay-style indicator that visually maps a sentiment value—such as market bullishness or bearishness—onto your price chart. It converts sentiment data (in this case, RSI-based) into a floating line that moves between defined price zones, allowing users to quickly understand the current market mood in the context of price.
⚙️ How It Works
• The indicator uses RSI (Relative Strength Index) as a proxy for market sentiment (0 to 100 scale).
• This sentiment value is then mapped to a vertical price range on your chart using a configurable zone (via top and bottom percent of chart range).
• The line floats up or down within the price chart, reflecting how bullish or bearish the sentiment is.
• It includes background shading to represent the sentiment level:
• 🔴 Red (Bearish): sentiment < 30
• 🟡 Yellow (Neutral): 30 ≤ sentiment ≤ 70
• 🟢 Green (Bullish): sentiment > 70
• A floating label shows the current sentiment score.
🌟 Key Features
• 📈 Overlay-Based Sentiment Line: Plots sentiment as a price-level line, giving intuitive spatial reference.
• 🔧 Configurable Range Placement: Adjust where the sentiment line appears within the chart’s high-low range.
• 🖌️ Color-Coded Background: Visually distinguish bullish, bearish, and neutral conditions.
• 🏷️ Real-Time Sentiment Label: Displays updated sentiment score on the most recent bar.
🧠 How to Use
• Use this indicator alongside your price action or technical strategy to gauge market mood.
• Combine with other sentiment indicators (e.g., fear/greed, delta volume, news sentiment).
• Especially helpful in sideways markets to identify potential shifts in bias before price reacts.
Why This Combination?
• RSI offers a reliable and intuitive proxy for market sentiment.
• Mapping the value directly onto the chart helps avoid constantly looking at a separate panel.
• The customizable chart range lets traders fit sentiment visuals within any market structure.
🎯 Why It’s Worth Using
• Makes sentiment visually accessible directly on the chart.
• Helps detect bullish/bearish bias shifts earlier than traditional indicators.
• A great tool for sentiment-aware discretionary trading or contextual overlays in algo strategies.

Dynamic RSI Regression Bands (Zeiierman)█ Overview
The Dynamic RSI Regression Bands (Zeiierman) is a regression channel tool that dynamically resets based on RSI overbought and oversold conditions. It adapts to trend shifts in real time, creating a highly responsive regression framework that visualizes market sentiment and directional momentum with every RSI-triggered event.
Unlike static regression models, this indicator recalibrates its slope and deviation bands only after the RSI crosses predefined thresholds, helping traders pinpoint new phases of momentum, exhaustion, or reversal.
You’re not just measuring the trend — you’re tracking when and where the trend deserves to be re-evaluated.
█ The Assumption:
"A major momentum shift (RSI crossing OB/OS) signals a potential regime change, and thus, the trend model should be recalibrated from that point."
Instead of using a fixed-length regression (which assumes trend relevance over a static window), this script resets the regression calculation every time RSI crosses into extreme territory. The underlying idea is that extreme RSI levels often represent emotional peaks in market behavior and are statistically likely to be followed by a new price structure.
█ How It Works
⚪ RSI-Based Channel Reset
RSI is monitored continuously
If RSI crosses above the Overbought level, the indicator resets and starts a new regression channel
If RSI crosses below the Oversold level, the same reset logic applies
These events act as “anchor points” for dynamic trend analysis
⚪ Regression Channel Logic
A custom linear regression is calculated from the RSI reset point forward
The lookback grows with each bar after the reset, up to a user-defined max
Regression lines are drawn from the reset point to the current bar
⚪ Standard Deviation Bands
Upper and lower bands are plotted around the regression line using the standard deviation
These serve as dynamic volatility envelopes, great for spotting breakouts or reversals
⚪ Rejection Markers
If price hits the upper/lower band and then closes back inside it, a rejection marker is plotted
Helps visualize failed breakouts and areas of absorption or reversal pressure
█ How to Use
⚪ Detect Trend Shifts
Use the RSI resets to identify when the trend might be starting fresh.
⚪ Watch the Bands for Volatility Extremes
Use the outer bands as soft areas of potential reversal or momentum breakout.
⚪ Spot Rejections for Potential Entry Signals
If price moves outside a band but then quickly returns inside, it often means the breakout failed, and price may reverse.
█ Settings Explained
RSI Length – How many bars RSI uses. Shorter = faster.
OB / OS Levels – Crossing these triggers a regression reset.
Base Regression Length – Max number of bars regression can use post-reset.
StdDev Multiplier – Controls band width from the regression line.
Min Bars After Reset – Ensures channel doesn’t form immediately; waits for structure.
Show Reset Markers – Triangles mark where RSI crossed OB/OS.
Show Rejection Markers – Circles mark where the price rejected the channel edge.
-----------------
Disclaimer
The content provided in my scripts, indicators, ideas, algorithms, and systems is for educational and informational purposes only. It does not constitute financial advice, investment recommendations, or a solicitation to buy or sell any financial instruments. I will not accept liability for any loss or damage, including without limitation any loss of profit, which may arise directly or indirectly from the use of or reliance on such information.
All investments involve risk, and the past performance of a security, industry, sector, market, financial product, trading strategy, backtest, or individual's trading does not guarantee future results or returns. Investors are fully responsible for any investment decisions they make. Such decisions should be based solely on an evaluation of their financial circumstances, investment objectives, risk tolerance, and liquidity needs.

SwiftEdge NW EnvelopeSwiftEdge NW Envelope
Overview
The SwiftEdge NW Envelope is a visually striking technical indicator designed for traders seeking to identify high-probability buy and sell opportunities in volatile markets. By combining the Relative Strength Index (RSI), Average True Range (ATR), and Nadaraya-Watson Envelope, this indicator provides a unique blend of momentum, volatility, and non-linear trend analysis. Its futuristic, AI-inspired aesthetic—featuring neon gradients and dynamic colors—enhances chart readability while delivering actionable trading signals.
What It Does
The SwiftEdge NW Envelope generates buy and sell signals based on price interactions with dynamically calculated support and resistance bands, confirmed by RSI conditions. The indicator:
Plots a Nadaraya-Watson Envelope to identify smooth, non-linear price trends and dynamic support/resistance zones.
Uses ATR to scale the envelope’s bands, adapting to market volatility.
Employs RSI to confirm overbought/oversold conditions, ensuring signals align with momentum.
Visualizes signals with neon-colored markers, background zones, and labels for intuitive decision-making.
How It Works
The indicator integrates three key components:
Nadaraya-Watson Envelope:
A kernel-based regression technique that smooths price data to create a central trend line (mean) and dynamic upper/lower bands.
Unlike traditional moving averages, it provides a non-linear, adaptive view of price trends, making it ideal for capturing complex market movements.
The band width is determined by ATR, ensuring responsiveness to volatility.
Average True Range (ATR):
Measures market volatility to scale the envelope’s bands.
A multiplier (default: 0.5) adjusts the sensitivity of the bands, allowing traders to fine-tune the indicator for different assets or market conditions.
Relative Strength Index (RSI):
A momentum oscillator with a shortened period (default: 5) for increased sensitivity.
Confirms buy signals when RSI is oversold (default: <30) and sell signals when RSI is overbought (default: >70).
Signal Logic
Buy Signal: Triggered when the price crosses above the lower band of the Nadaraya-Watson Envelope and RSI is below the oversold threshold. Marked by a green circle and a "BUY" label below the candle.
Sell Signal: Triggered when the price crosses below the upper band and RSI is above the overbought threshold. Marked by a magenta circle and a "SELL" label above the candle.
Background Zones: Green (buy) or red (sell) translucent zones highlight signal areas for quick recognition.
Visual Features
Dynamic Colors: The central trend line shifts between cyan (uptrend), purple (downtrend), or gray (neutral) based on price position relative to the mean.
Neon Gradient Fill: A translucent blue fill between the upper (green) and lower (red) bands creates a glowing, futuristic effect.
Modern Signal Markers: Small, vibrant circles (green for buy, magenta for sell) and clear labels enhance visual clarity.
Why This Combination?
The SwiftEdge NW Envelope combines RSI, ATR, and Nadaraya-Watson Envelope to create a robust trading tool:
RSI provides momentum confirmation, filtering out false signals in choppy markets.
ATR ensures the envelope adapts to changing volatility, making it suitable for both trending and ranging markets.
Nadaraya-Watson Envelope offers a sophisticated, non-linear alternative to traditional bands (e.g., Bollinger Bands), capturing subtle price dynamics. Together, these components deliver a balanced approach to trend-following and mean-reversion strategies, with RSI acting as a gatekeeper to improve signal reliability.
Customize Settings:
RSI Period (5): Adjust for more/less sensitivity to momentum.
RSI Overbought/Oversold (70/30): Modify thresholds to tighten or loosen signal conditions.
ATR Period (14) and Multiplier (0.5): Tune volatility sensitivity.
NW Length (25), Bandwidth (8.0), Multiplier (3.0): Adjust the smoothness and width of the envelope.
Interpret Signals:
Buy: Look for green circles and "BUY" labels when price crosses above the lower band, confirmed by low RSI.
Sell: Look for magenta circles and "SELL" labels when price crosses below the upper band, confirmed by high RSI.
Use background zones to quickly spot active signal areas.
Combine with Other Tools:
Pair with support/resistance levels or volume analysis for additional confirmation.
Test signals on a demo account before live trading.
Originality
The SwiftEdge NW Envelope stands out due to:
Its innovative use of Nadaraya-Watson regression, a less common but powerful tool for non-linear trend analysis.
A unique visual design with neon gradients and dynamic colors, inspired by AI and futuristic interfaces, making it both functional and visually engaging.
A streamlined signal system that balances momentum (RSI), volatility (ATR), and trend (Nadaraya-Watson), reducing noise and enhancing trade precision.
Notes
Best suited for volatile markets (e.g., forex, crypto, stocks) where price swings create clear envelope breakouts.
Adjust input parameters to match your trading style (e.g., shorter RSI period for scalping, wider bands for swing trading).
Always backtest and validate signals in your specific market and timeframe before trading.

Akshay - TheOne, TheMostWanted, TheUnbeatable, TheEnd➤ All-in-One Solution (❌ No repaint):
This Technical Chart contains, MA24 Condition, Supertrend Indicator, HalfTrend Signal, Ichimoku Cloud Status, Parabolic SAR (P_SAR), First 5-Minute Candle Analysis (ORB5min), Volume-Weighted Moving Average (VWMA), Price-Volume Trend (PVT), Oscillator Composite, RSI Condition, ADX & Trend Strength.
Technicals don't lie.
🚀 Overview and Key Features
Comprehensive Multi-Indicator Approach:
The script is built to be an all-in-one technical indicator on TradingView. It integrates several well-known indicators and overlays—including Supertrend, HalfTrend, Ichimoku Cloud, various moving averages (EMA, SMA, VWMA), oscillators (Klinger, Price Oscillator, Awesome Oscillator, Chaikin Oscillator, Ultimate Oscillator, SMI Ergodic Oscillator, Chande Momentum Oscillator, Detrended Price Oscillator, Money Flow Index), ADX, and Donchian Channels—to create a composite picture of market sentiment.
Signal Generation and Alerts:
It not only calculates these indicators but also aggregates their output into “Master Candle” signals. Vertical lines are drawn on the chart with corresponding alerts to indicate potential buy or sell opportunities based on robust, combined conditions.
Visual Layering:
Through the use of colored histograms, custom candle plots, trend lines, and background color changes, the script offers a multi-layered visual representation of data, providing clarity about both short-term signals and overall market trends.
⚙️ How It Works and Functionality
MA24 Condition:
Uses the 24-period moving average as a proxy; if the price is above it, the bar is colored green, and red if below, with neutrality when conditions aren’t met.
Supertrend Indicator:
Evaluates price relative to the Supertrend level (calculated via ATR), coloring green when price is above it and red when below.
HalfTrend Signal:
Determines trend shifts by comparing the current close to a calculated trend level; green indicates an upward trend, while red suggests a downtrend.
Ichimoku Cloud Status:
Analyzes the relationship between the Conversion and Base lines; a bullish (green) signal is given when price is above both or the Conversion line is higher than the Base line.
Parabolic SAR (P_SAR):
Colors the signal based on whether the current price is above (green) or below (red) the Parabolic SAR marker, indicating stop and reverse conditions.
First 5-Minute Candle Analysis (ORB5min):
Uses key levels from the first 5-minute candle; if price exceeds the candle’s low, VWAP, and MA, it’s bullish (green), otherwise bearish (red).
Volume-Weighted Moving Average (VWMA):
Compares the current price to volume-weighted averages; a price above these levels is shown in green, below in red.
Price-Volume Trend (PVT):
Determines bullish or bearish momentum by comparing PVT to its VWAP—green when above and red when below.
Oscillator Composite:
Aggregates signals from multiple oscillators; a majority of positive results turn it green, while negative dominance results in red.
RSI Condition:
Uses a simple RSI threshold of 50, with values above signifying bullish (green) momentum and below marking bearish (red) conditions.
ADX & Trend Strength:
Reflects overall trend strength through ADX and directional movements; a combination favoring bullish conditions colors it green, with red signaling bearish pressure.
Master Candle Overall Signal:
Combines multiple indicator outputs into one “Master” signal—green for a consensus bullish trend and red for a bearish outlook.
Scalp Signal Variation:
Focused on short-term price changes, this signal adjusts quickly; green indicates improving short-term conditions, while red signals a downturn.
📊 Visualizations and 🎨 User Experience (❌ no repaint)
Dynamic Histograms & Bar Plots:
Each indicator is represented as a colored bar (with added vertical offsets) to facilitate easy comparison of their respective bullish or bearish contributions.
Clear Color-Coding & Labels:
Green (e.g., GreenFluorescent) indicates bullish sentiment.
Red (e.g., RedFluorescent) indicates bearish sentiment.
Custom labels and descriptive text accompany each bar for clarity.
Interactive Charting:
The overall background color adapts based on the “Master Candle” condition, offering an instant read on market sentiment.
The current candlestick is overlaid with color cues to reinforce the indicator’s signal, enhancing the trading experience.
Real-Time Alerts:
Vertical lines appear on signal events (buy/sell triggers), complemented by alerts that help traders stay on top of actionable market moves.
Sharp lines:
The Sharp lines are plotted based upon the EMA5 cross over with the same market trend, marks this as good time to reentry.
🔧 Settings and Customization
Flexible Timeframe Input:
Users can select their preferred timeframe for analysis, making the indicator adaptable to intraday or longer-term trading styles.
Customizable Indicator Parameters:
➤ Supertrend: Adjust ATR length and multiplier factors.
➤ HalfTrend: Tweak amplitude and channel deviation settings.
➤ Ichimoku Cloud & Oscillators: Fine-tune the conversion/base lines and oscillator lengths to match individual trading strategies.
Visual Customization:
The script’s color schemes and plotting styles can be altered as needed, giving users the freedom to tailor the interface to their taste or existing chart setups.
🌟 Uniqueness of the Concept
Integrated Multi-Indicator Synergy:
Combines a diverse range of trend, momentum, and volume-based indicators into a single cohesive system for a holistic market view.
Master Candle Aggregation:
Consolidates numerous individual signals into a "Master Candle" that filters out noise and provides a clear, consensus-based trading signal.
Layered Visual Feedback:
Uses color-coded histograms, adaptive background cues, and dynamic overlays to deliver a visually intuitive guide to market sentiment at a glance.
Customization and Flexibility:
Offers adjustable parameters for each indicator, allowing users to tailor the system to fit diverse trading styles and market conditions.
✅ Conclusion:
Robust Trading Tool & Non-Repainting Reliability:
This versatile technical analysis tool computes an extensive range of indicators, aggregates them into a stable, non-repainting “Master Candle” signal, and maintains consistent, verifiable outputs on historical data.
Holistic Market Insight & Consistent Signal Generation:
By combining trend detection, momentum oscillators, and volume analysis, the indicator delivers a comprehensive snapshot of market conditions and generates dependable signals across varying timeframes.
User-Centric Design with Rich Visual Feedback:
Customizable settings, clear color-coded outputs, adaptive backgrounds, and real-time alerts work together to provide actionable, transparent feedback—enhancing the overall trading experience.
A Unique All-in-One Solution:
The integrated approach not only simplifies complex market dynamics into an easy-to-read visual guide but also empowers systematic traders with a powerful, adaptable asset for accurate decision-making.
❤️ Credits:
Pine Script™ User Manual
Supertrend
Ichimoku Cloud
Parabolic SAR
Price Volume Trend (PVT)
Average Directional Index (ADX)
Volume Oscillator
HalfTrend
Donchian Trend
Multi Timeframe ATR, CCI & RSIMulti Timeframe ATR, CCI & RSI (MTF IND)
This indicator displays ATR, CCI, and RSI values from a custom selected timeframe in a clean table overlay.
It helps monitor volatility and momentum from higher/lower timeframes directly on your current chart.
Features:
• Select custom timeframe for all indicators (e.g., 1D, 1W, 65m, etc.)
• ATR with selectable smoothing type (RMA, SMA, EMA, WMA)
• CCI & RSI with trend arrows (▲ rising, ▼ falling, ▬ neutral)
• Compact summary table
Aesthetic RSI [AlchimistOfCrypto]🌌 Aesthetic RSI – Unveiling the Fractal Forces of Markets 🌌
Category: Momentum Indicators 📈
"The RSI oscillator, formalized through an advanced mathematical prism, reveals the underlying fractal structures of price movements. This indicator draws inspiration from quantum principles of divergence-convergence where the probability of a return to equilibrium increases proportionally to the distance from the median point. Our implementation employs sophisticated algorithmic smoothing to filter out the stochastic noise inherent in financial markets, allowing visualization of the true momentum forces according to thermodynamic entropy principles applied to trading systems."
📊 Professional Trading Application
The Aesthetic RSI is a visually stunning and mathematically refined take on the classic Relative Strength Index. With customizable settings, advanced smoothing, and eight unique visual palettes, it empowers traders to detect momentum shifts and divergences with unparalleled clarity.
⚙️ Indicator Configuration
- Length 📏
The core parameter (default: 20) that determines the calculation period.
- Lower values (8-14): Increase sensitivity for short-term trading.
- Higher values (21-34): Provide stronger signals for position trading.
- OverBought/OverSold Thresholds 🎯
Customizable boundaries (default: 75/25) to identify extreme market conditions.
- Calibrate based on asset volatility: Higher volatility assets may need wider thresholds (80/20) to reduce false signals.
- Style 🎨
Eight meticulously crafted visual palettes optimized for pattern recognition:
- Miami Vice (default): High-contrast cyan/magenta scheme for spotting divergences.
- Cyberpunk: Yellow/purple combo to highlight momentum shifts.
- Classic: Traditional green/red for conventional analysis.
- High Contrast: Maximum visual separation for traders with visual impairments.
- Specialized palettes (Forest, Ocean, Fire, Monochrome): Tailored for diverse market conditions.
- Mode Selection 🔄
- Full: Displays a complete gradient spectrum across the RSI range, emphasizing momentum transitions between 35-65.
- OverZone: Focuses on actionable extreme zones, reducing noise in ranging markets.
🚀 How to Use
1. Adjust Length ⏰: Set the period based on your trading style (short-term or long-term).
2. Fine-Tune Thresholds 🎚️: Customize overbought/oversold levels to match the asset’s volatility.
3. Select a Palette 🌈: Choose a visual style that enhances your pattern recognition.
4. Choose Mode 🔍: Use "Full" for detailed momentum analysis or "OverZone" for extreme zone focus.
5. Spot Divergences ✅: Look for price-RSI divergences to anticipate reversals.
6. Trade with Precision 🛡️: Combine with other indicators for high-probability setups.
📅 Release Notes (April 2025)
Aesthetic RSI blends quantum-inspired mathematics with artistic visualization, redefining momentum analysis. Stay tuned for future enhancements! ✨
🏷️ Tags
#Trading #TechnicalAnalysis #RSI #Momentum #Divergence #MultiTimeframe #TradingStrategy #RiskManagement #Forex #Stocks #Crypto #Bitcoin #AlgoTrading #DayTrading #SwingTrading #TheAlchimist #QuantumTrading #VisualTrading #PatternRecognition