Smart Auto Levels Renko Pro $ [ #Algo ] ( Fx, Alt, Crypto ) : Smart Levels is Smart Trades 🏆
"Smart Auto Levels Renko Pro $ ( Fx, Alt, Crypto ) " indicator is specially designed for " Crypto, Altcoins, Forex pairs, and US exchange" . It gives more power to day traders, pull-back / reverse trend traders / scalpers & trend analysts. This indicator plots the key smart levels , which will be automatically drawn at the session's start or during the session, if specific input is selected.
🔶 Usage and Settings :
A :
⇓ ( *refer 📷 image ) ⇓
B :
⇓ ( *refer 📷 images ) ⇓
🔷 Features :
a : automated smart levels with #algo compatibility.
b : plots Trend strength ▲, and current candle strength count value label.
c : ▄▀ RENKO Emulator engine ( plots *Non-repaintable #renko data as a line chart over the standard chart).
d : session 1st candle's High, Low & 50% levels ( irrespective of chart time-frame ).
e : 1-hour High & Low levels of specific candle ( from the drop-down menu ), for any global
market crypto / altcoins / forex or USA exchange symbols.
f : previous Day / Week / Month, chart High & Low.
g : pivot point levels of the Daily, Weekly & Monthly charts.
h : 2 class types of ⏰ alerts ( only signals or #algo execution ).
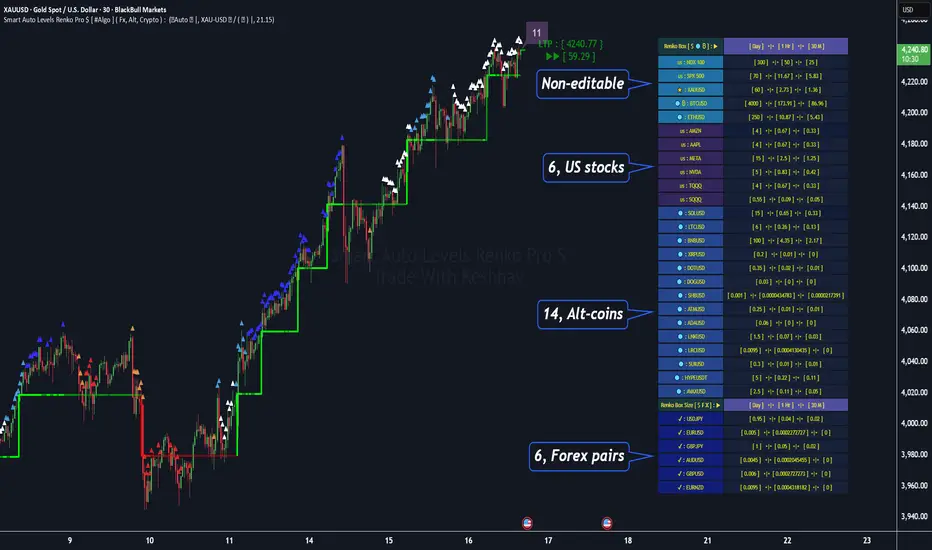
i : auto RENKO box size (ATR-based) table for 31 symbols (5 Default non-editable symbols,
6 US exchange symbols, 14 Alt-coins, 6 Forex pairs.)
j : auto processes " daylight saving time 🌓" data and plots accordingly.
💠Note: "For key smart levels, it processes data from a customized time frame, which is not available for the *free Trading View subscription users , and requires a premium plan." By this indicator, you have an edge over the paid subscription plan users and can automatically plot the Non-repaintable RENKO emulator for the current chart on the Trading View free Plan for any time-frame ."
⬇ Take a deep dive 👁️🗨️ into the Smart levels trading Basic Demonstration ⬇
▄▀ 1: "RENKO Emulator Engine" ⭐ , plots a noiseless chart for easy Top/Bottom set-up analysis. 11 types of 💼 asset classes options available in the drop-down menu.
LTP is tagged to the current RSI value ➕ volatility color change for instant quick decisions.
⇓ ( *refer 📷 image ) ⇓
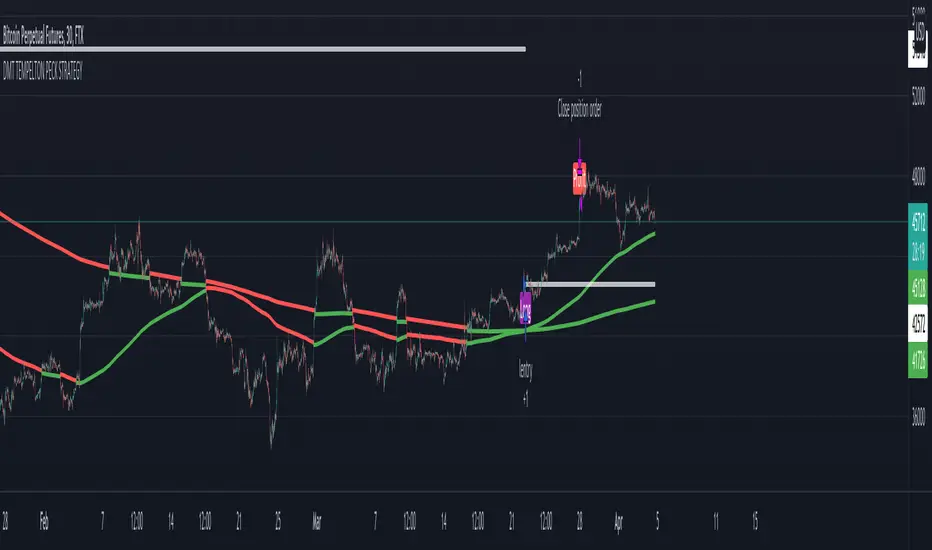
🟣 2: "Trend Strength ▲ Label with color condition.
The strength of the trend will be shown as a number label ( for the current candle ), and the ▲ color format represents the strength of the trend. Can be utilized as an Entry or Exit condition.
⇓ ( *refer 📷 image ) ⇓
🟠 3: plots "Session first candle High, low, and 50%" levels ( irrespective of chart time-frame ), which are critical levels for an intraday trader with add-on levels of Previous Day, Week & Month High and Low levels.
⇓ ( *refer 📷 image ) ⇓
🔵 4: plots "Hourly chart candle" High & Low levels for the specific candles, selected from the drop-down menu with Pivot Points levels of Daily, Weekly, Monthly chart.
⇓ ( *refer 📷 image ) ⇓
🔲 5: "Auto RENKO box size" ( ATR based ) : This indicator is specially designed for 'Renko' trading enthusiasts, where the Box size of the ' Renko chart ' for intraday or swing trading ( ATR based ) , automatically calculated for the selected ( editable ) symbols in the table.
⇓ ( *refer 📷 image ) ⇓
*NOTE :
Table symbols (Non-editable) for 2 USA index, XAU, BTC, ETH.
Symbols (editable) for USA index/stocks.
Table Symbols (editable) for alt-coins.
Table Symbols (editable) for Forex pairs.
⏰ 6: "Alert functions."
⇓ ( *refer 📷 image ) ⇓
◻ : Total 7 signal alerts can be possible in a Single alert.
◻ : Total 10 #algo alerts , ( must ✔ tick the Consent check box for algo execution ).
Note: : alert with RSI ( *manual ✍ input value ) condition.
After selecting alert/alerts ( signals 7 / #algo 10 ), an additional RSI condition can also be used as an input to trigger the alert.
ex: alert = { 🟠 𝟭 Hr 🕯 H & L ➕ ✅ RSI✍ } condition, will trigger the alert when both conditions meet simultaneously.
This Indicator will work like a Trading System . It is different from other indicators, which give Signals only. This script is designed to be tailored to your personal trading style by combining user input components to create your own comprehensive strategy . The synergy between the components is key to its usefulness.
🚀 It focuses on the key Smart Levels and gives you an Extra edge over others.
✅ HOW TO GET ACCESS :
You can see the Author's instructions below to get instant access to this indicator & our premium indicator suites. If you like any of my Invite-Only indicators, kindly DM and let me know!
⚠ RISK DISCLAIMER :
All content provided by "@TradeWithKeshhav" is for informational & educational purposes only.
It does not constitute any financial advice or a solicitation to buy or sell any securities of any type. All investments / trading involve risks. Past performance does not guarantee future results / returns.
Regards :
Team @TradeWithKeshhav
Happy trading and investing!
Profitable
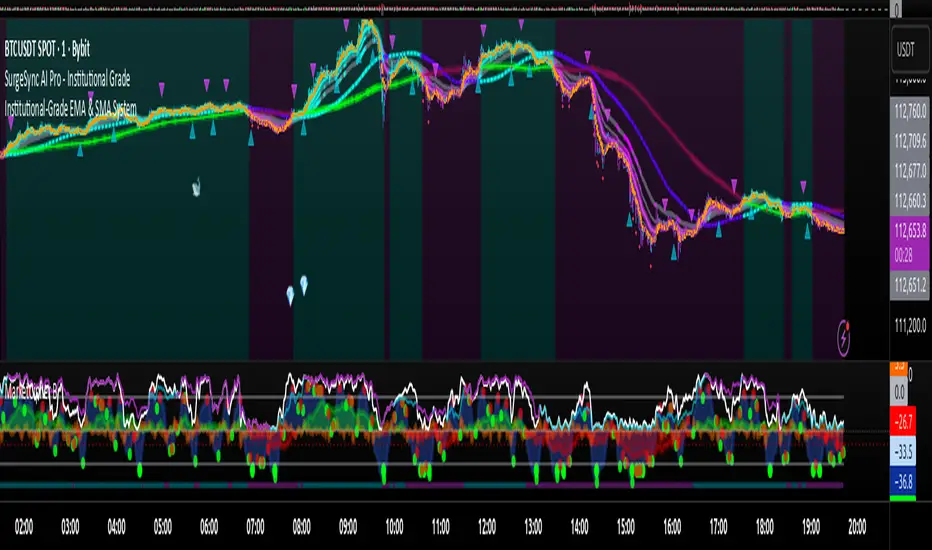
Proteus EMA SystemInstitutional-Grade EMA System
Overview and Originality
The Institutional-Grade EMA System is an advanced, multi-layered Exponential Moving Average (EMA) overlay indicator designed to provide institutional-level trend analysis, market regime identification, and trade signal generation. Unlike standard multi-EMA scripts that simply plot averages and basic crossovers, this indicator introduces a proprietary integration of features tailored for professional traders: customizable presets that dynamically adjust EMA lengths for specific trading styles (e.g., scalping vs. position trading), multiple selectable trend detection algorithms (including a unique multi-bar slope analysis with percentage-based strength thresholding), EMA alignment and confluence detection for spotting high-conviction trends and reversal zones, volume-based signal filtering, and a comprehensive statistics dashboard for real-time market insights.
What makes this script original and worthy of closed-source protection is the bespoke combination of these elements into a cohesive system. For instance, while basic EMA ribbons or trend coloring exist in other indicators, this script's trend detection goes beyond simple comparisons by incorporating a normalized slope percentage calculation (detailed below) to quantify trend strength on a 0-100% scale, integrated with EMA stacking checks and confluence thresholds. This proprietary logic—refined through extensive backtesting on diverse assets—allows for nuanced market regime classification (e.g., "Strong Uptrend" only when alignment, slope strength, and volume align), which isn't replicated in open-source alternatives. The closed-source format protects the exact orchestration of these algorithms, including custom threshold derivations and dashboard computations, preventing direct replication while allowing users full access to the tool's outputs. If published open-source, the unique mathematical formulations (e.g., slope-to-strength mapping) could be easily copied, diminishing its edge in competitive trading environments.
This indicator draws conceptual inspiration from institutional trend-following systems (e.g., those using multiple time-horizon EMAs like in hedge fund models), but enhances them with modern Pine Script capabilities for visual and analytical depth. It's particularly useful for traders seeking to reduce false signals in volatile markets by requiring multi-factor confluence.
What It Does
Core EMA Plotting and Visualization: Plots up to 7 EMAs (5 primary + 2 optional) with dynamic coloring based on detected trend direction and strength (strong bullish: bright green; weak: faded green; neutral: gray; etc.). Includes EMA ribbons (fills between consecutive EMAs) and clouds (broader fills between non-consecutive EMAs) to visualize trend expansion/contraction.
Trend Detection and Strength: Classifies trends as strong/weak bullish/bearish or neutral using user-selectable methods, with optional volume confirmation to filter low-conviction moves.
Advanced Analytics:
Detects EMA alignment (all EMAs stacked in ascending/descending order for bullish/bearish trends).
Identifies EMA confluence zones (tight clustering of EMAs, signaling potential reversals or consolidations).
Draws dynamic support/resistance lines from the nearest EMAs relative to price.
Signals and Alerts: Generates buy/sell signals on customizable EMA crossovers, only if volume thresholds are met. Includes alerts for crossovers, alignments, confluences, and regime shifts.
User Interface Enhancements: Background coloring for quick trend bias (e.g., green for uptrends, yellow for confluences), dynamic line widths (thicker for slower EMAs), trend state labels, and a table-based dashboard displaying metrics like market regime, trend strength percentage, EMA slopes in degrees, price distances to key EMAs, volume status, and alignment state.
Customization Presets: Pre-configured EMA lengths for Scalping (short, reactive: e.g., 5/8/13), Day Trading (balanced: 9/21/50), Swing Trading (medium-term: 20/50/100), Position Trading (long-term: 50/100/150), or fully custom.
The result is a versatile tool that adapts to any timeframe or asset, helping traders identify high-probability setups by combining trend momentum, volume, and EMA dynamics.
How It Works: Underlying Concepts and Calculations
Without revealing the full implementation, here's a transparent overview of the key concepts and methodologies to help users understand the indicator's logic:
EMA Calculation and Presets: EMAs are computed using standard exponential smoothing (weighting recent prices more heavily). Presets optimize lengths based on trading horizon—shorter for scalping to capture quick reversals, longer for position trading to filter noise. For example, Swing preset uses 20/50/100/150/200 to balance short-term pullbacks with long-term trends, derived from Fibonacci-inspired progressions for natural market rhythm alignment.
Trend Detection Methods: Users select from four algorithms for flexibility:
Multi-Bar Slope (Default): Calculates the average slope over a lookback period (e.g., 3 bars) as (current EMA value - EMA value ) / lookback. Normalizes to a percentage relative to the EMA value: slope_percent = (slope / EMA) * 100. Thresholds classify trends (e.g., >0.05% = strong bullish; 0.01-0.05% = weak; symmetric for bearish). This method draws from linear regression concepts but simplifies for real-time use, providing robust trend quantification over simple bar-to-bar changes.
Previous Bar: Compares current EMA to the prior bar's, with percentage change thresholds (e.g., >0.1% = strong) for quick momentum shifts.
EMA vs EMA: Measures the percentage difference between fast and slow EMAs (e.g., >2% = strong bullish), inspired by MACD-like divergence but applied directly to EMAs.
Price Position: Gauges price's percentage distance from the EMA (e.g., >1% above = strong bullish), similar to envelope channels but integrated into trend coloring.
Trend strength is further scored (0-100%) by averaging absolute slopes of key EMAs, scaled for dashboard display.
Volume Confirmation: Uses a simple moving average of volume over a user-defined length (default 20), requiring current volume to exceed it by a multiplier (default 1.2x) for signal validation. This filters out low-volume fakeouts, akin to institutional volume-weighted strategies.
EMA Alignment: Checks if all visible EMAs are in strict order (fastest highest in uptrends, lowest in downtrends) by iterating through active EMAs and verifying sequential relationships. Signals "ALIGNED" shapes when true, indicating stacked trends like in ribbon strategies but with programmatic validation.
EMA Confluence: Computes the average of active EMAs, then measures the maximum percentage deviation of any EMA from this average. If below a threshold (default 0.5%), marks a "CONFLUENCE ZONE" box, conceptually similar to Bollinger Band squeezes but applied to EMA clusters for reversal anticipation.
Market Regime Classification: Combines alignment, trend score (>30% for "strong"), and price position relative to slowest EMA. For example, bullish alignment + high score = "Strong Uptrend"; close clustering = "Consolidation". This heuristic draws from regime-switching models in quantitative finance.
Signals and Visuals: Crossovers between user-selected EMAs (e.g., fast #1 over slow #2) plot "BUY/SELL" shapes only if volume-confirmed. Ribbons use color fills (green/red) based on EMA order; background shades reflect regime; S/R lines extend from max/min EMAs below/above price over a lookback (default 50 bars).
These calculations ensure the indicator provides actionable, multi-confirmed insights rather than generic plots.
How to Use It
Setup: Add to your chart and select a preset (e.g., "Swing Trading" for 1H-4H charts). Customize trend method (start with "Multi-Bar Slope" for accuracy), enable volume filter for reliability, and toggle visuals like ribbons or dashboard.
Trend Following: In a "Strong Uptrend" (green background, upward slopes >30%, bullish alignment), go long above the fastest EMA. Use S/R lines for stops (below nearest support EMA).
Swing Trading Example: On a daily SPX chart with Swing preset:
Wait for "Weak Uptrend" transition to "Strong" (trend score >50%, positive slopes, volume spike).
Enter long on EMA1 (20) crossing EMA2 (50), confirmed by "BUY" signal.
Target next resistance EMA (e.g., 150), exit on bearish crossover or confluence zone (yellow box signaling potential top).
Risk: Stop below EMA3 (100); aim for 2:1 reward:risk on multi-day holds.
Scalp Trading Example: On a 5-min BTCUSD chart with Scalping preset:
Focus on quick "Weak Bullish" shifts (faded green EMAs, slope >0.01%).
Buy on EMA1 (5) crossing EMA3 (13) with high volume (>1.5x avg).
Scalp 0.2-0.5% gains, exit at slope flattening (dashboard shows <30% strength) or nearest resistance.
Avoid confluences (chop); use 1-min for entries, 15-min for bias.
General Tips:
Combine with price action (e.g., candlestick patterns at confluence zones).
Backtest presets on your asset—adjust thresholds for volatility (e.g., tighter confluence for forex).
Use alerts for hands-off monitoring; multi-timeframe analysis enhances accuracy (higher TF for regime, lower for signals).
For ranging markets ("Neutral" regime), fade extremes near S/R zones.
Examples for Swing Trading
Swing trading focuses on capturing medium-term moves (days to weeks) in trending markets. Use the "Swing Trading" preset, which sets EMAs to 20, 50, 100, 150, 200, 75, 125—balancing sensitivity and smoothness.
Bullish Setup Example: On a daily chart of AAPL, wait for a "Strong Uptrend" regime (green background, bullish alignment label, trend strength >50%). Enter long on a valid bullish crossover (green "BUY" circle) between EMA1 (20) and EMA2 (50), confirmed by high volume. Set stop below nearest support EMA (e.g., EMA3 at 100), target 2-3x risk or next resistance. Hold until bearish crossover or alignment breaks.
Bearish Setup Example: On a 4H chart of EURUSD, spot a "Strong Downtrend" (red background, bearish alignment). Short on a bearish crossover (red "SELL") between EMA1 and EMA3, with volume confirmation. Stop above nearest resistance EMA, exit on confluence zone (yellow) signaling potential reversal.
Tip: Focus on alignments for trend confirmation—avoid trading against them. Use confluence zones as profit-taking areas in ranging markets.
Examples for Scalp Trading
Scalping targets quick, short-term trades (minutes to hours) on lower timeframes. Select the "Scalping" preset for shorter EMAs (5, 8, 13, 21, 34, 55, 89) to catch rapid moves.
Bullish Setup Example: On a 1-min chart of BTCUSD, look for "Weak Uptrend" (faded green background, positive slopes). Enter long on a fast crossover (e.g., EMA1 over EMA2) with high volume and no confluence (avoid chop). Scalp for 0.5-1% gain, exit on slope flattening or bearish cross. Use tight stops below the fastest EMA.
Bearish Setup Example: On a 5-min chart of TSLA, identify "Weak Downtrend" (faded red). Short on a crossover between EMA2 and EMA3, confirmed by volume spike. Target small moves (e.g., 10-20 pips), exit at nearest support EMA or if trend strength drops below 30%.
Tip: Prioritize "Multi-Bar Slope" detection for quick trend shifts. Disable background if it's distracting; focus on crossovers and volume for high-frequency entries. Avoid during confluences, as they signal choppy conditions.
This detailed approach ensures traders can replicate setups while appreciating the indicator's original value. Feedback welcome—let's refine trading edges together!
Auto Levels & Smart Money [ #Algo ] Pro : Smart Levels is Smart Trades 🏆
"Auto Levels & Smart Money Pro" indicator is specially designed for day traders, pull-back / reverse trend traders / scalpers & trend analysts. This indicator plots the key smart levels , which will be automatically drawn at the session's start or during the session, if specific input is selected.
🔶 Usage and Settings :
A :
⇓ ( *refer 📷 image ) ⇓
B :
⇓ ( *refer 📷 images ) ⇓
🔷 Features :
a : automated smart levels with #algo compatibility.
b : plots auto SHADOW candle levels Zones ( smart money concept ).
c : ▄▀ RENKO Emulator engine ( plots Non-repaintable #renko data as a line chart ).
d : session 1st candle's High, Low & 50% levels ( irrespective of chart time-frame ).
e : 1-hour High & Low levels of specific candle, ( from the drop-down menu ), for any global market symbols or crypto.
f : previous Day / Week / Month, chart High & Low.
g : pivot point levels of the Daily, Weekly & Monthly charts.
h : 2 class types of ⏰ alerts ( only signals or algo execution ).
i : auto RENKO box size (ATR-based) table for 30 symbols.
j : auto processes " daylight saving time 🌓" data and plots accordingly.
💠Note: "For key smart levels, it processes data from a customized time frame, which is not available for the *free Trading View subscription users , and requires a premium plan." By this indicator, you have an edge over the paid subscription plan users and can automatically plot the shadow candle levels and Non-repaintable RENKO emulator for the current chart on the free Trading View Plan at any time frame .
⬇ Take a deep dive 👁️🗨️ into the Smart levels trading Basic Demonstration ⬇
▄▀ 1: "RENKO Emulator Engine" ⭐ , plots a noiseless chart for easy Top/Bottom set-up analysis. 10 types of 💼 asset classes options available in the drop-down menu.
LTP is tagged to current RSI ➕ volatility color change for instant decisions.
⇓ ( *refer 📷 image ) ⇓
🟣 2: "Shadow Candle Levels and Zones" will be drawn at the start of the session (which will project shadow candle levels of the previous day), and it comes with a zone. which specifies the Supply and Demand Zone area. *Shadow levels can be drawn for the NSE & BSE: Index/Futures/Options/Equity and MCX: Commodity/FNO market only.
⇓ ( *refer 📷 image ) ⇓https://www.tradingview.com/x/SIskBm77/
🟠 3: plots "Session first candle High, low, and 50%" levels ( irrespective of chart time-frame ), which a very important levels for an intraday trader with add-on levels of Previous Day, Week & Month High and Low levels.
⇓ ( *refer 📷 image ) ⇓
🔵 4: plots "Hourly chart candle" High & Low levels for the specific candles, selected from the drop-down menu with Pivot Points levels of Daily, Weekly, Monthly chart.
Note: The drop-down menu gives a manual selection of the hour candles for all "🌐 Crypto / XAU-USD / Forex / USA".
ex: "2nd hr" will give the session's First hour candle "High & Low" level.
⇓ ( *refer 📷 image ) ⇓
🔲 5: "Auto RENKO box size" ( ATR based ) : This indicator is specially designed for 'Renko' trading enthusiasts, where the Box size of the ' Renko chart ' for intraday or swing trading, ( ATR based ) , automatically calculated for the selected ( editable ) symbols in the table.
⇓ ( *refer 📷 image ) ⇓
*NOTE :
Table symbols are for NSE/BSE/USA.
Symbols are Non-editable (fixed).
Table Symbols for MCX only.
Table Symbols for XAU & 🌐CRYTO.
⏰ 6: "Alert functions."
⇓ ( *refer 📷 image ) ⇓
◻ : Total 8 signal alerts can be possible in a Single alert.
◻ : Total 12 #algo alerts , ( must ✔ tick the Consent check box for algo and alerts execution/trigger ).
💹 Modified moving average line. Includes data from both the exponential and simple moving average.
This Indicator will work like a Trading System . It is different from other indicators, which give Signals only. This script is designed to be tailored to your personal trading style by combining components to create your own comprehensive strategy . The synergy between the components is key to its usefulness.
It focuses on the key Smart Levels and gives you an Extra edge over others.
✅ HOW TO GET ACCESS :
You can see the Author's instructions to get instant access to this indicator & our premium suite. If you like any of my Invite-Only indicators, let me know!
⚠ RISK DISCLAIMER :
All content provided by "TradeWithKeshhav" is for informational & educational purposes only.
It does not constitute any financial advice or a solicitation to buy or sell any securities of any type. All investments / trading involve risks. Past performance does not guarantee future results / returns.
Regards :
TradeWithKeshhav & team
Happy trading and investing!

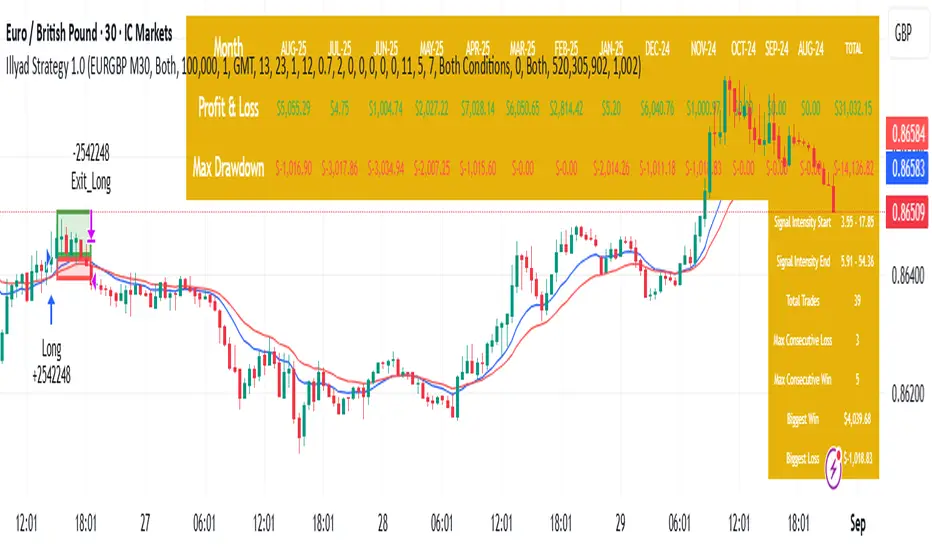
Optimised EURGBP (IC Markets, 30m)Illyad Strategy 1.0 – Optimised EURGBP (IC Markets, 30m)
Description:
This is the Illyad Strategy 1.0 optimised for EURGBP on the 30-minute timeframe (IC Markets feed).
📊 Results (Jan 2024 – Aug 2025):
✅ Total P&L: +£31,032.15 (+31.03%)
📉 Max Drawdown: 2.86% (£3,576.85)
🔁 Total Trades: 39
📈 Win Rate: 58.97%
⚖️ Profit Factor: 2.92
This strategy focuses on controlled drawdown + consistent growth, making it ideal for prop trading challenges and long-term account compounding.
🔧 Optimisation:
Works best on the 30m timeframe.
Each symbol behaves differently — for maximum performance, you should optimise the parameters (MAs, SL/TP, intensity) to the instrument you want to trade.
Example: The EURGBP setup shown here differs from what you’d use on NASDAQ, XAUUSD, or stocks like Tesla.
💡 Best Use Cases:
Passing and scaling prop firm accounts (FTMO, AquaFunded, etc.).
Automated alerts → MT5 integration (hands-free trading).
Consistent, rule-based trading without emotion.
⚠️ Disclaimer:
This script is for educational purposes only. Past results don’t guarantee future performance. Always backtest and forward-test on demo before live trading.
📲 Next Steps:
This version shows the EURGBP optimisation. If you want to run it on other pairs, indices, or stocks → simply optimise parameters for that symbol.
👉 For full automation (TradingView → MT5 execution), check my profile for details.
Inside Bar With Alert - RajThis indicator helps you reduce your screen time by giving you consistent alerts on the formation of inside bar candle and it gives you bullish and bearish alerts on breakout of the mother candle. So if you believe in inside strategy this indicator will be helpful for you.

High-Low Breakout Strategy with ATR traling Stop LossThis script is a TradingView Pine Script strategy that implements a High-Low Breakout Strategy with ATR Trailing Stop.created by SK WEALTH GURU, Here’s a breakdown of its key components:
Features and Functionality
Custom Timeframe and High-Low Detection
Allows users to select a custom timeframe (default: 30 minutes) to detect high and low levels.
Tracks the high and low within a user-specified period (e.g., first 30 minutes of the session).
Draws horizontal lines for high and low, persisting for a specified number of days.
Trade Entry Conditions
Long Entry: If the closing price crosses above the recorded high.
Short Entry: If the closing price crosses below the recorded low.
The user can choose to trade Long, Short, or Both.
ATR-Based Trailing Stop & Risk Management
Uses Average True Range (ATR) with a multiplier (default: 3.5) to determine a dynamic trailing stop-loss.
Trades reset daily, ensuring a fresh start each day.
Trade Execution and Partial Profit Taking
Stop-loss: Default at 1% of entry price.
Partial profit: Books 50% of the position at 3% profit.
Max 2 trades per day: If the first trade hits stop-loss, the strategy allows one re-entry.
Intraday Exit Condition
All positions close at 3:15 PM to ensure no overnight risk.

SMB MagicSMB Magic
Overview: SMB Magic is a powerful technical strategy designed to capture breakout opportunities based on price movements, volume spikes, and trend-following logic. This strategy works exclusively on the XAU/USD symbol and is optimized for the 15-minute time frame. By incorporating multiple factors, this strategy identifies high-probability trades with a focus on risk management.
Key Features:
Breakout Confirmation:
This strategy looks for price breakouts above the previous high or below the previous low, with a significant volume increase. A breakout is considered valid when it is supported by strong volume, confirming the strength of the price move.
Price Movement Filter:
The strategy ensures that only significant price movements are considered for trades, helping to avoid low-volatility noise. This filter targets larger price swings to maximize potential profits.
Exponential Moving Average (EMA):
A long-term trend filter is applied to ensure that buy trades occur only when the price is above the moving average, and sell trades only when the price is below it.
Fibonacci Levels:
Custom Fibonacci retracement levels are drawn based on recent price action. These levels act as dynamic support and resistance zones and help determine the exit points for trades.
Take Profit/Stop Loss:
The strategy incorporates predefined take profit and stop loss levels, designed to manage risk effectively. These levels are automatically applied to trades and are adjusted based on the market's volatility.
Volume Confirmation:
A volume multiplier confirms the strength of the breakout. A trade is only considered when the volume exceeds a certain threshold, ensuring that the breakout is supported by sufficient market participation.
How It Works:
Entry Signals:
Buy Signal: A breakout above the previous high, accompanied by significant volume and price movement, occurs when the price is above the trend-following filter (e.g., EMA).
Sell Signal: A breakout below the previous low, accompanied by significant volume and price movement, occurs when the price is below the trend-following filter.
Exit Strategy:
Each position (long or short) has predefined take-profit and stop-loss levels, which are designed to protect capital and lock in profits at key points in the market.
Fibonacci Levels:
Fibonacci levels are drawn to identify potential areas of support or resistance, which can be used to guide exits and stop-loss placements.
Important Notes:
Timeframe Restriction: This strategy is designed specifically for the 15-minute time frame.
Symbol Restriction: The strategy works exclusively on the XAU/USD (Gold) symbol and is not recommended for use with other instruments.
Best Performance in Trending Markets: It works best in trending conditions where breakouts occur frequently.
Disclaimer:
Risk Warning: Trading involves risk, and past performance is not indicative of future results. Always conduct your own research and make informed decisions before trading.

Innocent Heikin Ashi Ethereum StrategyHello there, im back!
If you are familiar with my previous scripts, this one will seem like the future's nostalgia!
Functionality:
As you can see, all candles are randomly colored. This has no deeper meaning, it should remind you to switch to Heikin Ashi. The Strategy works on standard candle stick charts, but should be used with Heikin Ashi to see the actual results. (Regular OHLC calculations are included.)
Same as in my previous scripts we import our PVSRA Data from @TradersReality open source Indicator.
With this data and the help of moving averages, we have got an edge in the market.
Signal Logic:
When a "violently green" candle appears (high buy volume + tick speed) above the 50 EMA indicates a change in trend and sudden higher prices. Depending on OHLC of the candle itself and volume, Take Profit and Stop Loss is calculated. (The price margin is the only adjustable setting). Additionally, to make this script as simple and easily useable as possible, all other adjustable variables have been already set to the best suitable value and the chart was kept plain, except for the actual entries and exits.
Basic Settings and Adjustables:
Main Input 1: TP and SL combined price range. (Double, Triple R:R equally.)
Trade Inputs: All standard trade size and contract settings for testing available.
Special Settings:
Checkbox 1: Calculate Signal in Heikin Ashi chart, including regular candle OHLC („Open, High, Low, Close“)
Checkbox 2/3: Calculate by order fill or every tick.
Checkbox 4: Possible to fill orders on bar close.
Timeframe and practical usage:
Made for the 5 Minute to 1 hour timeframe.
Literally ONLY works on Ethereum and more or less on Bitcoin.
EVERY other asset has absolute 0% profitability.
Have fun and share with your friends!
Thanks for using!
Example Chart:

Liquidity Founder The Liquidity Swings indicator aids traders in detecting liquidity swings within the market, providing essential insights for making well-informed trading decisions. Key features include:
How this Indicator work - this indicator search pivot point that is used to determine the levels at which price may face support or resistance. The Pivot Points indicator consists of a pivot point (PP) level and several support (S) and resistance (R) levels. if input number of bar selected 3 than it will look back 3 candle and wait for next 3 candle to make pivot high and low after it identify pivot it draw a line and extend until it no longer intersects with the high or low prices
What is different in my indicator compared to a normal pivot point and what Makes This Indicator Original :
1) Swing High and Low Logic:It avoids marking consecutive pivot highs until a new pivot low is formed, reducing market noise and highlighting significant trend reversals.
2)Volume Integration: By incorporating volume data, the indicator ensures that pivot points are validated with sufficient market activity, enhancing their reliability as support and resistance levels.
3) Multi-Time Frame Analysis:The ability to input and analyze multiple time frames allows the indicator to draw strong support and resistance levels that are relevant across different trading periods, making it versatile for various trading strategies.
🟠 Liquidity Swings indicator
✅Visualization of Liquidity Zones:Accumulation Areas: Identifying regions where liquidity is gathering.liquidity Sweeps: Pinpointing areas where liquidity is being cleared.
✅Pivot and Volume Analysis:Price Pivots: Monitoring significant pivots in price.
Volume Correlation: Linking price pivots with volume to highlight zones of potential support and resistance.
✅Market Dynamics Understanding:Enables traders to visualize and understand market dynamics more effectively.Assists in pinpointing potential support and resistance levels based on liquidity swings.
⭐Example -EurUsd 1 minutes chart developed Potential Support and Resistance Zone
⭐⭐⭐Key Features:
1) Adjustable Time Frame: Allows traders to analyze different periods by modifying the time frame setting.
2) Swing Look back Period: Sets the period for identifying potential price swings, enhancing flexibility in analysis.
🟠 Understanding Strong Support :These are identified by dense clusters of green lines, indicating high concentrations of buy orders that have not yet been executed. These areas suggest strong buying interest which can potentially halt further price declines.
⭐ Example -below chart image BtcUsd 5 minutes 2 line are still not touched by price
⭐⭐⭐Reasons for Strong Support:
✅Untouched Liquidity Lines: These green lines represent pending buy orders, indicating robust buying interest at these levels.
✅Accumulation of Orders: Many buy orders are aggregated in these zones, capable of preventing further price drops when approached.
✅ Historical Performance: These areas have previously prevented price declines, establishing them as reliable support zones.
✅ Market Confidence: Close clustering of green lines signifies widespread trader belief in favorable buying conditions, reinforcing support strength.
🟠 Understanding Strong Resistance :Highlighted by dense clusters of red lines, denoting substantial sell orders that did not executed. These zones signify significant selling interest which can impede further price increases.
⭐ Example -below chart image Btcusd 3 minutes 3 line did touched by price previously .price touched that area and retraced because of unfilled liquidity
⭐⭐⭐ Reasons for Strong Support:
✅ Untouched Liquidity Lines: These green lines represent pending buy orders, indicating robust buying interest at these levels.
✅ Accumulation of Orders: Many buy orders are aggregated in these zones, capable of preventing further price drops when approached.
✅ Historical Performance: These areas have previously prevented price declines, establishing them as reliable support zones.
✅ Market Confidence: Close clustering of green lines signifies widespread trader belief in favorable buying conditions, reinforcing support strength.
⭐⭐⭐ Usage of the Liquidity Founder Indicator ⭐⭐⭐
👍 Identifying Liquidity Zones: Pinpoints areas with dense clusters of pending buy (green) or sell (red) orders, providing initial entry points where significant buying or selling interest is concentrated.
👍 Avoiding Market Traps: Helps traders steer clear of market fluctuations or false breakouts by focusing on stable liquidity zones.
How to Use this indicator for Maximum benefit -
1) When the price approaches a cluster of resistance levels, traders should look for a candle showing rejection (e.g., a bearish reversal candle) to enter a short trade.
2)When the price approaches a cluster of support levels, traders should look for a candle showing rejection (e.g., a bullish reversal candle) to enter a long trade.
3) The identified liquidity levels offer a clear understanding of significant support and resistance areas, helping traders make more informed trading decisions.
4) Fake breakouts above resistance or below support clusters. If the price breaks above resistance and then falls back below, it can be a signal to enter a short trade vice versa if price break support cluster and back again above support cluster it can be a long trade

Chande Kroll Trend Strategy (SPX, 1H) | PINEINDICATORSThe "Chande Kroll Stop Strategy" is designed to optimize trading on the SPX using a 1-hour timeframe. This strategy effectively combines the Chande Kroll Stop indicator with a Simple Moving Average (SMA) to create a robust method for identifying long entry and exit points. This detailed description will explain the components, rationale, and usage to ensure compliance with TradingView's guidelines and help traders understand the strategy's utility and application.
Objective
The primary goal of this strategy is to identify potential long trading opportunities in the SPX by leveraging volatility-adjusted stop levels and trend-following principles. It aims to capture upward price movements while managing risk through dynamically calculated stops.
Chande Kroll Stop Parameters:
Calculation Mode: Offers "Linear" and "Exponential" options for position size calculation. The default mode is "Exponential."
Risk Multiplier: An adjustable multiplier for risk management and position sizing, defaulting to 5.
ATR Period: Defines the period for calculating the Average True Range (ATR), with a default of 10.
ATR Multiplier: A multiplier applied to the ATR to set stop levels, defaulting to 3.
Stop Length: Period used to determine the highest high and lowest low for stop calculation, defaulting to 21.
SMA Length: Period for the Simple Moving Average, defaulting to 21.
Calculation Details:
ATR Calculation: ATR is calculated over the specified period to measure market volatility.
Chande Kroll Stop Calculation:
High Stop: The highest high over the stop length minus the ATR multiplied by the ATR multiplier.
Low Stop: The lowest low over the stop length plus the ATR multiplied by the ATR multiplier.
SMA Calculation: The 21-period SMA of the closing price is used as a trend filter.
Entry and Exit Conditions:
Long Entry: A long position is initiated when the closing price crosses over the low stop and is above the 21-period SMA. This condition ensures that the market is trending upward and that the entry is made in the direction of the prevailing trend.
Exit Long: The long position is exited when the closing price falls below the high stop, indicating potential downward movement and protecting against significant drawdowns.
Position Sizing:
The quantity of shares to trade is calculated based on the selected calculation mode (linear or exponential) and the risk multiplier. This ensures position size is adjusted dynamically based on current market conditions and user-defined risk tolerance.
Exponential Mode: Quantity is calculated using the formula: riskMultiplier / lowestClose * 1000 * strategy.equity / strategy.initial_capital.
Linear Mode: Quantity is calculated using the formula: riskMultiplier / lowestClose * 1000.
Execution:
When the long entry condition is met, the strategy triggers a buy signal, and a long position is entered with the calculated quantity. An alert is generated to notify the trader.
When the exit condition is met, the strategy closes the position and triggers a sell signal, accompanied by an alert.
Plotting:
Buy Signals: Indicated with an upward triangle below the bar.
Sell Signals: Indicated with a downward triangle above the bar.
Application
This strategy is particularly effective for trading the SPX on a 1-hour timeframe, capitalizing on price movements by adjusting stop levels dynamically based on market volatility and trend direction.
Default Setup
Initial Capital: $1,000
Risk Multiplier: 5
ATR Period: 10
ATR Multiplier: 3
Stop Length: 21
SMA Length: 21
Commission: 0.01
Slippage: 3 Ticks
Backtesting Results
Backtesting indicates that the "Chande Kroll Stop Strategy" performs optimally on the SPX when applied to the 1-hour timeframe. The strategy's dynamic adjustment of stop levels helps manage risk effectively while capturing significant upward price movements. Backtesting was conducted with a realistic initial capital of $1,000, and commissions and slippage were included to ensure the results are not misleading.
Risk Management
The strategy incorporates risk management through dynamically calculated stop levels based on the ATR and a user-defined risk multiplier. This approach ensures that position sizes are adjusted according to market volatility, helping to mitigate potential losses. Trades are sized to risk a sustainable amount of equity, adhering to the guideline of risking no more than 5-10% per trade.
Usage Notes
Customization: Users can adjust the ATR period, ATR multiplier, stop length, and SMA length to better suit their trading style and risk tolerance.
Alerts: The strategy includes alerts for buy and sell signals to keep traders informed of potential entry and exit points.
Pyramiding: Although possible, the strategy yields the best results without pyramiding.
Justification of Components
The Chande Kroll Stop indicator and the 21-period SMA are combined to provide a robust framework for identifying long trading opportunities in trending markets. Here is why they work well together:
Chande Kroll Stop Indicator: This indicator provides dynamic stop levels that adapt to market volatility, allowing traders to set logical stop-loss levels that account for current price movements. It is particularly useful in volatile markets where fixed stops can be easily hit by random price fluctuations. By using the ATR, the stop levels adjust based on recent market activity, ensuring they remain relevant in varying market conditions.
21-Period SMA: The 21-period SMA acts as a trend filter to ensure trades are taken in the direction of the prevailing market trend. By requiring the closing price to be above the SMA for long entries, the strategy aligns itself with the broader market trend, reducing the risk of entering trades against the overall market direction. This helps to avoid false signals and ensures that the trades are in line with the dominant market movement.
Combining these two components creates a balanced approach that captures trending price movements while protecting against significant drawdowns through adaptive stop levels. The Chande Kroll Stop ensures that the stops are placed at levels that reflect current volatility, while the SMA filter ensures that trades are only taken when the market is trending in the desired direction.
Concepts Underlying Calculations
ATR (Average True Range): Used to measure market volatility, which informs the stop levels.
SMA (Simple Moving Average): Used to filter trades, ensuring positions are taken in the direction of the trend.
Chande Kroll Stop: Combines high and low price levels with ATR to create dynamic stop levels that adapt to market conditions.
Risk Disclaimer
Trading involves substantial risk, and most day traders incur losses. The "Chande Kroll Stop Strategy" is provided for informational and educational purposes only. Past performance is not indicative of future results. Users are advised to adjust and personalize this trading strategy to better match their individual trading preferences and risk tolerance.

Sniper BreakoutThis indicator is based on 3 indicator :=
1) Forex Market Session 2) Ema 200 3) Volume
This indicator is for Forex market ..in Forex market (ex- Eur/Usd ) price often (67%) do rotation in every session means example :let suppose a trade take trade in asian session and have 30 pips stop loss 67 % chance price will come back to entry price after London session or New York session so trade have less chance to make trade without hitting stop loss
in this indicator we are using Forex market session indicator to get session range start to end ..this indicator will only search opportunity in London And New York Session range and that can be customize from input section . user can select time zone and time of session from input section indicator and color of session .
next indicator using 200 length Exponential Moving Average for trend identification .if close price is above 200 Ema means trend is upside moving & if close price is below 200 Ema means price is moving downside .user can change length and source of Ema from input section .
Third and most important part is volume indicator when a session start (Example-London session it keep Look back 6 previous candle and compare volume imbalance between look back candle .look back candle can be customize from input section default look back candle input is (6).
next we are using trade range time to only show trade on certain time because often market convert into trading range so given specific input time it only take trade when volume and price is rising or falling .time range can be selected from input section .
Trade Entry Buy Signal -if price is either London or New York session and price is above 200 Ema and volume not in imbalance last number of candle it give Feb (first entry buy ) we keep save high price of every candle after Feb (label ) signal .if any candle break above Feb label it show a confirm buy signal ..Below in example as we can see
Example Image Buy Signal -
in this above example step -1 we searching imbalance of volume and price as we can see imbalance of volume and price on green candle .next we look price is above 200 ema .next step(2) we got Feb (first entry buy ) signal this is not a confirm buy signal .we save high of candle next candle high close above previous candle high we got confirm buy signal .
Trade Entry Sell Signal - if price is either London or New York session and price is below 200 Ema and volume not in imbalance last number of candle it give Feb (first entry Sell ) we keep save low price of every candle after Fes (label ) signal .if any candle break below Fes label it show a confirm sell signal ..Below in example as we can see
step-1 starting of london session we start getting imbalance between price and volume .price is getting rejected but volume is rising on green candle we got fes (first entry sell signal ).next we save low of fes candle but price close above that low of candle we dont get confirm sell entry next price break below low of previous candle so open a new sell signal ..
Example 3 - No Confirm buy/sell Signal
In this above Image example we did not get any confirm signal...we got first entry buy signal but price did not close high of candle in london session .so that day chance price can go any side ..
Example 4 -Feb signal and later confirm buy entry
in this above example we got imbalance of volume and feb(first entry buy signal) but we dont get any confirm buy signal price is just going high then previous candle ..later we see price crossover high of previous candle we got confirm buy signal
Use Of Indicator - This indicator helps traders identify potential trade setups by signaling the first entry points and confirming them later. It's particularly useful for avoiding getting caught in price rotations and aligning trades with significant volume and price movements. Traders should analyze price action and news before confirming a trade.

5 ema strategyThis Strategy is based of Subhashish Pani's (power of stocks) 5 EMA Strategy.strategy used for sell in 5 minutes and for buy in 15 minutes ..
Rules for this strategy ..
Sell signal -
1) if price is above 5 Ema and not touching Ema use as alert candle..
2) if price break low of alert candle strategy open trade ..
3) if price move more upside low of alert candle keep change into next candle ..
4) input we can select number of trade per day .as rule should take only 4 signal should execute
5) stop loss is fixed highest high of last 2 candle and take profit is input multiply of stop loss
buy signal-
1) if price is below 5 Ema and not touching Ema use as alert candle..
2) if price break high of alert candle strategy open trade ..
3) if price move more downside high of alert candle keep change into next candle ..
4) input we can select number of trade per day .as rule should take only 4 signal should execute
5) stop loss is fixed lowest low of last 2 candle and take profit is input multiply of stop loss
notes -input can be selected which side should take signal either buy or sell side ...number of trade can be adjusted ..
Disclaimer -Traders can use this script as a starting point for further customization or as a reference for developing their own trading strategies. It's important to note that past performance is not indicative of future results, and thorough testing and validation are recommended before deploying any trading strategy.

DCA-Integrated Trend Continuation StrategyIntroducing the DCA-Integrated Trend Continuation Strategy 💼💰
The DCA-Integrated Trend Continuation Strategy represents a robust trading methodology that harnesses the potential of trend continuation opportunities while seamlessly incorporating the principles of Dollar Cost Averaging (DCA) as a risk management and backup mechanism. This strategy harmoniously blends these two concepts to potentially amplify profitability and optimize risk control across diverse market conditions.
This strategy is well-suited for both trending and ranging markets. During trending markets, it aims to capture and ride the momentum of the trend while optimizing entry points. In ranging markets or pullbacks, the DCA feature comes into play, allowing users to accumulate more assets at potentially lower prices and potentially increase profits when the market resumes its upward trend. This cohesive approach not only enhances the overall effectiveness of the strategy but also fosters a more resilient and adaptable trading approach in ever-changing market dynamics.
💎 How it Works:
▶️ The strategy incorporates a customizable entry signal based on candlestick patterns, enabling the identification of potential trend continuation opportunities. By focusing on consecutive bullish candles, it detects the presence of bullish momentum, indicating an optimal time to enter a long position.
To refine the precision of the signals, traders can set a specific percentage threshold for the closing price of the candle, ensuring it is above a certain percentage of its body. This condition verifies strong bullish momentum and confirms significant upward movement within the candle, thereby increasing the reliability of the signal.
In addition, the strategy offers further confirmation by examining the relationship between the closing price of the signal candle and its previous candles. If the closing price of the signal candle is higher than its preceding candles, it provides an additional layer of assurance before entering a position. This approach is particularly effective in detecting sharp movements and capturing significant price shifts, as it focuses on identifying instances where the closing price shows clear strength and outperforms the previous candle's price action. By prioritizing such occurrences, the strategy aims to capture robust trends and capitalize on notable market movements.
▶️ During market downturns, the strategy incorporates intelligent management of price drops, offering flexibility through fixed or customizable price drop percentages. This unique feature allows for additional entries at specified drop percentages, enabling traders to accumulate positions at more favorable prices.
By strategically adjusting the custom price drop percentages, you can optimize your entry points to potentially maximize profitability. Utilizing lower percentages for initial entries takes advantage of price fluctuations, potentially yielding higher returns. On the other hand, employing higher percentages for final entries adopts a more cautious approach during significant market downturns, emphasizing enhanced risk management. This adaptive approach ensures that the strategy effectively navigates challenging market conditions while seeking to optimize overall performance.
▶️ To enhance performance and mitigate risks, the strategy integrates average purchase price management. This feature dynamically adjusts the average buy price percentage decrease after each price drop, expediting the achievement of the target point even in challenging market conditions. By reducing recovery times and ensuring investment safety, this strategy optimizes outcomes for traders.
▶️ Risk management is at the core of this strategy, prioritizing the protection of capital. It incorporates an account balance validation mechanism that conducts automatic checks prior to each entry, ensuring alignment with available funds. This essential feature provides real-time insights into the affordability of price drops and the number of entries, enabling traders to make informed decisions and maintain optimal risk control.
▶️ Furthermore, the strategy offers take profit options, allowing traders to secure gains by setting fixed percentage profits from the average buy price or using a trailing target. Stop loss protection is also available, enabling traders to set a fixed percentage from the average purchase price to limit potential losses and preserve capital.
▶️ This strategy is fully compatible with third-party trading bots, allowing for easy connectivity to popular trading platforms. By leveraging the TradingView webhook functionality, you can effortlessly link the strategy to your preferred bot and receive accurate signals for position entry and exit. The strategy provides all the necessary alert message fields, ensuring a smooth and user-friendly trading experience. With this integration, you can automate the execution of trades, saving time and effort while enjoying the benefits of this powerful strategy.
🚀 How to Use:
To effectively utilize the DCA-Integrated Trend Continuation Strategy, follow these steps:
1. Choose your preferred DCA Mode - whether by quantity or by value - to determine how you want to size your positions.
2. Customize the entry conditions of the strategy to align with your trading preferences. Specify the number of consecutive bullish candles, set a desired percentage threshold for the close of the signal candle relative to its body, and determine the number of previous candles to compare with.
3. Adjust the pyramiding parameter to suit your risk tolerance and desired returns. Whether you prefer a more conservative approach with fewer pyramids or a more aggressive stance with multiple pyramids, this strategy offers flexibility.
4. Personalize the price drop percentages based on your risk appetite and trading strategy. Choose between fixed or custom percentages to optimize your entries in different market scenarios.
5. Configure the average purchase price management settings to control the percentage decrease in the average buy price after each price drop, ensuring it aligns with your risk tolerance and strategy.
6. Utilize the account balance validation feature to ensure the strategy's actions align with your available funds, enhancing risk management and preventing overexposure.
7. Set take profit options to secure your gains and implement stop loss protection to limit potential losses, providing an additional layer of risk management.
8. Use the date and time filtering feature to define the duration during which the strategy operates, allowing for specific backtesting periods or integration with a trading bot.
9. For automated trading, take advantage of the compatibility with third-party trading bots to seamlessly integrate the strategy with popular trading platforms.
By following these steps, traders can harness the power of the DCA-Integrated Trend Continuation Strategy to potentially maximize profitability and optimize their trading outcomes in both trending and ranging markets.
⚙️ User Settings:
To ensure the backtest result is representative of real-world trading conditions, particularly in the highly volatile Crypto market, the default strategy parameters have been carefully selected to produce realistic results with a conservative approach. However, you have the flexibility to customize these settings based on your risk tolerance and strategy preferences, whether you're focusing on short-term or long-term trading, allowing you to potentially achieve higher profits. The backtesting was conducted using the BTCUSDT pair in 15-minute timeframe on the Binance exchange. Users can configure the following options:
General Settings:
- Initial Capital (Default: $10,000)
- Currency (Default: USDT)
- Commission (Default: 0.1%)
- Slippage (Default: 5 ticks)
Order Size Management:
- DCA Mode (Default: Quantity)
- Order Size in Quantity (Default: 0.01)
- Order Size in Value (Default: $300)
Strategy's Entry Conditions:
- Number of Consecutive Bullish Candles (Default: 3)
- Close Over Candle Body % (Default: 50% - Disabled)
- Close Over Previous Candles Lookback (Default: 14 - Disabled)
- Pyramiding Number (Default: 30)
Price Drop Management:
- Enable Price Drop Calculations (Default: Enabled)
- Enable Current Balance Check (Default: Enabled)
- Price Drop Percentage Type (Default: Custom)
- Average Price Move Down Percentage % (Default: 50%)
- Fixed Price Drop Percentage % (Default: 0.5%)
- Custom Price Drop Percentage % (Defaults: 0.5, 0.5, 0.5, 1, 3, 5, 5, 10, 10, 10)
TP/SL:
- Take Profit % (Default: 3%)
- Stop Loss % (Default: 100%)
- Enable Trailing Target (Default: Enabled)
- Trailing Offset % (Default: 0.1%)
Backtest Table (Default: Enabled)
Date & Time:
- Date Range Filtering (Default: Disabled)
- Start Time
- End Time
Alert Message:
- Alert Message for Enter Long
- Alert Message for Exit Long
By providing these customizable settings, the strategy allows you to tailor it to your specific needs, enhancing the adaptability and effectiveness of your trading approach.
🔐 Source Code Protection:
The source code of the DCA-Integrated Trend Continuation Strategy is designed to be robust, reliable, and highly efficient. Its original and innovative implementation merits protecting the source code and limiting access, ensuring the exclusivity of this strategy. By safeguarding the code, the integrity and uniqueness of the strategy are preserved, giving users a competitive edge in their trading activities.

ATR_RSI_Strategy v2 with no repaint [liwei666]🎲 Overview
🎯 this is a optimized version based on ATR_RSI_Strategy with no-repaint.
Sharpe ratio: 1.4, trade times: 116 ,
trade symbol: BINANCE:BTCUSDTPERP 15M
you can get same backtesting result with the correct settings.
🎲 Strategy Logic
🎯 the core logic is quite simple, use ATR and RSI and SMA
1. when price is in high volatility ( atr_value > atr_ma);
2. wait for a break signal (rsi_value > rsi_buy or rsi_value < rsi_sell);
3. entry Long or Short,use trailing stop-loss to max security and percent TP to keep profit.
🎲 Settings
🎯 there are 7 input properties in script, but I only finetune 4 of them ( bold field below ),
you may change other parameter to get better result by yourself.
atr_length: length to get atr value
atr_ma_length : length of smoothing atr value
atr_ma_norm_min : atr_ma normalized min value, filter high volatility ranges
atr_ma_norm_max : atr_ma normalized max value, filter high volatility ranges
rsi_length : length to get rsi value
rsi_entry: 50 +/- rsi_entry to get entry threshold
trailing_percent: trailing stop-loss percent
🎲 Usage
🎯 the commission set to 0.05% , part of exchange the commission is less than 0.05% in reality,
but I will still use 0.05% in my next script.
🎯 this script use 50% of equity to size positions follow general script position,
you can adjust the value to fix size or 100% of equity to compare result with other strategy,
but I still suggest you use 5-10% of equity for each strategy in reality.
🎯any questions please comment below. if there are any words violate House Rule, please tell me below and i will revise immediately
don't want be hiddened again 😂😂
Additionally, I plan to publish 20 profitable strategies in 2023;
let‘s witness it together!
Hope this strategy will be usefull for you :)
enjoy! 🚀🚀🚀

TradingWolf Premium OscillatorsThe TradingWolf Premium Oscillators is a unique and enhanced selection of oscillators designed to help give you an edge on the markets.
Within this one indicator you will have access to RSI, Stochastic, MACD, Awesome Oscillator, Wavetrend, Zig Zag Pivots and DPO.
Including Divergence and Hidden Divergence signals for them.
Below each indicator is explained along with its enhancements to help you understand it better.
This script comes with the 'TradingWolf Premium' to get access, read the Author’s Instructions below.
There are extensive explanations on how to use these oscillators in our documentation on the website but we will give a simple overview here.
RSI
We try not to mess with these too much because if used correctly, they are very powerful tools. The main differences you will notice is that we have highlighted the areas where you should be paying attention to the oscillator with reversal/continuation zones.
The most popular feature from these will be the 4 divergences which can be toggled on or off in the settings.
Stochastic
Stochastic we have tried to keep as similar to the original as possible, main features are being able to select alternate timeframes for it to be calculated on as well as displaying divergences.
We have created a highlighted zone for when price enters the overbought/sold territory. A lot of traders will look for crossovers happening in these areas however from our tests we have discovered entering trades as the Stochastic comes out of these areas has hugely reduced losing trades, still not a perfect strategy but it does often show that the trend is showing weakening momentum and its commonly followed by a period of sideways action before continuing in a new direction.
MACD
We have calculated a dynamic extreme range for the MACD, you will notice the green/red bars as the bottom and top of the Oscillator. These levels help adjust with the assets volatility so they will work universally on all assets and timeframes. When these levels get more narrow, this indicates there is a potential larger move to come, similar thought process to a Bollinger band squeeze.
We like the Divergence signals you receive whilst in this OB/OS range as they give more confluence behind the divergence signal that price has over extended and is looking to retrace or consolidate.
Awesome Oscillator
The Awesome Oscillator is based on some pretty simple calculations but is hugely powerful.
The 3 main use cases are crossing the 0 value, showing weakening momentum and divergence signals.
We Particularly like the Divergence signals it gives us as they tend to be more accurate than any other oscillator.
Wavetrend
Wavetrend we try describe as a more dynamic Stochastic/MACD, it moves smoother and quicker without giving too many false signals.
Conditions we use the Wavetrend for are similar to the MACD where we are looking for crossovers or divergences in the extreme bands, these shouldn’t be used to trade alone and should be paired with other pieces of confluence for a higher probability trade however this is one of our favourites.
We also have a VWAP extreme detector which we pair with the Wavetrend, helping us identify areas where price should start cooling off.
Zig Zag
The main purpose of the standard Zig Zag is to analyse historical data to be able to observe cycle's in a market's movement, this requires a bit more explanation than we can include here so please refer to our documentation on the website for further guidance.
DPO
The detrended price oscillator is unlike other oscillators, such as the Stochastic or MACD the DPO is not a momentum indicator. It instead highlights peaks and troughs in price, which are used to estimate buy and sell points in line with the historical cycle.
We personally think this is the most under-rated oscillator out there, if you simply followed the DPO above 0 for long and below for short on higher timeframes you can outperform the buy and hold return of Bitcoin (BTCUSDT)...
This is just one simple way of using the DPO there are other more in depth methods of using it within our documentation.

Trend Follower Intraday [ Adjustable TF ]Trend Follower Intraday for 3 minute Time-Frame (Adjustable) , that has the time condition for Indian Markets as well.
Unlike the Free Scripts - Risk Management , Position Sizing , Partial Exit etc. are also included .
Send us a Message to know more about the strategy.
// ══════════════════════════════════════════════════════════════════════════ //
The Timing can be changed to fit other markets, scroll down to "TIME CONDITION" to know more.
The commission is also included in the strategy .
The basic idea is when ,
1) EMA1 crosses above EMA2 , is a Long condition .
2) EMA1 crosses below EMA2 , is a Short condition .
3) Green Section indicates Long position.
4) Red Section indicates Short position.
5) Allowed hours specifies the trade entry timing.
6) ATR STOP is the stop-loss value on chart , can be adjusted in INPUTS.
7) Target 1 is the 1st target value on chart , can be adjusted in INPUTS.
8) RISK is Maximum Risk per trade for the intraday trade can be changed .
9) Total Capital used can be adjusted under INPUTS.
10) ATR TRAIL is used for trailing after entry, as mentioned in the inputs below.
11) Check trades under the list of trades .
12) Trade only in liquid stocks .
13) Risk only 1-5% of total capital.
14) Inputs can be changed for better back-test results, but also manually check the trades before setting alerts
15) SQUARE OFF TIME - As you change the time frame , also change the square-off time to the candle's closing time.
Eg: For 3min Time-frame , Hour = 2Hrs | Minute = 57min
16) Strategy stops for the day if you have a loss .
17) COMMISSION value is set to 20Rs and SLIPPAGE value is set to 2 . Go to properties to change it .
*The input values and the results are mentioned under "BACKTEST RESULTS" below*
// ══════════════════════════════ //
// ————————> RISK MANAGEMENT <——————— //
// ══════════════════════════════ //
Risk management is done based on max loss per trade and can be adjusted in the INPUTS.
// ═══════════════════════════ //
// ————————> POSITION SIZE <——————— //
// ═══════════════════════════ //
Quantity of each trade is different based on the loss
// ═════════════════════════ //
// ————————> PROPERTIES <——————— //
// ═════════════════════════ //
COMMISSION , SLIPPAGE ,RECALCULATE is already mentioned in the code.
COMMISSION can be charges , based on the broker charges.
// ═══════════════════════════════//
// ————————> TIME CONDITION <————————— //
// ═══════════════════════════════//
The time can be changed in the INPUT.
The Indian Markets open at 9:15am and closes at 3:30pm.
The 'Allowed hours' under Inputs specifies the time at which Entries should happen .
"Close All" function closes all the trades before 3pm , at the open of the next candle.
To change the time to close all trades , check INPUT.
All open trades get closed by 3pm , because some brokers don't allow you to place fresh intraday orders after 3pm .
// ═══════════════════════════════════════════════ //
// ————————> BACKTEST RESULTS ( 123 CLOSED TRADES ) <————————— //
// ═══════════════════════════════════════════════ //
INPUTS can be changed for better Back-Test results.
The strategy applied to NSE:JSWENERGY (3 min Time-Frame and with a capital of 3,00,000 ) gives us 81% profitability , as shown below
It was tested for a period a 6 months with a Profit Factor of 1.957 ,net Profit of 43,000Rs .
Sharpe Ratio = 0.745
Sortino Ratio = 2.091
No strategy in the world promises 100% profits in all market conditions , so always define your risk before trading.
Also check Back-Test results manually ,before setting Alerts
The Graph has a Linear Curve with Consistent Profits.
The INPUTS are as follows,
1) EMA1 ————————————————> 38
2) EMA2 ————————————————> 118
3) ALLOWED HRS ———————————> 9:35 TO 14:30
4) ATR STOP ——————————————> 3.2
5) RISK ——————————————————> 3000
6) ATR TRAIL ———————————————> 2.6
7) TARGET 1 ————————————————> 2.4
8) MAX POSITION VALUE ——————————> 3,00,000
8) MAX DRAWDOWN —————————————> 9,000
8) SQUARE-OFF ————————————————> 14:57
NSE:JSWENERGY
Apply it to your charts Now !
NSE:JSWENERGY
Send us a message for FREE TRIALS | Instant Access
Thank You ☺

TradingWolf Premium PatternsThe TradingWolf Premium is a one of a kind indicator which can identify charting patterns unlike any others. Standard Chart patterns take 10+ candles to recognise where as ares are almost instant without repainting!
Within this one indicator you will have access to Break Out Levels , Dynamic Support and resistance, Bull Flag, Bear Flag, Rising Wedge, Falling Wedge, Inverse Head & Shoulders, Head & Shoulders, Double Top, Double Bottom, Trend Lines, Ascending Triangle, Descending Triangle, Parallel Channel & Linear Regression Channels.
Below each indicator is explained along with its enhancements to help you understand it better.
This script comes with the 'TradingWolf Premium' to get access, read the Author’s Instructions below.
There are extensive explanations on how to use this indicator in our documentation on the website but we will give a simple overview here.
Break Out Levels
Break out levels are great for breakout traders, this indicator is scanning for strong points of support & resistance, it does this by finding pivot points where price has had a noticeable pull back. From there it will monitor that level and display a signal soon as price breaks it.
Another use case for this indicator is helping identify the market structure direction. If we are breaking up and getting Green triangles, this suggests we are in a bullish up-trending structure and vice versa for red bearish signals.
Support & Resistance
There are lots of ways of deciding how to mark up support and resistance, we like to use ATR values related to daily price action. Marking levels up on lower timeframes tend not to give such good levels to play whereas calculating values from the Higher time frames gives us levels we know are more like to be respected.
Although they are calculated from the daily timeframe you will notice these levels will adjust to the daily price action to make sure they are keeping up to date on levels you need to keep an eye on.
Flags
Flags show signs of continuation, they are confirmed when price breaks the upper resistance for bull flags and lower support for bear flags. They are commonly used in trading but with this indicator, it will help you spot ones you may normally miss. Everyone judges flags differently so we have given you the ability to decide how strict you would like the flags to be with the correlation setting, if you set it to 100% the top and bottom lines of the flag must be going at the exact same angle to count as a valid flag.
Wedges
A wedge pattern is typically a reversal pattern, you would normally use these in correlation with volume. For a confirmed wedge you want declining volume as the price reaches the wedge end. You can either try entering at the top/bottom of the wedge pattern or wait until price breaks into the opposite trending direction.
Head & Shoulders
These are reversal patterns, for a confirmed Head and shoulder pattern you want to pair it with declining volume or momentum
You will notice you have a HF option, when enabled this will scan multiple different lengths of pivots to try spot more patterns which the regular settings may miss. If you think you are getting enough you may want to disable this.
Triangles
Triangles help us identify areas where price starts consolidating in a narrow range, once we reach roughly ¾ of the way through the triangle, we will see a break out in either direction, normally confirmation just requires 1 close out of the triangle along with increased volume. If you miss the initial move you may be able to catch a retest if you are lucky!
Double Tops & Bottoms
These patterns are considered reversal patterns. They are confirmed on the break of the neck line with increased volume.
Trend Lines
These are as simple as the name suggests, the lines are calculated slightly differently to other support and resistance points but they will work the same spotting potential areas where price will bounce or reject.
Channels
Similar to Trend lines but these are looking for trend lines at the same angle forming channels where price tends to range between. You have several options to edit these in the settings including the correlation % of the channel lines, how many candles are allowed outside of the channel (fake outs), sensitivity/ frequency the channels appear and whether you use the Wicks or candle Closes to determine where to calculate the channels from.
Linear Regression Channels
Linear regression is the analysis of two separate variables to define a single relationship and is a useful measure from a technical and quantitative point of view.
As seen in the image above, these can be used to help determine key levels in the chart where price is likely to react. In the settings you will be able to adjust its sensitivity to the levels you like to trade.

SUPPORT RESISTANCE STRATEGY [5MIN TF]A SUPPORT RESISTANCE BREAKOUT STRATEGY for 5 minute Time-Frame , that has the time condition for Indian Markets
The Timing can be changed to fit other markets, scroll down to "TIME CONDITION" to know more.
The commission is also included in the strategy .
The basic idea is when ,
1) Price crosses above Resistance Level ,indicated by Red Line, is a Long condition.
2) Price crosses below Support Level ,indicated by Green Line , is a Short condition.
3) Candle high crosses above ema1, is a part of the Long condition .
4) Candle low crosses below ema1, is a part of the Short condition .
5) Volume Threshold is an added confirmation for long/short positions.
6) Maximum Risk per trade for the intraday trade can be changed .
7) Default qty size is set to 50 contracts , which can be changed under settings → properties → order size.
8) ATR is used for trailing after entry, as mentioned in the inputs below.
// ═════════════════════════//
// ————————> INPUTS <————————— //
// ═════════════════════════//
→ L_Bars ———————————> Length of Resistance / Support Levels.
→ R_Bars ———————————> Length of Resistance / Support Levels.
→ Volume Break ———————> Volume Breakout from range to confirm Long/Short position.
→ Price Cross Ema —————> Added condition as explained above (3) and (4).
→ ATR LONG —————————> ATR stoploss trail for Long positions.
→ ATR SHORT ————————> ATR stoploss trail for Short positions.
→ RISK ————————————> Maximum Risk per trade intraday.
The strategy was back-tested on TCS ,the input values and the results are mentioned under "BACKTEST RESULTS" below.
// ═════════════════════════ //
// ————————> PROPERTIES<——————— //
// ═════════════════════════ //
Default_qty_size ————> 50 contracts , which can be changed under
Settings
↓
Properties
↓
Order size
// ═══════════════════════════════//
// ————————> TIME CONDITION <————————— //
// ═══════════════════════════════//
The time can be changed in the script , Add it → click on ' { } ' → Pine editor→ making it a copy [right top corner} → Edit the line 27.
The Indian Markets open at 9:15am and closes at 3:30pm.
The 'time_cond' specifies the time at which Entries should happen .
"Close All" function closes all the trades at 3pm , at the open of the next candle.
To change the time to close all trades , Go to Pine Editor → Edit the line 92 .
All open trades get closed at 3pm , because some brokers don't allow you to place fresh intraday orders after 3pm .
// ═══════════════════════════════════════════════ //
// ————————> BACKTEST RESULTS ( 100 CLOSED TRADES )<————————— //
// ═══════════════════════════════════════════════ //
INPUTS can be changed for better Back-Test results.
The strategy applied to NSE:TCS ( 5 min Time-Frame and contract size 50) gives us 60% profitability , as shown below
It was tested for a period a 6 months with a Profit Factor of 1.8 ,net Profit of 30,000 Rs profit .
Sharpe Ratio : 0.49
Sortino Ratio : 1.4
The graph has a Linear Curve with Consistent Profits.
The INPUTS are as follows,
1) L_Bars —————————> 4
2) R_Bars —————————> 4
3) Volume Break ————> 5
4) Price Cross Ema ——> 100
5) ATR LONG ——————> 2.4
6) ATR SHORT —————> 2.6
7) RISK —————————> 2000
8) Default qty size ——> 50
NSE:TCS
Save it to favorites.
Apply it to your charts Now !!
Thank You ☺ NSE:TCS

1 minute crypto strategy (MTF ZigZag)Please read the following explanation and notes before using this strategy.
This strategy is based on pyramiding. It uses two trend indicators(zigzag) in two different timeframes. One can be used to identify trend in higher timeframe and the other can be used to identify trend in smaller time frame. You can change them according to your preference. The default timeframes are set the same so the strategy only opens the trades according to one timeframe (20min). You can change the timeframe of the trend indicators to any timeframe in the settings but first you should add that timeframe to your chart timeframe so you can see that timeframe in the settings.
The first timeframe is for lower timeframe trend identification and the second timeframe is for higher timeframe identification in the settings.
IMPORTANT NOTES:
1. This strategy works best with low cap high volatile Cryptos. It is riskier on big cap cryptos in long term since it takes longer for them to recover from a big drop.
2. This strategy works in any timeframe. The lower the TF the higher profit.
3. This strategy is LONG only (spot).
4. It is very important to run a deep backtest (for example 1 year) and change the settings accordingly on the cryptos you want to trade to see how it performs in longterm.
5. The default pyramiding value is 30 and 3.33% of the portfolio (100/30=3.33%) is used for each trade. It means the strategy opens maximum 30 trades before the TP is hit. If you change the pyramiding you should also change order size as well in order for the strategy to show the exact calculation (your portfolio amount percentage/pyramiding value=ordersize percentage). If you increase pyramiding value the strategy performs safer in long term.
6. The default TP is 1% and the default SL is 80%. You can change the settings according to the backtest on the coins you want to trade. But it is better not to increase the TP.
7. The indicators don't repaint.
8. Please make sure to backtest and fully understand the way this strategy works before using it.
T&M/E Wave V2Trend and Momentum With Exception Wave Indicator and Strategy:
This strategy is hand made and I have spent days and many hours making it. The strategy is meant to determine the power between buyers and sellers, match the current power with a historic trend (through a moving average statistical equation), and finally volatility (measured with a mix between standard deviation from Bollinger Bands and HPV). Below will be a list of how to determine the inputs for the indicator
**For reference, all numbers, and settings displayed on the input screen are only what I HAVE FOUND to be profitable for my own strategy, Yours will differ. This is not financial advice and I am not a financial advisor. Please do your due diligence and own research before considering taking entries based on this strategy and indicator. I am not advertising investing, trading, or skills untaught, this is simply to help incorporate into your own strategy and improve your trading journey!**
INPUTS:
EV: This is an integer value set to default at 55. This value is equated to the lead value, volatility measurement, and standard deviation between averages
EV 2: This integer is used as the base value and is meant to always be GREATER THEN EV, the default is set at 163. There should be at least a 90+ integer difference between EVs for data accuracy.
EV TYPE & EV TYPE 2: This option only affects the output for the moving average histograms. (and data inserted for strategy)
Volatility Smoothing: This is the smoothness of the custom-made volatility oscillator. I have this default at 1 to show time-worthy-term (3.9%+) moves or significant trends to correspond with the standard deviation declination between EVMA and EVMA2.
Directional Length: This is the amount of data observed per candle in the bull versus bear indicator.
Take Profit: Pre-set takes profit level that is set to 4 but can be adjusted for user experience.
Style:
Base Length: Columns equated using a custom-made statistical equation derived from EV TYPE 2+EV2 to determine a range of differential in historic averages to a micro-scale.
Lead Length: Columns equated using a custom-made statistical equation derived from EV TYPE+EV to determine a range of differential in historic averages to a micro-scale.
Weighted EMA Differential: Equation expressing the differences between exponential and simple averages derived from EV+EV Type 2. Default is displaying none, but optional for use if found helpful.
Volatility: Represents volatility from multiple data sets spanning from Bollinger bands to HPV and translated through smoothing.
Bull Strength: The strength of Bulls in the current trend is derived from a DMI+RSI+MACD equation to represent where the trend lies.
Bear Strength: The strength of Bears in the current trend is derived from a DMI+RSI+MACD equation to represent where the trend lies.
CHEAT CODE'S NOTES:
Do not use this indicator on high leverage. I have personally used this indicator for a week and faced a max of 8% drawdown, albeit painful I was on low leverage and still closed on my take profit level.
85% is not 100% do not overtrade using this indicator's entry conditions if you have made 4 consecutive profitable trades.
Mess around with the input values and let me know if you find an even BETTER hit rate, 30+ entries and a good drawdown!!
V2 UPGRADES:
*Increased Opacity on Bull Bear Columns
*Removed the Stop Loss Input option
*Decreased EV2 to a default of 143 for accuracy
*Added additional disclaimers in the description
* Removed Bull/Bear offset values for accuracy
-Cheat Code
BYBIT:BTCUSDT

Tradesense PremiumTradesense Premium
Tradesense Premium indicator offers a buy & sell signal that is based from our senior analyst who have more than 10years of experience in Forex, Stock and Crypto trading and made it possible by our pine script developers.
Our script can detect market volatility based on the price direction and the absolute value of exponential moving average are multiplied to specific numbers to get a different trading style such as Scalper, Swing Trader and Trend Follower. We also filtered out all the signals using a different known indicators such as RSI, ATR, and ADX, and the results will allow you to enter a trade before the big moves occur. We also included all the important indicator which appears in real-time to get a competitive advantage in any market environment.
If you are a trader for a long time you should know that there is no way to avoid risk in trading. Every single trade could, theoretically at least, end up a loser. That is why our script also provides automatic risk management system which can gives you the ability to know exactly where to take the profit and to stop.
Trading style preset options - Will allows you to get the signals the way you wanted depending on your trading style. Ex. Scalper, Swing Trader or a Trend follower.
Bar color - Our bar colors are based on the price actions which detects the weakness of the bar or if the bar is ranging.
Reversal Zone - This indicator would identify possible price reversal zones.
Support & Resistance - This indicator draw a line at the pivot point to show possible support and resistance area.
Target Profit indicator based on price actions - This indicator will gives you an option to reduce your position or go out of the trade before the reversal happens.
Target Profit / Stop Loss based on ATR - This indicator will gives you a simple but effective risk management system to protect your capital. The TP/SL is based from the ATR.
Alert System - We are giving you an options to customize your alerts.
Our mission is to provide systematic way to build your success.
Release notes: Tradesense Premium V1.1
✅Trading style preset options
✅Bar color
✅Reversal Zone
✅Support & Resistance
✅Target Profit indicator based on price actions
✅Target Profit / Stop Loss based on ATR
✅Alert System
❓Trading style
Currently we have 3 sets of preset options that the user can use.
Scalp - this preset is made for the trader that wants a quick in and out of the trade. The best timeframe to this is 1min to 5mins chart.
Swing - this preset is for the trader who can wait a little bit longer in a trade. The best timeframe to use is 15mins to 1hour chart.
Trend - this preset is made for the busy people that can hold a trade more than a day. The best timeframe to use is 4hours to 1day chart.
❓Bar color
This options will change the color of your bars to lessen the noise of your chart.
Green Color is a bullish indicator
Red Color is a bearish indicator
Orange Color will signify that the trend is weakening
Purple Color is a consolidation/ranging price action
❓Reversal Zone
From the name it self, once the price is already hit the Reversal Zone the price will more likely to reverse or will make a correction.
❓Support & Resistance
When this option is enabled, the support and resistance levels will show up.
❓Target Profit indicator based on price actions
When this option is enabled, you will see a "💰" which means it's time to take profit or reduce your positions.
❓Target Profit / Stop Loss based on ATR
Most of the trader uses ATR as a stop loss level. When this option is enabled, the indicator for Stop Loss and Take Profit will show up and the TP/SL levels can be changed by changing the ATR Multiplier (Default is 1.8).
❓Alert System
Function alert is added and the user can customize it the way they want it.
Bjorgum Double Tap█ OVERVIEW
Double Tap is a pattern recognition script aimed at detecting Double Tops and Double Bottoms. Double Tap can be applied to the broker emulator to observe historical results, run as a trading bot for live trade alerts in real time with entry signals, take profit, and stop orders, or to simply detect patterns.
█ CONCEPTS
How Is A Pattern Defined?
Doubles are technical formations that are both reversal patterns and breakout patterns. These formations typically have a distinctive “M” or a “W” shape with price action breaking beyond the neckline formed by the center of the pattern. They can be recognized when a pivot fails to break when tested for a second time and the retracement that follows breaks beyond the key level opposite. This can trap entrants that were playing in the direction of the prior trend. Entries are made on the breakout with a target projected beyond the neckline equal to the height of the pattern.
Pattern Recognition
Patterns are recognized through the use of zig-zag; a method of filtering price action by connecting swing highs and lows in an alternating fashion to establish trend, support and resistance, or derive shapes from price action. The script looks for the highest or lowest point in a given number of bars and updates a list with the values as they form. If the levels are exceeded, the values are updated. If the direction changes and a new significant point is made, a new point is added to the list and the process starts again. Meanwhile, we scan the list of values looking for the distinctive shape to form as previously described.
█ STRATEGY RESULTS
Back Testing
Historical back testing is the most common method to test a strategy due in part to the general ease of gathering quick results. The underlying theory is that any strategy that worked well in the past is likely to work well in the future, and conversely, any strategy that performed poorly in the past is likely to perform poorly in the future. It is easy to poke holes in this theory, however, as for one to accept it as gospel, one would have to assume that future results will match what has come to pass. The randomness of markets may see to it otherwise, so it is important to scrutinize results. Some commonly used methods are to compare to other markets or benchmarks, perform statistical analysis on the results over many iterations and on differing datasets, walk-forward testing, out-of-sample analysis, or a variety of other techniques. There are many ways to interpret the results, so it is important to do research and gain knowledge in the field prior to taking meaningful conclusions from them.
👉 In short, it would be naive to place trust in one good backtest and expect positive results to continue. For this reason, results have been omitted from this publication.
Repainting
Repainting is simply the difference in behaviour of a strategy in real time vs the results calculated on the historical dataset. The strategy, by default, will wait for confirmed signals and is thus designed to not repaint. Waiting for bar close for entires aligns results in the real time data feed to those calculated on historical bars, which contain far less data. By doing this we align the behaviour of the strategy on the 2 data types, which brings significance to the calculated results. To override this behaviour and introduce repainting one can select "Recalculate on every tick" from the properties tab. It is important to note that by doing this alerts may not align with results seen in the strategy tester when the chart is reloaded, and thus to do so is to forgo backtesting and restricts a strategy to forward testing only.
👉 It is possible to use this script as an indicator as opposed to a full strategy by disabling "Use Strategy" in the "Inputs" tab. Basic alerts for detection will be sent when patterns are detected as opposed to complex order syntax. For alerts mid-bar enable "Recalculate on every tick" , and for confirmed signals ensure it is disabled.
█ EXIT ORDERS
Limit and Stop Orders
By default, the strategy will place a stop loss at the invalidation point of the pattern. This point is beyond the pattern high in the case of Double Tops, or beneath the pattern low in the case of Double Bottoms. The target or take profit point is an equal-legs measurement, or 100% of the pattern height in the direction of the pattern bias. Both the stop and the limit level can be adjusted from the user menu as a percentage of the pattern height.
Trailing Stops
Optional from the menu is the implementation of an ATR based trailing stop. The trailing stop is designed to begin when the target projection is reached. From there, the script looks back a user-defined number of bars for the highest or lowest point +/- the ATR value. For tighter stops the user can look back a lesser number of bars, or decrease the ATR multiple. When using either Alertatron or Trading Connector, each change in the trail value will trigger an alert to update the stop order on the exchange to reflect the new trail price. This reduces latency and slippage that can occur when relying on alerts only as real exchange orders fill faster and remain in place in the event of a disruption in communication between your strategy and the exchange, which ensures a higher level of safety.
👉 It is important to note that in the case the trailing stop is enabled, limit orders are excluded from the exit criteria. Rather, the point in time that the limit value is exceeded is the point that the trail begins. As such, this method will exit by stop loss only.
█ ALERTS
Five Built-in 3rd Party Destinations
The following are five options for delivering alerts from Double Tap to live trade execution via third party API solutions or chat bots to share your trades on social media. These destinations can be selected from the input menu and alert syntax will automatically configure in alerts appropriately to manage trades.
Custom JSON
JSON, or JavaScript Object Notation, is a readable format for structuring data. It is used primarily to transmit data between a server and a web application. In regards to this script, this may be a custom intermediary web application designed to catch alerts and interface with an exchange API. The JSON message is a trade map for an application to read equipped with where its been, where its going, targets, stops, quantity; a full diagnostic of the current state and its previous state. A web application could be configured to follow the messages sent in this format and conduct trades in sync with alerts running on the TV server.
Below is an example of a rendered JSON alert:
{
"passphrase": "1234",
"time": "2022-05-01T17:50:05Z",
"ticker": "ETHUSDTPERP",
"plot": {
"stop_price": 2600.15,
"limit_price": 3100.45
},
"strategy": {
"position_size": 0.1,
"order_action": "buy",
"market_position": "long",
"market_position_size": 0,
"prev_market_position": "flat",
"prev_market_position_size": 0
}
}
Trading Connector
Trading Connector is a third party fully autonomous Chrome extension designed to catch alert webhooks from TradingView and interface with MT4/MT5 to execute live trades from your machine. Alerts to Trading Connector are simple; just select the destination from the input drop down menu, set your ticker in the "TC Ticker" box in the "Alert Strings" section and enter your URL in the alert window when configuring your alert.
Alertatron
Alertatron is an automated algo platform for cryptocurrency trading that is designed to automate your trading strategies. Although the platform is currently restricted to crypto, it offers a versatile interface with high flexibility syntax for complex market orders and conditions. To direct alerts to Alertatron, select the platform from the 3rd party drop down, configure your API key in the ”Alertatron Key” box and add your URL in the alert message box when making alerts.
3 Commas
3 Commas is an easy and quick to use click-and-go third party crypto API solution. Alerts are simple without overly complex syntax. Messages are simply pasted into alerts and executed as alerts are triggered. There are 4 boxes at the bottom of the "Inputs" tab where the appropriate messages to be placed. These messages can be copied from 3 Commas after the bots are set up and pasted directly into the settings menu. Remember to select 3 Commas as a destination from the third party drop down and place the appropriate URL in the alert message window.
Discord
Some may wish to share their trades with their friends in a Discord chat via webhook chat bot. Messages are configured to notify of the pattern type with targets and stop values. A bot can be configured through the integration menu in a Discord chat to which you have appropriate access. Select Discord from the 3rd party drop down menu and place your chat bot URL in the alert message window when configuring alerts.
👉 For further information regarding alert setup, refer to the platform specific instructions given by the chosen third party provider.
█ IMPORTANT NOTES
Setting Alerts
For alert messages to be properly delivered on order fills it is necessary to place the following placeholder in the alert message box when creating an alert.
{{strategy.order.alert_message}}
This placeholder will auto-populate the alert message with the appropriate syntax that is designated for the 3rd party selected in the user menu.
Order Sizing and Commissions
The values that are sent in alert messages are populated from live metrics calculated by the strategy. This means that the actual values in the "Properties" tab are used and must be set by the user. The initial capital, order size, commission, etc. are all used in the calculations, so it is important to set these prior to executing live trades. Be sure to set the commission to the values used by the exchange as well.
👉 It is important to understand that the calculations on the account size take place from the beginning of the price history of the strategy. This means that if historical results have inflated or depleted the account size from the beginning of trade history until now, the values sent in alerts will reflect the calculated size based on the inputs in the "Properties" tab. To start fresh, the user must set the date in the "Inputs" tab to the current date as to remove trades from the trade history. Failure to follow this instruction can result in an unexpected order size being sent in the alert.
█ FOR PINECODERS
• With the recent introduction of matrices in Pine, the script utilizes a matrix to track pivot points with the bars they occurred on, while tracking if that pivot has been traded against to prevent duplicate detections after a trade is exited.
• Alert messages are populated with placeholders ; capability that previously was only possible in alertcondition() , but has recently been extended to `strategy.*()` functions for use in the `alert_message` argument. This allows delivery of live trade values to populate in strategy alert messages.
• New arguments have been added to strategy.exit() , which allow differentiated messages to be sent based on whether the exit occurred at the stop or the limit. The new arguments used in this script are `alert_profit` and `alert_loss` to send messages to Discord

DMT TEMPELTON PECK STRATEGYIntroduction Templeton Peck Strategy Version .
Bring your A-game to the market in A-Team style with DMT Templeton Peck – you’ll love it when this plan comes together!
Using customized standard deviations between historic price action ranges and volume metrics, DMT Templeton Peck enables traders to never miss a change in trend.
In its default state, the DMT Templeton Peck Strategy displays key information, such as:
• Small trend line
• Large trend line
• Position entry prices
• Take profit levels
• Stop levels
• Buy and sell trend signals
In addition to providing core functionality for the indicator’s strategy signals, traders can use this data to enter or exit trades.
When price crosses both trend lines and consolidates there is a high probability that price will continue to move in the same direction. The most profitable results are achieved when trading in the direction of the current large time frame trend.
When small and large trend lines cross a trading signal is generated which can be used to automate trades. Please see the ‘TradingView Alerts’ section of this document for further details.
The Small & Large trend line’s display can be toggled, and their colors modified in the indicator’s style options as shown below.
Basic Strategy
In its simplest form, the strategy is to buy when the price crosses and consolidates above both trend lines and sell when the price crosses and consolidates below both trend lines.
Set amount of first entry to the inputs data.
You can add a commission fee.
Adjust initial capital for your needs.
How to Trade
Confident traders may choose to enter a long position at the point
#1 when the price passes above both trend lines and begins to consolidate.
However, the safer trade is to wait for the trend lines to cross at a point
#2 and then look for an entry in the direction of the local trend.
One price action begins to reverse to the downside the strategy reverses. Confident traders may choose to enter point
#3 when the price passes both trend lines and begins to consolidate once again under the previous price action structure that is now acting as resistance.
A sell signal is generated at the point
#4 which produced a small profit; however, a new short position could have been opened when the price retraced to resistance at a point
#5 and experienced a repeated number of strong rejections.
Do not worry if you miss a trade as there is often more than a single opportunity to enter – like at position #5 when price action retests the previous local price structure as resistance.
The indicator can be used on smaller time frames to scalp or find an entry after a larger time frame has signaled, however smaller time frames will also be “choppy” and should only be traded with a paper-tested strategy.
Traders should take profit on positions at resistance & support levels and look to have fully exited the trade by the time the price crosses back over both trend lines and/or loses a previously established price level.
Indicator Tuning
In its default state, the indicator is tuned for swing trades using 30 minute & 1 hour time frames, however, you are encouraged to experiment with the indicator options.
The input also allows you to set separately longs and shorts for a better view of the trend and to avoid hunts.
Large & Small Length options define how many historic candles are used for the calculation of the relevant trend line.
As a rule of thumb, larger time frames would use smaller values and smaller time frames would use larger values, ie. On a daily chart, a large and small length could be defined as 400 and 100 respectively.
Please be aware that there are limits to the amount of historical data for any intraday level based on your TradingView subscription level:
• Basic – 5000 bars/candles
• Pro & Pro+ - 10000 bars/candles
• Premium – 20000 bars/cables
TradingView Backtest
By utilizing TradingView backtest you can set a specific date for your analysis.